noise‑reducing effects using the nonlinear diffusion method in bone single‑photon
emission computed tomography
著者 伊東 利宗
著者別表示 ITO Toshimune journal or
publication title
博士論文本文Full 学位授与番号 13301甲第5093号
学位名 博士(保健学)
学位授与年月日 2020‑03‑22
URL http://hdl.handle.net/2297/00060037
doi: https://doi.org/10.1097/MNM.0000000000001028
Creative Commons : 表示 ‑ 非営利 ‑ 改変禁止
Downloadedfromhttp://journals.lww.com/nuclearmedicinecommbyQHumhI10/NLEX2+vR8gfKWIIELbpIag1so1Fd+IgWYiMotoQsjwZJhdxI8bWqzpMU8QrBVfJCBZrLRC/3WpvwNdLDKFrRurZlYDO8p//8xdjX/joj8ZERgHcLrYTUg6jGXgIIoPv13e8/6bOImAdkg==on06/13/2019
Downloadedfrom http://journals.lww.com/nuclearmedicinecommby QHumhI10/NLEX2+vR8gfKWIIELbpIag1so1Fd+IgWYiMotoQsjwZJhdxI8bWqzpMU8QrBVfJCBZrLRC/3WpvwNdLDKFrRurZlYDO8p//8xdjX/joj8ZERgHcLrYTUg6jGXgIIoPv13e8/6bOImAdkg==on
06/13/2019
Evaluation of edge-preserving and noise-reducing effects using the nonlinear diffusion method in bone single-photon emission computed tomography
Toshimune Ito
a,b, Masahisa Onoguchi
b, Yuji Ogata
c, Yohji Matsusaka
cand Takayuki Shibutani
bObjectives This study aims to evaluate nonlinear diffusion (NLD) processing to smoothen images while suppressing resolution degradation in single-photon emission computed tomography (SPECT) images. Phantom data were used for NLD method optimization. The resultant optimal settings were used for NLD processing of clinical images.
Materials and methods 99mTc was used to simulate tumors and normal soft tissues. Using the data collected, images were reconstructed. Images were processed using variouskvalues and iteration. The background region’s coefficient of variation (CV) was determined, and the effects of parameters on image properties were examined. NLD- processed images with optimal parameters were compared with Butterworth (BW)-filtered and nine-point smoothing (SM)-processed images to evaluate smoothing filter properties in real and frequency space. Receiver operating characteristic curve analysis was carried out on NLD- processed and BW048-processed bone SPECT images.
Results From CVs in background, with NLD, increased k value and iteration led to a low CV, indicating enhanced smoothing effect. Atk=0.9, a strong noise-reducing effect with less iteration was achieved. Contrasts and recovery coefficients of NLD were the highest. The visual score for SPECT image quality was significantly higher with NLD than with BW048, BW090, and SM. In the low-frequency and high-
frequency ranges, BW048, BW090, and NLD showed similar signal strengths and NLD and BW090 showed high signal strength, respectively. SM processing reduced the signal strength at all frequency ranges. On receiver operating characteristic analysis, noise reduction using NLD
processing enhanced diagnostic performance than with the use of BW processing.
Conclusion NLD processing of bone SPECT images using optimized parameters enabled smoothing with less resolution degradation. Nucl Med Commun40:693–702 Copyright © 2019 Wolters Kluwer Health, Inc. All rights reserved.
Nuclear Medicine Communications2019,40:693–702 Keywords: bone single-photon emission computed tomography, edge-preserving, noise reduction, nonlinear diffusion
aDepartment of Radiology, Saiseikai Yokohamashi Tobu Hospital, Yokohama-City,
bDepartment of Quantum Medical Technology, Graduate School of Medical Sciences, Kanazawa University, Kanazawa andcDepartment of Diagnostic Radiology, School of Medicine, Keio University, Tokyo, Japan
Correspondence to Masahisa Onoguchi, PhD, Department of Quantum Medical Technology, Graduate School of Medical Sciences, Kanazawa University, Kanazawa 920-0942, Japan
Tel: + 81 76 265 2526; fax: + 81 076 265 2526;
e-mail: [email protected]
Received3 January 2019Accepted20 April 2019
Introduction
Bone scintigraphy using single-photon emission computed tomography (SPECT) is useful for diagnosing metastatic bone tumors [1–4]. However, unlike planar images, SPECT images are affected by severe statistical noise owing to low counts. Therefore, a form of smoothing, followed by reconstruction is required for these images. The Butterworth (BW) filter has been studied widely for smoothing SPECT projection data [5–9]. BW is a low-pass filter that is used to cancel noise in high-frequency components. However, such filters cause linear smoothing of the overall signal (including the target signals), which deteriorates the positional resolu- tion of the target signals.
To resolve these conflicting phenomena, nonlinear filter processing was developed to reduce noise components during the capture of target signals [10–13]. However, doubts arise about the clinical adaptation of this approach
owing to the limitations of low pixel values and complex parameter settings. These methods include nonlinear diffusion (NLD) [14], an easy-to-use smoothing algorithm comprising a technique for the optimal convergence of successive approximation processing using the Perona– Malik diffusion (PMD) method [13]. In the PMD method, the number of successive approximations is specified and smoothed, whereas in the NLD method, processing ter- minates when the change in the correlation coefficient of the unprocessed and processed images becomes small. In the NLD method, each pixel is smoothed on the basis of the gradient of the radioactivity concentrations of adjacent pixels and the change in patterns, which reduce the sta- tistical noise while suppressing the deterioration of the target signal’s positional resolution. The NLD method is likely to be very easy-to-use smoothing algorithm owing to the simplicity of each processing setting, calculations
Original article
0143-3636 Copyright © 2019 Wolters Kluwer Health, Inc. All rights reserved. DOI: 10.1097/MNM.0000000000001028
based only on the values in target pixels, and the clinical application for gradual control of edge preservation and smoothing effects on the basis of the parameters described below [14].
The adaptability of NLD for simulation of planar images during myocardial sympathetic nerve scintigraphy was reported in [15]; furthermore, it was reported that the para- meter settings depend on the noise in target images. The adaptability of NLD for applications in SPECT images requires verification. Therefore, here, we aim to evaluate NLD for data acquisition from a phantom that simulated bone SPECT and examine the applications of the resultant optimal NLD conditions for processing clinical images.
Algorithm
The smoothing technique is represented by the follow- ing equation:
Ii;jtþ1¼Ii;jt þ1=4 dt
½CNrNUþCSrSUþCErEUþCWrWUti;j; (1) where t indicates iteration,Ii;jt indicates the pixel value after t-times of processing, and dt is a variable for sup- pressing rapid changes. rNU;rSU;rEU;rWU, CN, CS, CE, andCWwere determined as follows:
rNUi;j¼Ii1;jIi;j; (2) rSUi;j¼Iiþ1;jIi;j (3)
rEUi;j¼Ii;jþ1Ii;j; (4)
rWUi;j¼Ii;j1Ii;j; (5) CN¼ 0:5
1þð rj NUj=kÞ2; (6) CS¼ 0:5
1þð rj SUj=kÞ2; (7) CE¼ 0:5
1þð rj EUj=kÞ2; (8) CW¼ 0:5
1þð rj WUj=kÞ2; (9) wherekis the ratio of noise (0–1.0) of all the pixels and an edge stop function that controls the degree of smoothing with the image gradient delimited by the ratio. The edge- stopping function (k), number of iterations (T), indicating times of processing (t), and step size (dt) were defined as input parameters. Smoothing was performed using Eq. (1).
Materials and methods
A dual detector-type gamma camera E.CAM signature (Canon Medical Systems Co. Ltd, Tochigi, Japan) with a low-energy and high-resolution collimator was used for SPECT. E-Soft was used for image processing with NPAP301-A (both Canon Medical Systems) as a noise-
reducing software for NLD processing. Images were ana- lyzed using Prominence Processor version 3.1 (Nihon Medi- Physics Co., Ltd, Tokyo, Japan) and Image J (National Institutes of Health, Bethesda, Maryland, USA) on a Windows 8 operating system (Microsoft Corp. Redmond, Washington, USA). Statistical analysis was carried out using the SPSS statistics version 22 (IBM SPSS Inc., Chicago, Illinois, USA) and EZR version 1.36 (Saitama Medical Center, Jichi Medical University, Saitama, Japan).
Phantom study Phantom
A National Electrical Manufacturer’s Association, International Electrical Commission body phantom (Kyoto Kagaku Co., Kyoto, Japan) equipped with hot spheres with internal dia- meters of 10, 13, 17, 22, 28, and 37 mm was used in the study.
In the phantom, 99mTc (120 kBq/ml) was filled into six insertions simulating tumors, and99mTc (20 kBq/ml) was used as background (BG) simulating normal soft tissue [16], with an assumed target-to-background ratio of six between the BG and tumor regions [17–19].
Data acquisition and analysis
SPECT scans were acquired in a 128×128 matrix with a magnifying power of 1.0, a pixel size of 4.8 mm, and a total of 90 projections (45 projections/detector) over 360°
with a proximity elliptical orbit, rotation direction of counter clockwise, 2 min/rotation, and a total acquisition time assuming clinical study of 5 and 10 min. The total acquisition time in a reference image was 120 min. The energy window was set to 140 keV±10%. SPECT was reconstructed using the OSEM method with subset six and iteration five [20]. On the basis of the assumption that the statistical noise was removed sufficiently from the reference image, smoothing filtering was not per- formed. For 5 and 10-min images, thek value of NLD was set at 0.1, 0.5, or 0.9;twas varied from 1 to 10; and dt was set at 0.2. NLD was filtered according to the reconstruction data. Comparisons were made with other smoothing methods, that is, nine-point smoothing pro- cessing (SM), BW processing (cut-off, 0.48 cycle/cm;
order, 8: BW048) as pre-filtering simulating clinical ima- ging, and BW processing (cut-off, 0.90 cycle/cm; order, 8:
BW090) for high-frequency enhancement. Scatter and attenuation corrections were not performed.
For data analysis, by setting 12 regions of interest (ROI) as BG on each axial image constructed according to each processing condition, the mean coefficient of variation (CV) was calculated and the CV value was compared with each smoothing method. Subsequently, the optimal conditions for NLD were determined (Fig. 1a). Next, on each axial image obtained from NLD under this condi- tion and using other smoothing methods, ROIs were set on hot spheres of 37, 28, 22, and 17 mm on the basis of the extraction limit (16–20 mm) of the sampling theorem of the LEHR collimator and pixel size. BG contrast and
the recovery coefficient of each hot sphere (Fig. 1b and c) were also calculated. Furthermore, the quality of each 10-min image was evaluated visually by two nuclear medicine experts and three radiological technologists.
The scores were graded from 1 to 5 (1=very poor;
2=poor; 3=moderate; 4=good; and 5=excellent) according to the visibility of the hot spheres and the uniformity of the BG. The images were assigned ran- domly and the evaluator was blinded to the processing type of each image. This visual score was acquired by averaging the results of the observer’s scores. Each image was also two-dimensionally Fourier transformed and the two-dimensional frequency distribution of each condition was evaluated one-dimensionally [21]. The ROIs in BG regions had the same size as that of the 37 spheres. Each calculation was performed using the following equations, where Ct indicated the mean count among ROIs. The 37 mm sphere was used as a reference for the evaluation of the recovery coefficient.
CV¼SDðBGÞ=CtðBGÞ; (10) Contrast¼jCtjCtðBGÞj=jCtjþCtðBGÞj; (11) Recovery coefficient¼Ctj=Ctð37 mmÞ: (12) j=17, 22, 28, and 37 mm.
Statistical analysis
The visual scores for each reconstructed image were compared using the Kruskal–Wallis and Steel–Dwass tests. P value less than 0.05 indicated statistical significance.
Clinical study Patients
Between January 2016 and April 2017, 52 patients with a confirmed diagnosis of spinal disease by clinical follow- up were administered 740 MBq of 99mTc-HMDP intra- venously. After 3 h, they underwent bone scintigraphy SPECT at our institution. The results were used to
distinguish patients with benign disease (all degenerative diseases) from those with malignant disease. The 20 patients involved in the study included 10 patients selected randomly from each group.
Data analysis
The analysis conditions used for SPECT data collection were identical to those used for 10-min phantom data collection. Reconstructed images were processed with BW048 or NLD using the optimal conditions from phantom evaluation. Two nuclear medicine experts (readers 1 and 2) diagnosed benign or malignant cases from the trans-axial SPECT images [22]. The sensitivity and specificity of the results of the continuously dis- tributed test were assessed using receiver operating characteristic (ROC) curve analysis [23]. The diagnosis score was graded on a scale of 1–5 (1=definitively benign; 2=probably benign; 3=ambivalent; 4=prob- ably malignant; and 5=definitively malignant). The images were assigned randomly, and the evaluators were blinded to the processing type of each image. In the ROC curve analysis, to obtain nonarbitrary sensitivity and specificity, the threshold was determined using the Youden Index.
Statistical analysis
ROC scores for the two reconstructed images were compared using the paired t-test.Pvalue less than 0.05 was considered statistically significant.
Results
Phantom study
As indicated (Fig. 2), the CV of the 10-min image (BG:
69.7 count/pixel) for the reference image was 0.059, BW048 was 0.065, BW090 was 0.103, and SM was 0.048.
For NLD images, the CVs for BG ranged from 0.115 to 0.107 fork=0.1 or 0.5 and from 0.095 to 0.046 fork=0.9.
The CV of the 5-min image (BG: 35.6 count/pixel) for BW048 image was 0.074, BW090 was 0.131, and SM was 0.057. For NLD images, the CVs for BG ranged from
Fig. 1
Delineation of regions of interest on a phantom image. Measurement of coefficient of variation (a), recovery coefficient (b), and contrast (c).
Nonlinear diffusion method in bone SPECTItoet al. 695
0.142 to 0.127 fork=0.1 or 0.5 and from 0.114 to 0.060 for k=0.9. For k=0.1 or 0.5, increased iteration gradually resulted in noise reduction; however, fork=0.9, a strong noise reduction effect was obtained with less iteration. As each parameter increased, statistical noise tended to be reduced further; however, overcorrection reduced the contrast and increased the blur component, thereby deteriorating the image quality (Fig. 3). Thus, we determined the optimal NLD parameters as k=0.9, dt=0.2, andT=5 for 10-min images. For 5-min images, k=0.9, dt=0.2, and T=10, which yielded a CV in the BG closest to that of the reference image.
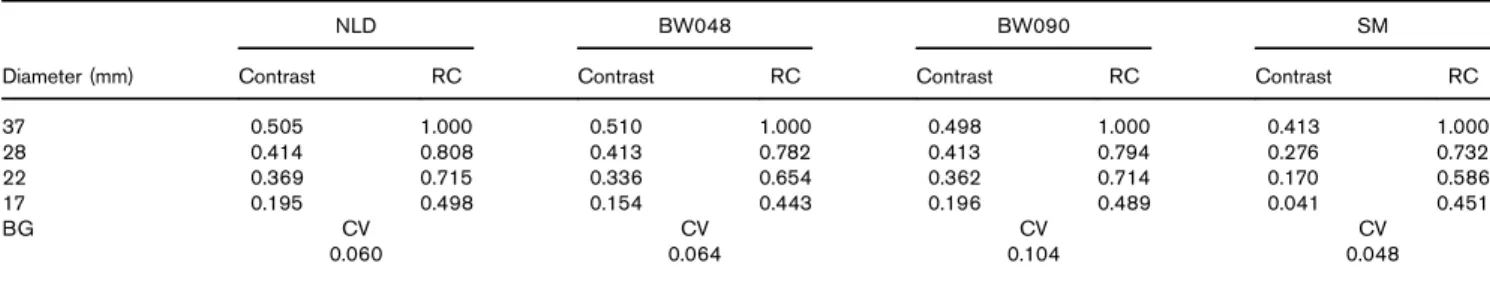
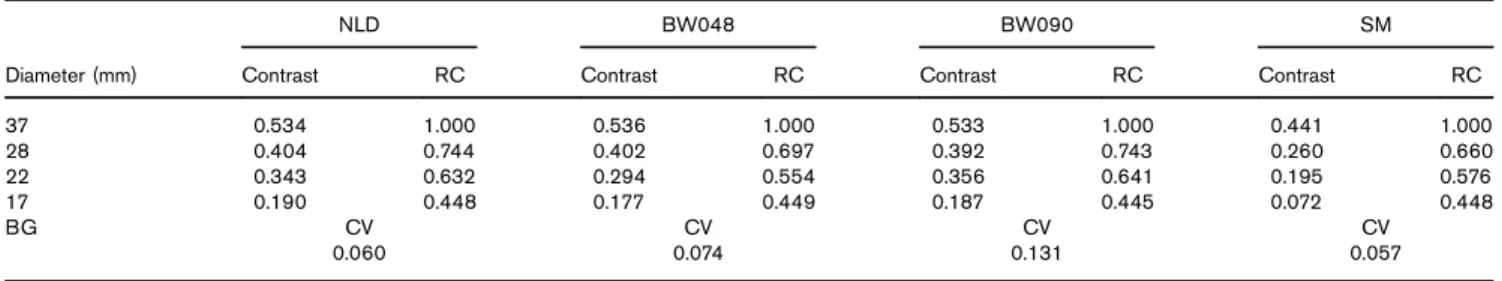
For 10-min images, the contrast ranged from 0.195 to 0.505 for optimal NLD images, from 0.154 to 0.510 for BW048, from 0.172 to 0.498 for BW090, and from 0.041 to 0.413 for SM; for 5-min images, the contrast ranged from 0.190 to 0.534 for optimal NLD images, from 0.177 to 0.536 for BW048, from 0.187 to 0.533 for BW090, and from 0.072 to 0.441 for SM (Fig. 4). The recovery
coefficients were as follows: NLD, 0.498–1.000; BW048, 0.443–1.000; BW090, 0.489–1.000; and SM, 0.451–1.000 for 10-min images and NLD, 0.448–1.000; BW048, 0.449–1.000; BW090, 0.447–1.000; and SM, 0.448–1.000 for 5-min image (Fig. 5). The results of individual phantom analysis are listed in Tables 1 and 2. The 10-min phantom images processed using the four meth- ods are indicated (Fig. 6). The mean (±SD) visual score for NLD images was 4.2 (±0.5), whereas it was 3.2 (±0.5) for BW048 (P=0.073), 2.6 (±0.6) for BW090 (P<0.05), and 1.8 (±0.9) for SM (P<0.05) (Fig. 7). The visual score was the highest for the NLD image. The radial intensity distribution function of each filtering process is indicated (Fig. 8). In the low-frequency domain close to the BW048 cut-off frequency of 0.48 cycle/cm, BW048, BW090, and NLD processing resulted in almost identical signal intensities. In the high-frequency domain close to the BW090 cut-off frequency of 0.90 cycle/cm, the signal intensities were similarly reduced by BW048, whereas NLD and BW090 processing showed high signal
Fig. 2
Evaluation of the coefficient of variation (CV) by each processing parameter and filter processing. (a) 10-min images (BG: 69.7 count/pixel). Thek values used are 0.1, 0.5, and 0.9; iteration varies from 1 to 10. Reference values were 0.059 and 0.065 for the Butterworth (BW) filter (cut-off, 0.48 cycles/cm), 0.103 for the Butterworth filter (cut-off, 0.90 cycles/cm), and 0.048 for the smoothing filter (3×3). (b) 5-min images (BG: 35.6 count/
pixel) Thekvalues used are 0.1, 0.5, and 0.9; iteration varies from 1 to 10. Reference values were 0.059 and 0.074 for the Butterworth filter (cut-off, 0.48 cycles/cm), 0.131 for the Butterworth filter (cut-off, 0.90 cycles/cm), and 0.056 for the smoothing filter (3×3). BG, background.
intensities; BW090 indicated the highest value. SM processing indicated reduced signal intensities at all frequency domains.
Clinical study
ROC analyses of NLD-processed and BW-processed images are shown (Fig. 9). The area under the curve
Fig. 3
Process image of coefficient of variation rates with increasing iterations at fixedkvalues. Increase in iteration caused overcorrection that led to reduced contrast and increased blur component.
Fig. 4
Relationship between sphere diameter and contrast with different filter processing. (a)10-min images (BG: 69.7 count/pixel). (b) 5-min images (BG:
35.6 count/pixel). BG, background; BW, Butterworth; NLD, nonlinear diffusion.
Nonlinear diffusion method in bone SPECTItoet al. 697
for BW and NLD processing were 0.734 [95% confidence interval (CI): 0.6–0.9] and 0.845 (95% CI: 0.6–0.9), respectively (P=0.45), for reader 1 and 0.765 (95% CI:
0.6–0.9) and 0.900 (95% CI: 0.6–0.9), respectively (P=0.55), for reader 2. The sensitivity was 0.60 for BW and 0.80 for NLD, and the specificity was 0.90 for BW and 0.90 for NLD for both readers. The optimal cut-offs for BW and NLD processing were 2.40 and 2.30 for reader 1 and 2.50 and 2.05 for reader 2. Representative
examples of each process are shown (Fig. 10). For both readers, although these differences were not statistically significant, NLD processing appeared to be superior to BW processing.
Discussion
The applicability of the NLD method for reducing statistical noise while suppressing deterioration of positional resolution of the target signal for bone SPECT data was evaluated
Fig. 5
Relationship between sphere diameter and recovery coefficient for each filter processing. (a) 10-min images (BG: 69.7 count/pixel). (b) 5-min images (BG: 35.6 count/pixel). BG, background; BW, Butterworth; NLD, nonlinear diffusion.
Table 1 Individual phantom data after each filter processing (10-min image, background: 69.7 count/pixel)
NLD BW048 BW090 SM
Diameter (mm) Contrast RC Contrast RC Contrast RC Contrast RC
37 0.505 1.000 0.510 1.000 0.498 1.000 0.413 1.000
28 0.414 0.808 0.413 0.782 0.413 0.794 0.276 0.732
22 0.369 0.715 0.336 0.654 0.362 0.714 0.170 0.586
17 0.195 0.498 0.154 0.443 0.196 0.489 0.041 0.451
BG CV CV CV CV
0.060 0.064 0.104 0.048
BG, background; BW, Butterworth; CV, coefficient of variation; SM, smoothing.
clinically using a National Electrical Manufacturer’s Association, International Electrical Commission body phantom. Because nuclear medicine tests are limited by acquisition time and radioactivity or the volume used, the images have low counts, and SPECT images are particularly affected by statistical noise. BW processing can reduce sta- tistical noise; however, smoothing may also cause image deterioration. In the NLD method, each pixel is smoothed by recognizing the gradient of the radioactivity concentra- tions of adjacent pixels and changing patterns. Applying this
property to filter SPECT data will reduce the noise com- ponent while preserving sharp edges.
To determine the optimal conditions for the NLD method, we evaluated the effects of various parameters on BG uniformity; we observed that a larger k value smoothed the edge with a large gradient and that increased iteration was associated with a larger smoothing effect (Fig. 2). Withkset at 0.9, the smoothing effect was rapidly enhanced compared with that at lower kvalues.
These phenomena arose because the BG uniform absorbing region of the body phantom was the target for uniformity evaluation. In the BG region, the gradient of radioactivity concentrations at adjacent pixels is extre- mely small and smoothing is performed by recognizing
Table 2 Individual phantom data after each filter processing (5-min image, background: 35.6 count/pixel)
NLD BW048 BW090 SM
Diameter (mm) Contrast RC Contrast RC Contrast RC Contrast RC
37 0.534 1.000 0.536 1.000 0.533 1.000 0.441 1.000
28 0.404 0.744 0.402 0.697 0.392 0.743 0.260 0.660
22 0.343 0.632 0.294 0.554 0.356 0.641 0.195 0.576
17 0.190 0.448 0.177 0.449 0.187 0.445 0.072 0.448
BG CV CV CV CV
0.060 0.074 0.131 0.057
BG, background; BW, Butterworth; CV, coefficient of variation; NLD, nonlinear diffusion; SM, smoothing.
Fig. 6
Phantom image of each filter processing. (a) Smoothing filter (3×3), (b) Butterworth filter (cut-off, 0.48 cycles/cm), (c) Butterworth filter (cut-off, 0.90 cycles/cm), (d) nonlinear diffusion (k, 0.9; dt, 0.2; it, 5), and (e) reference (acquisition time, 120 min).
Fig. 7
Comparison of the visual score after each filter processing. The mean (±SD) visual score was 4.2±0.5 for nonlinear diffusion (NLD)- processed images, 3.2±0.5 for BW048-processed images, 2.6±0.6 for Butterworth (BW)090-processed images, and 1.8±0.9 for smoothing (SM)-processed images.
Fig. 8
Responses of radius direction distribution with each filter processing.
The output values were normalized to the zero frequency values.
Changes in the signal spectrum distribution with each filter processing.
BW, Butterworth; NLD, nonlinear diffusion; SM, smoothing.
Nonlinear diffusion method in bone SPECTItoet al. 699
minute count differences. Using a largekvalue appears to enhance the smoothing effect. Thus, the parameter set- ting in SPECT, with a smaller count compared with that for planar data collection [15], should take noise into account. Furthermore, when the total activity count is low, as the noise component increases, the smoothing effect is promoted by increasing the iteration. As shown (Fig. 2), increasing the number of image processing iterations led to greater smoothing, but did not result in convergence. An excessive number of iterations resulted in accentuated contour edges and higher image blurring.
Because of the properties of the PMD method (the basic technology in the NLD method), images appear to be smoothed, whereas edges are not only preserved but also emphasized according to repeated arithmetic processing [13]. Thus, increased iterations result in images with emphatic contour edges, increased blur components, and reduced contrast (Fig. 3).
Here, we determined the optimal parameter set that ensured uniformity approximating that of the 120-min image with reduced statistical noise. For planar data
Fig. 9
Receiver operating characteristic curves with area under the curve (AUC) for the diagnosis of bone metastasis on the Butterworth filter and nonlinear diffusion (NLD). The AUC for NLD processing was 0.900 (reader 1) and 0.845 (reader 2). The AUC for Butterworth processing was 0.765 (reader 1) and 0.730 (reader 2).
Fig. 10
Trans-axial bone SPECT image of a 67-year-old man with a history of prostate cancer. (a) Th12 vertebrae for the Butterworth filter (cut-off, 0.48 cycles/cm); (b) Th12 vertebrae for the NLD filter (k, 0.9, dt, 0.2, it, 5); and (c) Th12 vertebrae for the CT image. BW processing diagnosed diffuse uptake in the vertebral body and NLD diagnosed focal uptake in the vertebral body. BG, background; BW, Butterworth; CT, computed tomography;
NLD, nonlinear diffusion; SPECT, single-photon emission computed tomography.
collection, the best method to establish the optimal condition is to understand the status of the edge of the desired site to be preserved in the reference image and determine the optimal iteration [15]. By appropriately combining the parameter values for each total activity count, contrast and partial volume effects that are similar to those of the high-frequency component, which emphasizes processing in the target region (Figs 4 and 5), can be obtained. At the same time, NLD processing has a wide clinical adaptation that enables noise reduction in the BG region (Fig. 2) while suppressing deterioration of the resolution (Figs 6 and 7). This can also be seen from the evaluation of the signal spectrum in frequency space.
The NLD-processed image showed almost the same signal intensity until near the cut-off frequency of BW- processed images under clinical conditions. In the higher frequency domain, although the signal intensity was high, it showed a lower signal intensity that was lower than that of the high-frequency processed image (Fig. 8).
Thus, the NLD method appears to cancel noise com- ponents while preserving high-frequency components that form the contour [24].
For clinical evaluation, NLD noise reduction conferred a higher diagnostic performance than that with BW pro- cessing (Fig. 9), thereby facilitating a differential diag- nosis. The threshold for both methods during ROC analysis was within between 2 and 2.5 for both readers.
As this range is lower than the central value of the 0–5 grading scale (2.5), these values imply that radiologists tended to score these images as‘without malignant dis- ease’. In bone SPECT images in bone scintigraphy, it was found that clarifying the anatomical positions of abnormal accumulation and classifying the accumulation pattern improve diagnostic performance [25]. The NLD method appears to remove unnecessary noise compo- nents while preserving resolution of accumulation regions, thereby facilitating the classification of accumu- lation patterns (Fig. 10).
The limitations of this study are that the study focuses on smoothing alone; there is a lack of inclusion of correction methods. As SPECT and CT are being used globally, attenuation correction ofγ-rays is considered useful [26–29].
SPECT images with corrections that improve positional resolution and reduce deterioration caused by collimator opening width and source distance combined with OSEM are also clinically useful [30,31]. When these corrections are combined, the target noise components change, and setting of the optimal condition on the basis of an understanding of the noise for each correction is required. Furthermore, as shown (Fig. 2), the optimal condition varied according to the noise component. When the count of BG became half and the noise component increased, twice the iteration was necessary. However, this is what was done under imaging conditions and reconstruction conditions in bone SPECT, and it is expected to change especially depending on the reconstruction condition contributing to the noise
component. It is necessary to set the optimum conditions according to the total activity counts of each image in clinical operations. In this study, the target-to-background ratio was set to six from the ratio of the average radioactivity con- centration between bone metastasis and normal bone in the previous study report [32,33]. However, it is also conceivable that the radioactivity concentration changes depending on the bone site and the nature of the lesion [17–19]. In addition, signal components of clinical images also depend on factors such as the radionuclides and collimators used.
Therefore, the utility of the NLD method, optimal para- meter settings, and diagnostic performance should be eval- uated for each imaging method. Alvarezet al.[34] reported the utility of regularized NLD by performing Gaussian fit- ting to the obtained images. Gaussian filtering performed as a priority over the preservation of signal intensity at the target site changes the Poisson distribution of the collected counts to a Gaussian distribution and provides more stabi- lized smoothing. The clinical usefulness of other filtering techniques for restoring edge emphasis and blur has also been reported [5,35]. Future studies comparing the ver- ification of image quality after filtering with all reported image enhancement techniques are warranted. The results reported here also show the utility of NLD for smoothing of bone SPECT images while suppressing the deterioration of spatial resolution. Further research is likely to result in the use of NLD as a clinical application.
Conclusion
Adaptation of NLD processing for bone SPECT was examined by determining optimal parameters that allowed noise reduction while suppressing deterioration of spatial resolution. This approach is useful for edge preservation and noise reduction in SPECT images that are affected by statistical noise. Verification of the utility of NLD for other imaging methods will result in a higher clinical adaptation.
Acknowledgements
The authors thank the staff at the Department of Radiology, Saiseikai Yokohamashi Tobu Hospital, and Kenji Kuse (Canon Medical Systems Co. Ltd, Tokyo, Japan), for providing technical support.
Conflicts of interest
There are no conflicts of interest.
References
1 Kosuda S, Kaji T, Yokoyama H, Katayama M, Iriye T, Uematsu M,et al. Does bone SPECT actually have lower sensitivity for detecting vertebral metastases than MRI?J Nucl Med1996;37:975–978.
2 Schirrmeister H, Glatting G, Hetzel J, Nussle K, Arslandemir C, Buck AK, et al. Prospective evaluation of the clinical value of planar bone scans, SPECT, and (18)F-labeled NaF PET in newly diagnosed lung cancer.J Nucl Med2001;42:1800–1804.
3 Utsunomiya D, Shiraishi S, Imuta M, Tomiguchi S, Kawanaka K, Morishita S, et al. Added value of SPECT/CT fusion in assessing suspected bone metastasis: comparison with scintigraphy alone and nonfused scintigraphy and CT.Radiology2006;238:264–271.
4 Even-Sapir E, Metser U, Mishani E, Lievsshitz G, Lerman H, Leibovitch I. The detection of bone metastases in patients with high-risk prostate cancer:
Nonlinear diffusion method in bone SPECTItoet al. 701
99mTc-MDP planar bone scintigraphy, single- and multi-field-of-view SPECT, 18F-fluoride PET and 18 fluoride PET/CT.J Nucl Med2006;47:287–297.
5 Minoshima S, Maruno H, Yui N, Togawa T, Kinoshita F, Kubota M,et al.
Optimization of Butterworth filter for brain SPECT imaging.Ann Nucl Med 1993;7:71–77.
6 Pierre V, Alain M, Valerie P, Anne H, Rene K, Alain C. Thallium-Gated SPECT in patients with major myocardial infarction: effect of filtering and zooming in comparison with equilibrium radionuclide imaging and left ventriculigraphy.
J Nucl Med1999;40:513–521.
7 Stelter P, Junik R, Krzyminiewski R, Gembick M, Sowinski J. Semiquantitative analysis of SPECT images using99mTc-HMPAO in the treatment of brain perfusion after the attenuation correction by the Chang method and the application of the Butterworth filter.Nucl Med Commun2001;22:857–865.
8 Lyra M, Ploussi A, Rouchota M, Synefia S. Filters in 2D and 3D cardiac SPECT image processing.Cardiol Res Pract2014;2014:11.
9 Mohsensei S, Kamali-As A, Bitarafan-Rajabi A, Entezamahdi SM, Shahpouri Z, Yaghoobi N. Effect of filtration on right ventricular function by the gated blood pool SPECT.Ann Nucl Med2015;29:384–390.
10 Saiant-Marc P, Chen JS, Medioni G. Adaptive smoothing: a general tool for early vision.IEEE Trans PAMI1991;13:514–529.
11 Tomasi C, Manduchi R. Bilateral filtering for gray and color images.IEEE ICCV1998. 839–846.
12 Comaniciu D, Meer P. Mean shift: A robust approach toward feature space analysis.IEEE Trans PAMI2002;24:603–619.
13 Perona P, Malik J. Scale-space and edge detection using anisotropic diffusion.IEEE Trans PAMI1990;12:629–639.
14 Meazek P, Navara M. Selection of optimal stopping time for nonlinear diffusion filtering.Int J Comput Vision2003;52:189–203.
15 Ito T, Onoguchi M, Shibutani T. Adaptation of a short-time collection of the
123I-MIBG myocardial scintigraphy by nonlinear diffusion method.Jpn J Nucl Med Technol2016;36:475–484.
16 Nakahara T, Daisaki H, Yamamoto Y, Iimori T, Miyagawa K, Okamoto T,et al.
Use of a digital phantom developed by QIBA for harmonizing SUVs obtained from the state-of-the-art SPECT/CT systems: a multicenter study.EJNMMI Res2017;7:53.
17 Ichikawa H, Miwa K, Matsutomo N, Watanabe Y, Kato T, Shimada H.
Development of a novel body phantom with bone equivalent density for evaluation of bone SPECT.Jpn J Radiol Technol2015;71:1235–1240.
18 Kaneta T, Ogawa M, Daisaki H, Nawata S, Yoshida K, Inoue T. SUV measurement of normal vertebrae using SPECT/CT with99mTc methylene diphosphonate.Am J Nucl Med Mol Imaging2016;6:262–268.
19 Cachovan M, Vija AH, Hornegger J, Kuwert T. Quantification of99mTc-DPD concentration in the lumber spine with SPECT/CT.EJNMMI Res2013;
3:45.
20 Masuda Y, Nagaki A, Kawabuchi Y, Ohya N, Katafuchi T, Teraoka S,et al. Key point of acquisition, processing and display for standardized images with clinical usefulness (Bone Scintigraphy).Jpn J Nucl Med Technol2016;
36:545–556.
21 Paratt WK.Digital image processing, 2nd ed. Hoboken, NJ: John Wiley &
Sons, Inc; 1991.
22 Nozaki T, Yasuda K, Akashi T. Usefulness of single photon emission computed tomography imaging in the detection of lumbar vertebral metastases from prostate cancer.Int J Urol2008;15:516–519.
23 Metz CE, Heman BA, Shen JH. Maximum likelihood estimation of receiver operating characteristic (ROC) curves from continuously-distributed data.
Stat Med1998;17:1033–1053.
24 Oonishi H. Frequency analysis of SPECT images.Jpn J Radiol Technol 1998;54:1247–1252.
25 Kosuda S, Arai S, Yokoyama H, Katayama M, Wada Y. Differential diagnosis between osseous metastasis and degenerative joint disease of the vertebrae by Bone SPECT: analysis by accumulation pattern.Jpn J Nucl Med1994;
31:613–618.
26 Zhang D, Yang BH, Wu NY, Mok GS. Respiratory average CT for attenuation correction in myocardial perfusion SPECT/CT.Ann Nucl Med2017;
31:172–180.
27 Mariani G, Bruselli L, Kuwert T, Kim EE, Flotats A, Israel O,et al. A review on the clinical uses of SPECT/CT.Eur J Nucl Med Mol Imaging2010;
37:1959–1985.
28 Palmer MR, Donohoe KJ, Francis JM, A Mandelbrot D. Evaluation of relative renal function for patients who had undergone simultaneous liver-kidney transplants using Tc-99m-MAG3 scintigraphy with attenuation correction from anatomical images and SPECT/CT.Nucl Med Commun2011;
32:738–744.
29 Ali I, Riddy TD, Almgrahi A, Anstett FG, Wells RG. Half-time SPECT myocardial perfusion imaging with attenuation correction.J Nucl Med2009;
50:554–562.
30 Takahashi Y, Murase K, Mochizuki T, Sugawara Y, Maeda H, Kinda A.
Simultaneous 3-dimensional resolution correction in SPECT reconstruction with an ordered-subsets expectation maximization algorithm.J Nucl Med Technol2007;35:34–38.
31 Onishi H, Motomura N, Fujino K, Natsume T, Haramoto Y. Quantitative performance of advanced resolution recovery strategies on SPECT images:
evaluation with use of digital phantom models.Radio Phys Technol2013;
6:42–53.
32 Beck M, Sanders JC, Ritt P, Reinfelder J, Kuwert T. Longitudinal analysis of bone metabolism using SPECT/CT and99mTc-diphosphono-
propanedicarboxylic acid: comparison of visual and quantitative analysis.
EJNMMI Res2016;6:60.
33 Mao JL, Zhai W, Lewis R, He W, Avondo J, Hacker M, Sohlberg A. The clinical value of SUV measurements in99mTc-MDP SPECT/CT bone scans in the evaluation of therapy response in prostate cancer patients with bone metastases.J Nucl Med2015;56(Suppl 3):1789.
34 Alvarez L, Lions P, Morel J. Image selective smoothing and edge detection by nonlinear diffusion II.SIAM J Nume Anal1992;29:845–866.
35 Manrique A, Hitzel A, Gardin I, Dacher JN, Vera P. Impact of Wiener filter in determining the left ventricular volume and ejection fraction using thallium- 201 gated SPECT.Nucl Med Commun2003;24:907–914.