熊本大学学術リポジトリ
Characteristics of pulsed discharge plasma in water
journal or
publication title
Digest of Technical Papers‑IEEE International Pulsed Power Conference
volume 2005
page range 1013‑1016
year 2005‑06
URL http://hdl.handle.net/2298/9718
doi: 10.1109/PPC.2005.300473
CHARACTERISTICS OF PULSED DISCHARGE PLASMA IN WATER
T. Namihira
ξ, T. Yamaguchi, K. Yamamoto, J. Choi, T. Kiyan, T. Sakugawa, S. Katsuki and H. Akiyama
Department of Electrical and Computer Engineering, Kumamoto University, 2-39-1 Kurokami, Kumamoto 860-8555, Japan
ξ
email: [email protected]
Abstract
Recently, pulsed discharge plasma produced underwater has been an attractive method to treat wasted water. It is well known that pulsed discharge in water has some physical effects, such as an intense electric field at a tip of discharge plasma, an ultra violet radiation, a chemically radical formation and shockwave generation, for cleaning water. However, the physical characteristics of the pulsed discharge plasma induced underwater are still unclear. For the optimization of the water treatment system utilizing pulsed discharge in water, it is essential to have knowledge about the plasma feature generated by electrical discharge underwater.
In this paper, the temperature of and the electron density in the discharge plasma underwater are described.
The magnetic pulse compressor (MPC) was developed and was used to cause the electrical breakdown in water.
The developed MPC is all-solid state and is, therefore, maintenance-free generator. Two kind of spectroscopic measurements called as the line-pair method and the Stark broadening carried out for define the temperature of and the electron density in plasma produced underwater.
According to experimental results, the temperature of and electron density in the discharge plasma between point- plane electrodes immersed in water are determined 15,000 K and 10
18/cm
3, respectively.
I. INTRODUCTION
In last decade, the pulsed power technology has been developed quickly and can cause the electrical discharge breakdown in liquid medium, such as water and dielectric oil. The discharge in liquid follows some physical phenomena, such as an intense electric field at a tip of discharge column, a radical formation in discharge channel, an ultra violet radiation from discharge and a shockwave generation on boundary between plasma and liquid medium. These phenomena are very attractive for treatments of polluted water and aquatic harmful bacteria and are, however, still lack of knowledge. To realize variety of industrial, medical and environmental application, it is considerable interest in the understanding
of electrical breakdown in liquid medium for the optimization of the application systems.
Analysis of optical emission induced by a pulsed discharge underwater was available to define the temperature (T
P) of and the electron density (N
e) in discharge plasma. In this work, the line-pair method and the Stark broadening of H
αspectral were utilized to compute the T
Pand N
e, respectively.
II. EXPERIMENTAL SET-UP AND CALUCULATION THEORY
A.Pulsed power generator and discharge electrode Fig. 1 shows the electrical circuit of the magnetic pulse compressor (MPC) used in this paper. The maximum charged energy into C
0is 40 J/pulse. Firstly the dc power supply charged C
0up to setting voltage and then the gate- turn-off thyristor (GTO) turned on. After switching GTO, the saturable inductor SL
0saturated and main discharge current from C
0flowed in primary circuit. At that time, the stored energy into C
0forwarded into C
1through the pulse transformer PT
1(4:24). After the energy transportation from C
0to C
1, the saturable inductor SL
1saturated and then the discharge current from C
1flowed in secondary circuit. At the same time, the stored energy into C
1forwarded to load via the pulse transformer PT
2(1:5). Finally, the positive pulse voltage was generated at the secondary circuit of PT
2. All magnetic core in the MPC were made by the FINEMET
TM(FT-3H, Hitachi Metals, Japan). The MPC has no mechanical and discharge switches and was constructed using all-solid state devices. In the experiments, C
0was charged up to 2.0, 2.8 and 3.6 kV.
The needle to plane geometry electrode which was
immersed into tap water (Conductivity: 25 mS/m) was
used as the discharge electrode in this experiment. The
radius of curvature at the needle tip was 30 µm. The
distance between the tip of needle electrode and plane
electrode was fixed at 100 mm. In the experiment, the
applied voltage to and the discharge current through the
needle to plane electrodes were measured using the
voltage divider (EP-100K, Pulse Electronic Engineering
Co., Japan) and the current monitor (Model 110A, Pearson Electronics, Japan), respectively. The Oscilloscope (HP54542A, Hewlett-Packard, USA) recorded the signal from the measurement devices.
Fig. 1 Equivalent circuit of MPC used in the paper.
B.Calculations of plasma temperature and electron density Optical emission spectroscopy is a suitable diagnostic to obtain physical information about discharge plasma, such as composition, temperature and electron density. In this paper, the temperature of and the electron density in the discharge plasma produced underwater were calculated by two kinds of spectroscopic measurements. One is the line-pair method for the calculation of the plasma temperature. Another one is based on the Stark broadening of H
αline which has interaction with the electron density.
The temperature of discharge plasma induced in water was given by the following equation [1],
C kT E Ag
I
u u
1 +
= λ )
ln( (1)
where I, λ, A, g
u, k, T, E
uand C are with emission intensity, its wavelength in nm, its transition probability in 10
8/s, its statistical weight, Boltzmann’s constant in eV/K, plasma temperature in K, upper energy level in eV and constant. In this work, four emission lines from copper as anode needle were observed and were used for the calculation of plasma temperature with the Boltzmann’s plot. The values of λ, A, g
uand E
ufor copper emissions were in Ref. 1.
On the other hand, the electron density was calculated by following equation [2],
2 3
12
]
α λ [ ∆
× 10
× 02 . 8
=
α α
StarkFWHM H
StarkFWHM H
N
e(2)
where N
e, ∆λ
HαStarkFWHMand α
HαStarkFWHMare with electron density in cm
-3, full width at half maximum (FWHM) of H
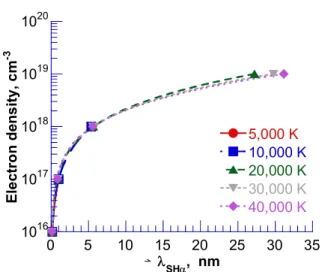
αspectral broadened by the Stark effect in nm and the Stark constant which was given in Ref. 3. Fig.
2 shows the dependence of N
eon ∆λ
HαStarkFWHMfor different plasma temperature. It is obvious from Fig. 2 that the plasma temperature in the range of 5,000 to 40,000 K has no significant influence on α
HαStarkFWHM.
10
1610
1710
1810
1910
200 5 10 15 20 25 30 35
5,000 K 10,000 K 20,000 K 30,000 K 40,000 K
E le ct ro n de ns ity, c m
-3Δ λ
SHα, nm
Fig. 2 Relationship between N
eand ∆λ
HαStarkFWHM.
Fig. 3 shows the typical integrated photograph of discharge plasma produced in water. In all spectroscopy measurements, a dotted circle in Fig. 3 indicates the region of anode needle tip utilized to sample the discharge emission. The optical multi-channel analyzer (Macs 320, Atago Bussan, Japan) monitored the emission coming out of the anode discharge region through the quartz optical fiber. The emission spectra were displayed by the personal computer.
Fig. 3 Typical steel photograph of discharge induced underwater. Condition: V
chinto C
0of MPC=3.6 kV.
III. RESULTS AND DISSCUSSIONS
A.apperances of pulsed discharge plasma underwater The integrated-photographs of the pulsed discharge induced in water are shown in Fig. 3. It will be observed from Fig. 3 that the discharge spread in all directions for all applied voltages in the range of maximum voltage from 67 to 82 kV. The length of discharge plasma was almost same for different applied voltages to the needle electrode. On the other hand, the number of discharge channels increased with increasing the applied voltage.
1014
100mm
GND
+H.V.
67 kV 72 kV 82 kV
100mm
GND
+H.V.
67 kV 72 kV 82 kV
Fig. 3 Discharge appearance for different applied voltages
B.Temperature of pulsed discharge plasma underwater Fig. 4 shows the typical time-integrated copper spectra of discharge emission in case of 82 kV of applied voltage to the needle electrode. In this experiment, the copper needle was utilized as the discharge electrode. It is confirmed from Fig. 4 that four copper spectra were emitted from discharge plasma locating around needle electrode. Fig. 5 shows the Boltzmann’s plot calculated by the Eq. (1) and spectra in Fig. 4. From the inclination of the Fig. 5 (Boltzmann’s plot), the plasma temperature was computed at 15,000 K. This temperature (=15,000 K) was also calculated in cases of 67 and 72 kV of applied voltage.
0 2000 4000 6000 8000
505 510 515 520 525 530 535
Intensity , a rb. u n it
Wavelength, nm
Cu
Cu
Cu
Cu
Fig. 4 Four copper spectra emitted from discharge plasma.
-5 -4 -3 -2 -1 0
3 4 5 6 7 8
ln (I λ /Ag
u)
Upper energy level, eV
Fig. 5 Boltzmann’s plot computed from Eq. (1) and Fig. 4.
C.Electron density in pulsed discharge plasma underwater It should be noted that spectral broadening caused by the Doppler effect can be ignored when the plasma temperature is 15,000 K. For this plasma temperature, the Doppler broadening computed at less than 0.1 nm. The following equation was used in the calculation of the Doppler broadening [1].
O
D
Mc
kT ln 2 ] λ [ 2
2
= λ
∆
21
2
(3)
where ∆λ
D, K, T, M, c and λ
0are with broadening width caused by Doppler effect in nm, Boltzmann’s constant in J/K, plasma temperature in K, radiator mass in kg/molecule, light speed in m/s and unshifted wavelength in nm, respectively.
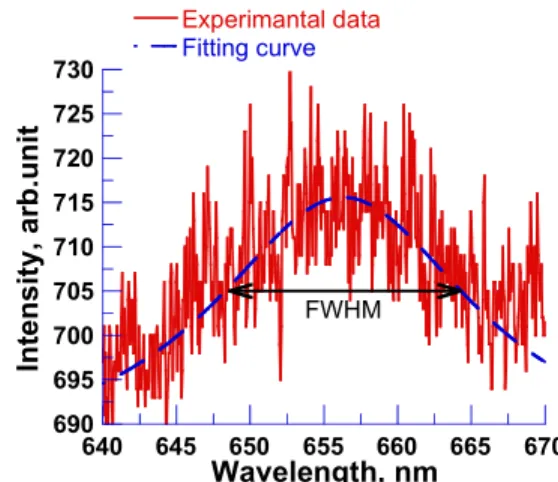
Fig. 6 shows the typical spectral of H
α(=656.3 nm) broadened by Stark effect. To define the FWHM of broadened H
αspectral, the Lorentzian function was used to make the fitting curve to the spectral measured in experiment. The Lorentzian function is well known as a main function for Stark broadening and is expressed as follow.
( ) A ( ) B C
I
O
+ + 2 λ - λ
= ) λ
(
22
(4)
where I, λ, λ
0, A, B and C are with emission intensity, wavelength in nm, center wavelength (656.3 nm for H
α) in nm, constant, constant corresponding to the FWHM and constant, respectively.
690 695 700 705 710 715 720 725 730
640 645 650 655 660 665 670 Experimantal data
Fitting curve
Int ensi ty, ar b.u n it
Wavelength, nm FWHM
Fig. 6 Typical H
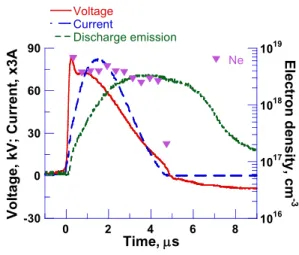
αspectral broadened by Stark effect Fig. 7 shows the dependence of H
αspectral on time and the waveforms of the applied voltage to and the discharge current in the electrode. It was seen in Fig. 7 that the Stark broadening was smaller with time. This is because that the stored energy in C
1of MPC decreased with time.
Fig. 8 shows the time-dependence of electron density in
the discharge plasma underwater and the waveforms of the applied voltage to and the discharge current in the needle to plane electrode. For all applied voltages, the electron density in discharge plasma located around needle electrode exceeded 10
18/cm
3during early discharge time (<4 µs) and then it decreased quickly with being lower voltage and smaller current.
- 3 0 0 3 0 6 0 9 0
0 2 4 6 8
V o l t a g e C u r r e n t
D i s c h a r g e e m i s s i o n
Voltage, kV; Current, X3A Discharge emission, a.u.
T i m e , µ s 690
695 700 705 710 715 720 725 730
640645 650 655660 665 670 Intensity, arb.unit Fitting curve
Intensity, arb.unit
Wavelength, nm A=3700 B=22 C=685
Intensity, aub.unit Fitting curve
Intensity, aub.unit Fitting curve
Intensity, aub.unit Fitting curve
Intensity, aub.unit Fitting curve
Intensity, aub.unit Fitting curve
Intensity, aub.unit Fitting curve
Fig. 7 Dependence of H
αspectral broadened by Stark effect.
-30 0 30 60 90
1016 1017 1018 1019
0 2 4 6 8
Voltage Current
Discharge emission
Ne
Vo lt age, kV; C u rr ent , x3A Elec tron d ensity , cm
-3Time, µs
(a) Applied voltage of 67 kV
-30 0 30 60 90
1016 1017 1018 1019
0 2 4 6 8
Voltage Current
Discharge emission
Ne
Vo lt a g e, kV; Cu rr en t, x3A E lec tr o n de ns it y, cm
-3Time, µs
(b) Applied voltage of 72 kV
-30 0 30 60 90
1016 1017 1018 1019
0 2 4 6 8
Voltage Current
Discharge emission
Ne