65
5
Trends and Problems in Earthquake Prediction Research
S hozo m AtSumurA
Affiliated Fellow
Introduction
The M8.0 earthquake (M: magnitude) which struck Sichuan Province in China on May 12, 2008 was a major disaster of historic proportions, resulting in a total of nearly 100,000 dead and missing. According to newspaper reports, dissatisfaction over the fact that no information predicting this earthquake was provided erupted in the affected area. In particular, the large number of victims claimed by the collapse of elementary and middle school buildings is viewed as a problem, and there has also been criticism to the fact that China’s earthquake countermeasures have devoted energy to observation of well water and the earth’s crust, but seismic countermeasures for buildings have been delayed. [1] This tragedy may become the occasion for a review of policies in connection with earthquake disaster prevention in China and will perhaps lead to seismic retrofitting of buildings. Even though the shock of the Sichuan earthquake had still not subsided, Japan was struck by the Iwate-Miyagi Nairiku Earthquake (M7.2) on June 14, which caused more than 20 deaths. This was followed by the Iwate-Chubu Earthquake (6.8) on July 24. All of these events have strengthened the impression that earthquakes strike unexpectedly, at any time and place. Expressions of this sort have become a way of disposing of the matter and have taken root in the mass media. Considered from another direction, however, it can also be said that this is a clear manifestation of distrust toward earthquake prediction research as it now exists. What, then, is the current state of earthquake prediction research?
Although prediction had been considered a central challenge for earthquake research, not limited to China, but worldwide, this trend changed around the mid-1990s. In Japan, this was occasioned by the Great
Hanshin-Awaji Earthquake (M7.3), which struck Kobe on January 17 causing more than 6,400 deaths, 1995, and subsequently led to a review of earthquake countermeasures as a matter of national policy.
Accompanying this, a complete change in earthquake research was unavoidable, and the previous single- minded dedication to earthquake prediction was replaced by specialization either in more practical disaster prevention research or in more fundamental scientific research. However, this does not mean that earthquake prediction as such was neglected. The proper course in science is “prediction of future events based on an analysis of past events.” It should perhaps be said that this attitude was an attempt to take a more scientific stance toward the word and concept of
“prediction,” which had been used easily or somewhat carelessly up to that time. Today, more than 10 years since that change in direction, what is the relationship of the reformed earthquake research to prediction, and what contribution has it made? Have we not reached the time when we should stop and look back on how close we have come to achieving the specified target, and whether we have failed to grasp the target itself?
This paper examines the content of related research, divided into “earthquake prediction” in the narrow sense and “earthquake forecasting.” Although there are no large differences in the meanings of the words
“prediction” and “forecasting” themselves, here, they will be distinguished as follows: “Earthquake forecasting” means estimation of the magnitude and probability of the occurrence of an earthquake which may occur in a certain location, when that location is designated. The probability of occurrence is obtained by statistical operations premised on the fact that earthquakes occur repeatedly in the same location, and is based on information obtained by excavation of past evidence, that is, the scale, cycle, and deviations in the cycle of earthquakes, and the time which has
1
66
S C I E N C E & T E C H N O L O G Y T R E N D S elapsed since the most recent earthquake. In this case,
the information which provides the grounds for the probability value does not change with increasing time in spite of the fact that the probability value increases with time. In contrast, in “earthquake prediction,” how close the accumulated stress in the source area is to the limit is estimated from the transition in measured data, when a designated earthquake is the object.
In other words, premised on detection of some type of precursory phenomenon, this approach attempts to increase the amount of information itself prior to the occurrence of an earthquake, and in particular, to dramatically increase information immediately before the earthquake. While reviewing the history and current status of both “earthquake forecasting”
and “earthquake prediction,” the author would like to analyze the problems involved in both approaches, including his personal impressions.
Evolution of earthquake prediction research
2-1 Frequency of destructive earthquakes in Japan
First, let us confirm the frequency with which earthquakes actually occur in Japan. This is simpler if earthquakes are classified by magnitude. The average annual frequency of earthquakes in Japan and the
surrounding oceans is 0.1 for M8 earthquakes, 1 for M7, and 10 for M6. Thus, frequency increases by approximately 1 order (10 times) for each 1 order decrease in magnitude. The frequency of earthquakes worldwide is approximately 10 times these numbers, which means, conversely, that approximately 10%
of the world’s earthquakes occur in Japan and the oceans that surround it. [2] For this reason, Japan is known as an earthquake-prone country. What essentially concerns ordinary people is not the size of an earthquake itself, but the extent of damage that it causes. However, the frequency of earthquakes which caused considerable damage in the past is larger than most people recognize.
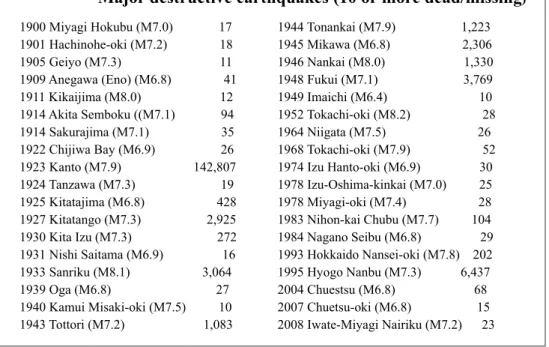
Table 1 presents a list of earthquakes since 1900 which caused 10 or more deaths. Figure 1 is a graph showing the secular change in their cumulative frequency. There have been a total of 36 of these destructive earthquakes during the past 109 years, and their average interval is 3.1 years. From the graph, it appears that the frequency of destructive earthquakes has decreased since 1950, but this seems to be due to slightly decreased seismic activities during the last 50 years, rather than the effects of promoting seismic countermeasures. However, even while saying that the frequency of earthquakes is low, the average interval in the latter part of the period is 4.5 years, and a revival of activity can also be seen in recent years.
Table 1 : List of earthquakes causing 10 or more deaths/missing persons in Japan since 1900 (Year, location, magnitude, number of dead/missing)
Prepared by the STFC based on Reference
[3]2
Q U A R T E R L Y R E V I E W N o . 3 1 / A p r i l 2 0 0 9
67
The feeling that earthquakes occur at long intervals and have no particular relationship with oneself, in spite of the actual situation, can be attributed to the fact that people do not know where a given earthquake will strike. The objective of researching earthquakes should be to give some type of answer to this question, namely, where and what kind of earthquakes will occur in the future. In this sense, earthquake prediction, while being a challenge for scientific research, was at the same time a “dream”
of humankind. However, prediction is still a “dream”
today. This is because there are still no examples which are widely recognized as successful earthquake prediction in the strict sense. Therefore, let us begin by tracing the history of earthquake prediction research up to the present.
2-2 History of earthquake prediction research in various countries
Saying that there have been absolutely no successful attempts in earthquake prediction may be somewhat misleading. First, some examples which are generally considered to be successful predictions should be mentioned. The most famous example is the Haicheng earthquake (M7.3) in Heibei Province, China in 1975. [4] Seismic activity had become active in the vicinity several years before the earthquake, and various anomalous phenomena, including microtremors, crustal movements, and changes in the groundwater, occurred frequently beginning several
days before the event. The earthquake warning which was issued based on these precursory phenomena was effective, and a large number of people were able to take refuge. In spite of this, it is difficult to recognize this success as the result of earthquake prediction in the scientific sense because no warning was issued before the Tangshan Earthquake (M7.8) which struck the same Hebei Province in 1976 and caused an historically-unprecedented 240,000 deaths.
Although it seems that China subsequently continued with attempts at earthquake prediction, there have been no reports of success. The 2008 Great Sichuan Earthquake mentioned in the Introduction is an example of failure. Thus, in view of the inability to demonstrate reproducibility and universality, the above-mentioned example cannot be regarded as a scientific achievement.
Another well-known example of research is the VAN method in Greece. Greece is extremely seismically active because it is located at a plate convergence zone, and as a result, it has suffered much damage due to earthquakes exceeding M5. A research group led by Prof. Varotsos of the University of Athens proposed a method of earthquake prediction based on anomalous changes in monitoring signals from a seismic geoelectric potential observation network installed at the southern edge of the Balkan peninsula. A successful example which resulted in an actual evacuation in 1993 was reported. [5] However, some have also expressed doubts about the objectivity
図表 予知連による指定地域と実際に起きた以上の地震
年
月
年
月
年
月
年
月
年
月
年
月
年
月
年
月
年
月
年
月
年
月
年
月
年
月
年
月
年
月
年
月
年
月
年
月
年
月
年
月
年
月
年
月
Figure 1 : Distribution of cumulative number of destructive earthquakes (data at points in Table1)
Prepared by the STFC
S C I E N C E & T E C H N O L O G Y T R E N D S of this method because the mechanism responsible
for producing the anomalous subterranean electrical signals as a precursory phenomenon is unknown.
On the other hand, another report supported the reliability of the VAN method based on a statistical study. [6] Although no conclusion has been reached, the VAN method has had a large effect on this area of research, and in Japan as well, earthquake prediction by electromagnetic techniques now occupy the mainstream position in sessions on earthquake prediction at conferences, taking precedence over mechanical methods based on seismic and crustal movements, groundwater, and the like.
The fact that the VAN method has become the main topic in conferences stirred a worldwide debate as to whether earthquake prediction is possible in principle.
This debate was ignited by Prof. R.J. Geller (then Assistant Professor), who had recently joined the University of Tokyo from Stanford University. Prof.
Geller contributed papers to Nature and other journals asserting that prediction is impossible in principle because the time of occurrence and magnitude of earthquakes is controlled by contingency. [7] This claim was countered by a group led by Prof. M. Wyss of the University of Alaska (now at WAPMERR (World Agency of Planetary Monitoring and Earthquake Risk Reduction), who held an international symposium on earthquake prediction and argued that precursory phenomena unmistakably exist. Thus, in the 1990s, an unprecedented controversy developed between a faction claiming that earthquake prediction was possible and a faction claiming it was impossible.
Thereafter, the controversy was gradually forgotten without reaching any definitive conclusion, and earthquake prediction research as a whole showed a declining tendency.
The United States was no exception to this trend.
Interest in earthquake prediction research in the United States is concentrated on the San Andreas Fault on the West Coast. This can be attributed to the fact that the Fort Tejon Earthquake (M8.0) which struck Los Angeles in 1857 and the 1906 San Francisco Earthquake (M7.8) occurred along this fault, and a recurrence of these earthquakes is feared. Because this fault undergoes steady slip motion in the intermediate area between these two great earthquakes, great earthquakes do not occur in the intermediate region.
M6 class earthquakes had occurred at intervals of somewhat more than 20 years near the town of
Parkfield, which is located in this region, and the next earthquake was forecast to occur by 1993. As there was no concern about injury due to an earthquake of this size in that area, this was perceived to be a favorable opportunity for earthquake prediction.
Numerous observation devices and human monitors were concentrated at the site for an earthquake prediction experiment call the “Parkfield Experiment,”
but the expected earthquake failed to materialize. An M6 earthquake actually occurred in 2004, which was more than 10 years late and was probabilistically low, but in this case, the expected precursory phenomena were not detected. [8] This marked a turning point, after which earthquake prediction research also waned in the United States, following the trends in other countries.
2-3 History of earthquake prediction research in Japan
Japan has always played a leading role in earthquake prediction research. In 1962, the authorities in the scientific world of the time compiled recommendations on the direction of earthquake prediction research in a document called “Earthquake Prediction- Current Status and Plans for Its Promotion” (so- called “Blueprint”), and based on this, an earthquake prediction project was launched in 1965 with a budget from the government. [9] The Coordinating Committee for Earthquake Prediction (hereinafter, Coordinating Committee) was established in 1969, and as an advisory body to the President of the Geographical Survey Institute, its activities have continued to the present. In 1970, the Coordinating Committee identified seismic hazard regions nationwide and issued recommendations that observation and monitoring should be strengthened in these areas (subsequently revised in 1978). In designating these areas, areas were selected not based only natural conditions, but also considering social conditions.
According to Yoshimitsu Okada (now President of
the National Research Institute for Earth Science
and Disaster Prevention), many major earthquakes
have occurred in the designated area in the 29 years
since the revision, including the Great Hanshin-
Awaji Earthquake, and a prediction success rate
of 80% was achieved. (Figure 2 ). [10] On the other
hand, Katsuhiko Ishibashi, who was an assistant in
the Earthquake Research Institute at the University
of Tokyo at the time (and later became a Professor
of Kobe University), presented his theory of a
69
Great Suruga Bay Earthquake at the 1976 Autumn Conference of the Seismological Society of Japan. [11]
At Suruga Bay, strain has continued to accumulate for more than 120 years since the Ansei-Tokai Earthquake of 1854, and it has been pointed out that this area is now at an extremely volatile crisis point.
The government attached considerable importance to Ishibashi’s theory, and in 1978, enacted the first law, which was called the “Special Measures Law for Countermeasures against Large Earthquake,” [12]
for earthquake countermeasures for a M8 class Suruga Bay Earthquake, i.e., a Tokai Earthquake.
Based on this law, the area where a seismic intensity of 6 or higher was assumed, centering on Shizuoka Prefecture, was demarcated as an “Area under Intensified Measures against Earthquake Disaster,”
and routine monitoring of this area was assigned to the Japan Meteorological Agency. In order to fulfill its mission of predicting Tokai earthquakes, the Japan Meteorological Agency organized the “Earthquake Assessment Committee for Areas under Intensified Measures against Earthquake Disaster (EAC),”
which thereafter held monthly meetings to discuss
arrangements. During this period, in 1978, the Izu- Oshima-Kinkai Earthquake (M7.0) occurred on the active fault between the Izu Peninsula and Izu- Oshima Island, causing 25 deaths. In this earthquake, anomalous phenomena were discovered before the actual occurrence in a diverse range of observation items, including seismic activity, crustal movement, groundwater level, radon gas concentration, and others. Thus, it was evaluated that there still remains one step away to actually predicting earthquake. [13]
In 1977, a group headed by Masakazu Otake (now Professor Emeritus of Tohoku University and Chair of the above-mentioned Coordinating Committee) discovered a quiescence in seismic activity around Oaxaca in Mexico and published a paper warning of an impending major earthquake. The following year, in 1978, the M7.7 Oaxaca Earthquake occurred, giving a strong impression that earthquake prediction is possible. [14] From the 1970s through the 1980s, Japan developed a nationwide microtremor observation network, and earthquake prediction research centers were established in universities and national research institutes. In view of these and similar examples, it
Figure 2 : Regions designated by the coordinating committee for earthquake prediction and actual earthquakes M6.7 or larger
Source : Reference
[12]S C I E N C E & T E C H N O L O G Y T R E N D S can be said that this was the period when earthquake
prediction aroused the highest expectations in Japan, and it was believed that earthquake prediction would be realized in the near future.
2-4 Impact of the Great Hanshin-Awaji Earthquake
On January 17, 1995, when the worldwide debate on the possibility of earthquake prediction was at its peak, the Great Hanshin-Awaji Earthquake (M7.3) occurred unexpectedly, rupturing an active fault from the city of Kobe to Awaji Island, and more than 6,400 persons died in the ensuing disaster. Although some reports had forecast this earthquake, the residents of the region gave hardly any thought to the danger of a massive earthquake. Therefore, there was strong criticism of earthquake research, which had not issued effective advance warnings in spite of the unprecedented numbers of victims in recent years.
This became the occasion for a sweeping review of the position of prediction research. The impact of the Hanshin-Awaji Earthquake was also sufficient to cause a major change in national policy. While this did not led to a rejection of the concept of earthquake prediction, dependence on prediction in earthquake countermeasures was fundamentally eliminated.
Concretely, a new Earthquake Research Division was established in the former Science and Technology Agency (later moved to the Earthquake and Disaster- Reduction Division, MEXT). The “Headquarters for Earthquake Prediction Research Promotion” which had existed up to that time was renamed the “Headquarters for Earthquake Research Promotion” (hereinafter,
“HERP”), and was also reorganized. [15] A Policy Committee and an Earthquake Research Committee were established under HERP, and a large number of sectional meetings and subcommittees were established. These committees conduct short-term and long-term assessments of Japan’s earthquake activities and communicate the results to the larger society by way of the mass media. The name “prediction” in administrative organizations was removed or changed.
However, this does not mean that “prediction” was eliminated completely. At one time there was a view that overlapping of the Earthquake Prediction Coordinating Committee and the Earthquake Research Committee was a problem and the Coordinating Committee should be abolished, but ultimately the Coordinating Committee has continued to exist up to
the present. In spite of the fact that discussions in the two Committees partially overlap, their purposes and the nature of their evaluations are slightly different.
The Earthquake Assessment Committee in the Japan Meteorological Agency also survived. Although this is due to the formal provisions of the existing law, this body has continued to exist because hopes for prediction have not been abandoned, at least in the limited case of Tokai earthquakes. In this connection, it may be noted that the Central Disaster Management Council conducted a review of the assumed source area of Tokai earthquakes in 2001. [16] Based on new observational information, the source area that had existed until that time was greatly revised, and the object area for disaster prevention countermeasures was expanded. However, the basic framework and approach to prediction remained unchanged.
Change to earthquake forecasting
As a change in policy accompanying the establishment of HERP, administrative policies changed from the former orientation toward prediction to forecasting the occurrence of earthquakes. As mentioned previously, earthquake forecasting does not pursue precursory phenomena, but rather, assesses the probability of the occurrence of a major earthquake statistically, based on an assessment of active faults and events which have occurred in the past.
3-1 Construction of the Kiban Network (basic nationwide seismic network) One aspect which underwent a major transformation was the nationwide observation network. [15] The basis of observation of crustal movement is observation of earthquakes and crustal movement (expansion/
contraction, rising/falling of the ground surface). Up to that time, however, observation of earthquakes had been the responsibility of the Japan Meteorological Agency, universities, and national research institutes, while the Geographical Survey Institute had been responsible for observation of crustal movement. It can be said that this period was an “age of rival warlords.”
While these various organizations provided coverage for the entire country, the observational density was coarse. Moreover, specifications were not unified.
More than anything else, this was a high barrier to mutual use of data between organizations. An enormous length of time, on the order of several years,
3
71
and a corresponding amount of work were required in making geodetic measurements of the entire country.
With the world in the midst of the IT revolution and rapid technical progress in the fields of observation, communications, and data processing, an outdated observation network which failed to change was fated to be left behind. Therefore, following the Great Hanshin-Awaji Earthquake of 1995, HERP decided to budget new funds and promote the construction of a nationwide observation network based on unified specifications. Broadband, high accuracy technology was adopted for seismic observation, and quasi-real time measurement using GPS was applied to crustal movement. As a result, in less than 10 years, Japan succeeded in constructing a high performance, high density observation network unprecedented in the world. The content of what came to be called the
“Kiban Network” (basic nationwide seismic network) comprises a crustal movement observation network using GPS (approximately 1400 points nationwide, centering on GEONET by the Geographical Survey Institute), a high sensitivity seismograph observation network (approximately 1000 points, centering on Hi- net of the National Research Institute for Earth Science and Disaster Prevention (NIED)), a strong ground motion observation network (approximately 7000 points including the NIED’s K-net), and a broadband seismograph observation network (approximately 100 points, centering on NEID’s F-net). It is particularly
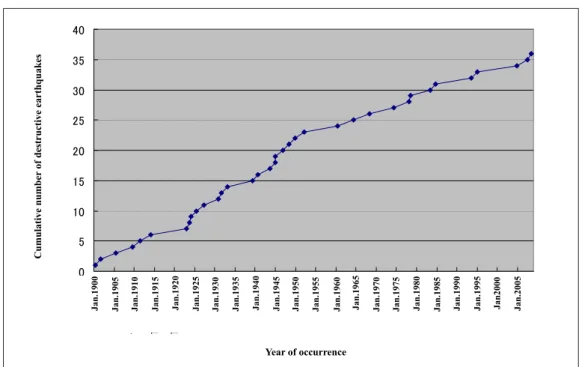
noteworthy that all the data obtained by this Kiban Network are publicly available via the internet. As a result, researchers throughout the country are placed in virtually the same research environment concerning the availability of data, irrespective of the university or institute to which they belong, and this at a stroke has accelerated free competition in research. Now, when a destructive earthquake or other earthquake which should be considered a problem occurs, the basic information characterizing the earthquake, such as the geometry of the fault system, rupture process, etc., is analyzed and reported extremely quickly. Figure 3 shows the transition in the number of earthquakes captured in and around Japan from the earthquake catalog of JMA (the Japan Meteorological Agency).
This does not mean that there was a particularly great change in seismic activity as such during this period, but the number of earthquakes captured has increased steadily as the observation network was expanded.
In particular, it can be understood that the increase was very rapid from around 2000, when the Kiban Network came on-stream.
Furthermore, in recent years, the reach of research and observation has expanded from land to ocean areas. JAMSTEC (Japan Agency for Marine-Earth Science and Technology) constructed a deep sea drilling vessel called the “Chikyu” and has begun research on the deep crustal structure of the earth in ocean areas, and is also promoting the development
Figure 3 : Number of earthquakes captured in and around Japan by the Japan Meteorological Agency Source : Reference
[12]科 学 技 術 動 向
2008 年 10 月号
30
図表 4 気象庁によって日本周辺で捕捉された地震数
出典:気象庁地震カタログ
合である。こうした管轄の仕方は、
データを囲い込むことにつながり、
研究活動に障壁をつくり、阪神・
淡路大震災後の反省をうむ発端と なった。しかしその反面、それぞ れの大学がそれぞれの地域の地殻 活動の監視と評価を担うという、
いわば「ホームドクター」としての 意識と責任感を産み出す素因でも あった。これに対して現在の状況 は、全国の研究者が同じデータを 使って一斉に同じ解析に取り組む、
というある種の無駄を内包した過 当競争の場を作り出している。処 理の迅速化と情報管理の一元化と いう意味では進歩と言えるだろう が、それぞれの地域のテクトニク ス(プレート・テクトニクスに代表 される造構運動)と活動状況を熟知 した「ホームドクター」による長期 的視野に立った監視と研究を推奨 したい立場からは一種のディレン マを感じざるを得ない。
もう一点は、地震発生の周期と 技術革新の速さとのタイムスケー ルの違いについてである。少なく とも数十~数百年はかかる地震の 一周期を勘案すると、安定した条 件下で長期の観測を継続すること
が必須要件となるが、技術革新と 体制の変遷による観測条件の変化 には避け難いディレンマがある。
技術革新が必ずしも良い結果に結 びつくとは限らないのである。例 えば、気象庁の 80 年を超える地 震カタログ(図表 4)は我が国が世 界に誇るべき貴重なデータ資産で あるが、その中には技術革新と体 制変化を原因とするマグニチュー ドの不統一が混ざっており、この ことが折角のデータの価値を大き く毀損する元凶となっている。大 規模に配備した基盤観測網を長年 にわたって維持運用していくこと は、これを建設・整備することよ りも大きな困難を伴う。世の中の 変遷に乗ぜられない観測の一貫性 を保持していくことも、今後の重 要課題となることを意識しておく 必要がある。
3‐2
地震動予測地図の作成
推本が基本的な事業課題として 取り組んできたのが「全国を概観
した地震動予測地図」の作成であ る
15)
。前述したとおり、ここでい う「予測」とは、同じ場所における 地震発生が準規則的であることを 前提にして、次回の発生を確率値 として評価することを言う。前兆 現象の有る無しはいまだ議論の俎 上にあるが、地震発生の準規則性 については大方の研究者の支持が 得られており、このことが、行政 による施策が「地震予知」から「地 震発生予測」に転換された理由で もある。評価に必要な情報は、当 該地震の発生周期とそのばらつ き、 お よ び 最 新 発 生 時 期 の 3 個 のパラメーターである。このほか に、規則性からの逸脱を表現する 統計モデルが必要となるが、推本 では、一定量の応力蓄積率がラン ダムな擾じょうらん
乱を受けるという BPT (Brownian Passage Time) モデル を採用している。
こうしたお膳立てのもと、実際 に進められる手続きは次のとおり である。海溝沿いなど海域に起 きる地震は M8 程度の規模を持つ が、その周期は数十~数百年と短 く、したがって、多くの地震につ いて過去の履歴が残されている。
※ 2000 年頃からの急増は、基盤観測網の整備による。
1930 1940 1950 1960 1970 1980 1990 2000
発 生 年
0 . 50000 . 100000 .
捕 捉 地 震 個 数 / 年
Year of occurrence
Number of earthquakes captured / year
* The rapid increase from around the year 2000 was due to the implementation of the Kiban Network.
S C I E N C E & T E C H N O L O G Y T R E N D S of a sea-bottom seismograph network to cover Japan’s
coastal seas. [17] The Japan Coast Guard and universities are engaged in the development of a crustal movement observation network in ocean areas by combining GPS and acoustic ranging devices installed on the sea bottom. [18]
It can be said that the construction of a nationwide observation network, beginning with the Kiban Network, has had a great effect on the promotion of earthquake research as a whole, including the disaster prevention aspect, but this does not mean that there are no problems in these efforts. The following two points may be mentioned as misgivings of the author, mainly in connection with the operational aspect. In the
“age of rival warlords” before the construction of the Kiban Network, the former Imperial universities had substantial jurisdiction over their respective regions, separately from the nationwide network administered by JMA. For example, Hokkaido University had jurisdiction in Hokkaido, Tohoku University in Tohoku, Tokyo University in Kanto and Shinetsu, Nagoya University in Chubu, Kyoto University in Kinki, Chugoku, and Shikoku, and Kyushu University in Kyushu. This method of dividing jurisdictions led to partitioning of the data, creating barriers to research activities, and became a starting point for reflection after the Great Hanshin-Awaji Earthquake.
Conversely, however, this system also was a factor that produced a consciousness and sense of responsibility as a “home doctor,” because each university was responsible for monitoring and evaluating the crustal movements in its own area. In contrast, the present system has produced a situation of excessive competition, with connotations of a certain kind of waste, in that researchers throughout the country are engaged in exactly the same analysis using identical data. This can perhaps be called progress, in the sense of speeding up processing and unifying information management. However, from the standpoint that one wishes to recommend monitoring and research from a long-term perspective by a “home doctor,” who has a thorough knowledge of the tectonics (structural motion, represented by plate tectonics) and condition of activity of that researcher’s own region, the feeling of a kind of dilemma is unavoidable.
Secondly, there are also differences in the time scale in the cycle of earthquake occurrence and in the speed of technical innovation. Considering the fact that one cycle of an earthquake is at least several decades to
several centuries, continuation of observation over the long term under stable conditions is an essential condition. However, it is difficult to avoid changes in observation conditions due to technical innovation and the evolution of the system. This is also a dilemma.
Technical innovation does not necessarily lead to good results. For example, the Earthquake Catalog (Figure 3) prepared by the Japan Meteorological Agency, which covers more than 80 years, is an invaluable data resource of which Japan can boast to the world, but due to technical innovations and changes in the system, the magnitude shown in the Catalog is not uniform. This has greatly reduced the value of the data so painstakingly collected.
Long-term maintenance and operation of the Kiban Network, which is deployed on a large scale, is also accompanied by greater difficulties than construction and maintenance of the system. It is necessary to be aware that preserving the consistency of observations unaffected by changes in the larger environment is an important challenge for the future.
3-2 Preparation of Seismic Hazard Maps HERP is engaged in the preparation of a “National Seismic Hazard Map of Japan” as a fundamental part of its mission. [15] As mentioned previously,
“forecasting,” as the term is used here, means an assessment of the probability of the occurrence of the next earthquake preconditioned on an assumption that earthquakes occur with quasi-regularity in a given location. Although the existence of precursory phenomena is still a matter of debate, the majority of researchers support the quasi-regularity of earthquakes. This is also a reason for the change in the policies of administrative authorities from “earthquake prediction” to “earthquake forecasting.” The information necessary for an assessment comprises three parameters, namely, the earthquake occurrence period and its deviation and the date of the most recent earthquake for the earthquake in question. In addition, a statistical model which expresses the deviation from regularity is also necessary. HERP has adopted a BPT (Brownian Passage Time) model in which the rate of accumulation of a certain amount of stress is affected by random disturbances.
Based on these arrangements, the procedures which
can actually be promoted are as follows. Although the
earthquakes which occur in ocean areas, for example,
along ocean trenches, have a scale on the order of
73
M8, their cycle is short, at several decades to several 100 years. Accordingly, evidence of many such earthquakes can be found in the historical record. As a result, assessment of the probability of occurrence is comparatively easy, and reliability is high. On the other hand, earthquakes which occur at shallow active faults in inland areas have long time scales of at minimum 1000 years or more, and their histories are virtually unknown. HERP specified 98 active faults with lengths exceeding 20km as major active faults (Figure 4; total of 110 as a result of subsequent additions), and conducted a survey of these faults. It then attempted to determine the values of the above- mentioned parameters for each of the active faults by performing trench excavation surveys (survey by excavating a shallow trench) and boring surveys (survey by boring a deep hole). In actuality, cases in which the values of parameters are determined conclusively are rare, and considerable deviations and indeterminacy cannot be avoided. Nevertheless, the
provisional results were compiled over a period of 10 years. The numerical distributions of the magnitudes of the earthquakes which are assumed to occur here are as shown by the black bars in Figure 5, and their average magnitude is M7.3. (The total number is 136 because it is considered that earthquakes will occur in segments of the long and large faults among the 98 major active faults.) An assessment of active faults smaller than the major faults was also made, resulting in an average of M6.8 (shown by the white bars in Figure 5, total number of 178). In addition to these, as “earthquakes having a sources which are difficult to designate the seismic source,” the probability of occurrence of “problem earthquakes” was calculated from the actual measured distribution of the magnitude of the earthquakes and largest earthquake set in each region. The result of combining all of the above assessments is considered to be the earthquake occurrence probability at each location.
Figure 4 : Major active faults listed by the Headquarters for Earthquake Research Promotion
Source : Reference
[15]S C I E N C E & T E C H N O L O G Y T R E N D S If the occurrence probability of earthquakes can be
obtained, the procedure moves next to assessment of the motion at each location, that is, ground motion.
Here, the final surface ground motion is calculated using a combination of various assessment techniques, including evaluation equations for motion based on the magnitude of the earthquake and the distance from the source, or a seismic wave synthesis method based on a fault model, and assessment of the amplitude of the seismic wave due to the subsurface structure and basement structure, etc. Local governments determine damage assumptions and disaster prevention countermeasures based on these results.
The detailed description of these procedures will be omitted here. However, the first trial edition of

![Figure 3 : Number of earthquakes captured in and around Japan by the Japan Meteorological Agency Source : Reference [12]科 学 技 術 動 向 2008 年 10 月号 30 図表 4 気象庁によって日本周辺で捕捉された地震数 出典:気象庁地震カタログ合である。こうした管轄の仕方は、データを囲い込むことにつながり、研究活動に障壁をつくり、阪神・淡路大震災後の反省をうむ発端となった。しかし](https://thumb-ap.123doks.com/thumbv2/123deta/6927315.2265984/7.892.124.759.755.1107/Figure気象庁によっ気象庁カタログデータ囲い込むながりつくりしかし.webp)
![Figure 4 : Major active faults listed by the Headquarters for Earthquake Research Promotion Source : Reference [15]](https://thumb-ap.123doks.com/thumbv2/123deta/6927315.2265984/9.892.188.719.553.1131/figure-major-headquarters-earthquake-research-promotion-source-reference.webp)


