首都大学東京
A Study on Input-Output Model and Computable General Equilibrium (CGE) Model
for
Assessing Economic Impacts of Transportation Policies on Tourism Promotion
A case of Japan
PhD Dissertation
Nguyen Van Truong
A STUDY ON INPUT-OUTPUT MODEL AND COMPUTABLE GENERAL EQUILIBRIUM (CGE) MODEL
FOR
ASSESSING ECONOMIC IMPACTS OF TRANSPORTATION POLICIES ON TOURISM
PROMOTION
A CASE OF JAPAN
PhD Dissertation By
NGUYEN Van Truong From Hanoi, Viet Nam
Academic advisor: Prof., Dr. Tetsuo SHIMIZU Scientific committee:
Prof., Dr. Tetsuo SHIMIZU
Ass., Prof., Dr. Tomoki ISHIKURA Prof., Dr. Susumu KAWAHARA Ass., Prof., Dr. Yohei KURATA
Date of submission: July 26
th, 2017 Date of acceptance: September 8
th, 2017
Graduate School of Urban Environmental Sciences Department of Tourism Science
Tourism and Mobility Planning Laboratory
UNIVERSITY
FOR
ASSESSING ECONOMIC IMPACTS OF TRANSPORTATION POLICIES ON TOURISM PROMOTION
A CASE OF JAPAN
A dissertation submitted in fulfilment of the requirements for the Degree of PhD of the Department of Tourism Science, Graduate School of Urban Environmental Sciences, Tokyo Metropolitan University.
By
NGUYEN Van Truong From Hanoi, Viet Nam
Date of submission: July 26
th, 2017 Date of acceptance: September 8
th, 2017
Approval of academic advisor and scientific committee:
Academic advisor: Prof., Dr. Tetsuo SHIMIZU Scientific committee:
Prof., Dr. Tetsuo SHIMIZU
Ass., Prof., Dr. Tomoki ISHIKURA
Prof., Dr. Susumu KAWAHARA
Ass., Prof., Dr. Yohei KURATA
Tokyo 09 - 2017
Acknowledgments
I would like to express my acknowledgement to the faculty members, fellow students, friends and family. Without their kind supports I could not have completed my PhD research.
At first, I am profoundly grateful to my academic advisor, Prof. Dr. Shimizu Tetsuo, who provided me opportunity to be his PhD student in Tokyo Metropolitan University. Along with the study in his lab., he is the person who addressed my thinking on long-term strategic and comprehensive perspectives on the research. Improving my approach method to look at research problems from different practical and academic aspects with his inspired comments. Without his advices, I believe that my research was not as meaningful as it actually is. He is also the person who takes care of my academic career with providing me opportunities to participate the academic discussions, workshops, and conferences so that I can learn diverse knowledge and widen my academic network.
I am appreciated the deep and sharpen comments from Ass. Prof. Dr. Ishikura Tomoki, who is expert in the field. Based on his intellectual comments and advices, my work on CGE modeling is step by step improved and insightful. By discussing with him, I have opportunity to certify my own academic understanding and enrich my specialized knowledge in the field of study. I am acknowledged the comments and discussions of Prof. Dr. Kawahara Susumu, who has watched every step of my research in seminars from the time I enrolled into the University to the final defense. I thank for the kind supports, questions and comments to improve my dissertation from Ass. Prof. Dr. Kurata Yohei, Ass. Prof. Dr. Okamura Yu, and Dr. Katagiri Yukiko. I also would like to thank all other faculty members of Tourism Science for their participating and providing their valuable comments in the intermediate, preliminary, and final defense.
I would like to extend my sincere thanks to all my fellow students and friends: Okoshi
Yusuke, Ai Okada, Nozomi Nakagawa, Yoshifumi Takemoto, Ayako Miyata, Toshiyuki
Ogura, Ija, Nabila, Karn, Khanal, Nicho, and many others, who together have been
creating a wonderful working place, sharing joyful moments, and have helped me to
overcome the daily difficulties.
I acknowledge the kind supports of the Rector of the University of Communication and Transport, Ha Noi, Viet Nam and the Head of Transport Planning and Management Section. Thank for their promises my position as a lecturer in the University of Transport and Communication after I complete the PhD course in Tokyo Metropolitan University.
The last words, I would like to spare for my beloved wife, Nga, for her dedication, taking care my whole family, and sharing my ambition; for my lovely eight-year-old daughter, Bao Chau, and four-year-old son, Duc Minh, for their efforts to be confident in their learning and playing in such a strange environment without any language capability at the beginning time. My wife, daughter, and son, they all together have overcome the hard days for three years along with me. From the bottom of my heart, I am much appreciated my parents and parent-in-law. Apart from my academic works, their encouragement brings me more force to complete this research.
On the long way ahead of research career, the continuing supports and collaborations from all of you are highly appreciated!
Thank you very much!
Abstract
In early 21
stcentury, the world watches the dramatically contribution of tourism. In 2016, the total contribution of tourism to world GDP was $US 7,613.3bn, equaled to 10.2% and it is predicted to rise 3.9% annually to $US 11,512.9bn, equals to 11.4% of GDP in the next ten years (2027). As on the employment, in 2016, tourism contributed 9.6% of total world employment, equaled to 292.22 Mil jobs. It is expected to rise by 2.5% annually to 381.7 Mil jobs in the next ten years (2027), equals to 11.1% of total world employment (WTTC, 2017). In Japan, the valid observation illustrates the same trend of increasing contribution of tourism in term of GDP. In 2016, the total contribution of tourism to GDP was JPY37,326.9 bn ($US 343.2bn), equaled to 7.4% of GDP, and is forecasted to rise by 1.4% annually to JPY 43,837bn ($US 403.1bn), equals to 8.2% of GDP in 2027. In term of employment, the total contribution of tourism was 6.9%, equaled to 4.474 Mil jobs in 2016. In the next ten years, 2017, it is expected to rise by 1% annually to 4.854 Mil jobs, equals to 7.6% of total employment of the economy (J. WTTC, 2017).
Despite the significant role of tourism in the economy is attracted by many researchers, factors support the development of tourism so that tourism can contribute greatly to the economy are not comprehensively figured out (Van Truong and Shimizu, 2017).
Furthermore, although the roles of transportation on the tourism are acknowledged widely
in the literature, the empirical studies on the impacts of transportation on tourism in the
macroeconomic (intersectoral) view point are rarely found. The study conducted the
survey in the literature on the application of Computable General Equilibrium (CGE)
Model and states that up to date, there are two studies out of 69 studies found deal with
the relationship between transportation and tourism. The first one is for Hawaii by Konan
and Kim (2003). The study imposed some scenarios of changes in tourism expenditure
items and found the responses in transportation industries rather than finding the role of
transportation on tourism. The second study is for Tanzania by Kweka (2004). The study
said that the improvement of transportation infrastructure efficiency can benefit the
economy and tourism in two ways in general, first is the reduction of transportation cost
to the tourist destinations; second is the improvement of the accessibility to tourist
attractions may encourage the growth of tourism. The roles of different transportation
types, such as freight and passenger, as well as modes, for instance road, air, rail, and
water were not considered in these two studies.
To address this gap in empirical studies, the objective of this research is to employ conventional Input-Output model to identify the linkage between transportation and tourism industries, then to study on the economic impacts of transportation policies on tourism promotion by using CGE model. These analyses are based on the inter-sectoral database for transportation-tourism analysis such as transportation – tourism Input- Output table and Social Accounting Matrix (SAM) developed from original 518 Rows by 397 Columns Input-Output table of Japan’s economy in cooperation with the information from tourism consumption trend survey.
The study steps forward to figure out the differences in economic roles of different transportation types (freight, passenger) and modes (air, road, rail, water) on the tourism industry, which have not been acknowledged before. The reduction of freight transportation cost may reduce the price of tourism commodities and services. On the other side, the reduction of passenger transportation cost encourages the tourist arrivals.
The tourism expenditure for services and commodities will be then stimulated by both freight and passenger transportation. This multiple effect of freight and passenger transportation is clearly discussed in this research with inbound tourism sector. This spread effect of passenger transportation cost to the tourism services and commodities is also considered as a contribution of the research to the literature.
The results of research for Japan as a case study indicate that the responses of each types
of tourism, for example, domestic, outbound and inbound tourism to each type of
transportation modes (air, road, water, rail) are different. The inbound and outbound
tourism are very sensitive to the air transportation policies. For instance, the reduction of
20% of air transportation cost can stimulate 15.57% demand and 15.59% gross output of
inbound tourism while those of road, water and rail transportation only stimulate less than
0.5% demand and gross output. In the same manner with inbound tourism, outbound
tourism rises 6.32% demand and 3.14% gross output along with the reduction of 20% of
air transportation cost, while the reduction of 20% cost of road, water, and rail
transportation encourage only less than 0.5% of its demand and gross output. In contrast
to inbound and outbound tourism, road and railway are more powerful than air
transportation to domestic tourism. The reduction of cost of railway transportation can
rise 1.74% demand and 2.56% gross output of domestic tourism; the same amount of reduction in road transportation cost can increase 1.12% demand and 1.07% gross output of domestic tourism. Although Japan is covered with ocean at four sides, the water transportation is minority for tourism. Its cost reduction of 20% can stimulate only 0.22%
demand and 0.21% gross output of domestic tourism; these figures for outbound tourism are 0.05% and 0.07%; and for inbound tourism are 0.12% and 0.02% demand and gross output.
The research concludes that transportation is pivotal for tourism. Although this statement is acknowledged in many theoretical studies, this study concludes with the numeric evident from IO model that transportation is the first of top ten consumers and the fifth or sixth of top ten suppliers. The use of CGE model clarifies the shocks in transportation sectors greatly impact on tourism. At the end, some critical research areas will be proposed for future, such as consideration of different behavior of tourist (recreational, business) along with the changes in transportation policies; and since tourism is special industry that its activities are stick with transportation, so the integrating transportation models into CGE models is critical to understand more precisely the impacts of transportation on tourism.
The dissertation is organized by six main chapters, together along with the introduction
and the conclusion parts. The first chapter theoretically introduces the role of
transportation on tourism development. The second chapter will conduct the survey in
literature to clarify to what extend the CGE model is applied. Chapter 3 aims at
developing the database (IO table and SAM) for the study. Chapter 4 employs IO model
to prove that transportation and tourism are strongly linked. Chapter 5 proposes a
theoretical framework to integrate transportation model into CGE model at regional and
inter-regional level. Chapter 6 uses CGE model with the injection of transportation cost
changes (as cases of transportation policy shocks) to examine the economic impacts of
different transportation modes on different tourism types. The conclusions and further
research recommendations is expressed in the last part of the dissertation.
Table of content
Acknowledgments ... i
Abstract ... iii
Table of content ... vi
List of figures ... ix
List of tables ... xi
Abbreviations ... xiii
Introduction ... 1
Research motivations and significances ... 1
Research questions ... 3
Research objectives ... 3
Research methodology and structure ... 4
1 The role of transportation on tourism development ... 7
1.1 The roles of Transportation on the Economic development ... 7
1.2 Transportation and tourism promotion ... 13
1.3 Quantitative methods to analyze the economic impacts of transportation on tourism ... 20
1.4 Conclusions ... 24
2 Applications of CGE Model in Transportation – Tourism analysis: Literature review ... 26
2.1 Literature review method ... 26
2.2 The applications of CGE Model in economic impacts of tourism studies ... 27
2.3 The applications of CGE Model in economic impacts of transportation studies 30 2.4 The applications of CGE Model in transportation – tourism studies ... 33
2.5 Conclusions ... 36
3 Database development for Transportation-Tourism inter-industrial analysis: Case of Japan ... 38
3.1 Data collection ... 38
3.2 Original Input-Output table of Japan ... 39
3.3 Tourism consumption trend survey data ... 40
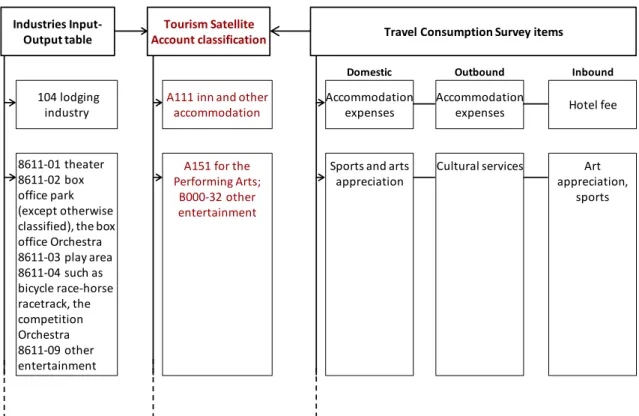
3.4 Tourism satellite account – a link to connect tourism consumption trend survey into input-output table ... 42
3.5 Develop input-output table for transportation – tourism analysis ... 43
3.6 Interactions between industries in Input-Output table ... 51
3.7 The errors of the IO table construction method ... 52
3.8 Social Accounting Matrix (SAM) – Database for CGE Modelling ... 52
3.9 Conclusions ... 55
4 Interdependencies between Transportation and Tourism ... 57
4.1 Importance of an industry in the economy: fundamental concept ... 57
4.2 Importance of tourism industry with multiplier indicator ... 62
4.3 Importance of tourism industry with HEM ... 65
4.4 Interdependencies between industries: the fundamental concept ... 67
4.5 Interdependencies between transportation and tourism with multiplier ... 69
4.6 Interdependencies between transportation and tourism with HEM ... 71
4.7 Interdependencies between transportation and tourism with Input-Output coefficients ... 74
4.8 Conclusions ... 77
5 Framework to integrate Transportation model into CGE Model to analyze economic impacts of Transportation on Tourism ... 79
5.1 From the previous generation of inter-sectoral analysis: Input - Output (IO) Model 79 5.2 To the next generation: CGE Model ... 84
5.3 CGE Model structure ... 89
5.4 The possibility of integrating transportation models into CGE models ... 102
5.5 Framework to integrate Transportation Model into CGE Model ... 104
5.6 Potential applications of integrating transportation accessibility factors in CGE models 107 5.7 Capability of CGE model in evaluating impacts of transportation policies . 110 5.8 Challenges to integrate Transportation Model into CGE Model ... 111
5.9 Conclusions ... 112
6 Transportation policy based to promote tourism ... 114
6.1 Tourism situation in Japan ... 114
6.2 Transportation situation ... 121
6.3 Scenario design for analysis ... 124
6.4 Analytical framework and treatment of transportation cost changes in CGE model 130 6.5 Domestic tourism demand and multiple impact of transportation cost on inbound tourism ... 133
6.6 Model closure and procedure ... 135
6.7 Model calibration and validation ... 139
6.8 Impacts of transportation cost deregulation on nationwide economy ... 144
6.9 Impacts of transportation policies on tourism ... 148
6.10 Sensitivity analysis ... 153
6.11 Conclusions ... 159
Conclusions and recommendations ... 162
Research conclusions ... 162
Research contributions ... 166
Research difficulties and limitations ... 168
Future research directions ... 169
References ... 170
Appendices ... 178
Appendix 1. CGE empirical studies on relationship among economic, tourism and transport ... 178
Appendix 2. IO table sector and Tourism Satellite Account classification... 181
Appendix 3. Travel consumption items and Tourism Satellite Account classification ... 185
Appendix 4a. Domestic tourism consumption amount specified by spending items 191 Appendix 4b. Outbound tourism consumption amount specified by spending items ... 193
Appendix 4c. Inbound tourism consumption amount specified by spending items .. 195
Appendix 5. Input-Output table for transportation-tourism analysis Japan 2011 (Producer’s Price) ... 197
Appendix 6. Social Accounting Matrix (SAM) for Transportation – Tourism analysis, case of Japan 2011 ... 230
Appendix 7. List of industries classified in Input-Output table and SAM for Transportation – Tourism analysis, Japan 2011 ... 263
Appendix 8. Industrial ranking in economy by HEM total linkage indicator ... 267
Appendix 9. Industrial ranking in economic by multiplier indicator ... 269
Appendix 10. Constant Elasticity of Substitution (from GTAP) ... 271
Appendix 11a. Results of Impacts on GDP of cross-industry ... 274
Appendix 11b. Results of Impacts on Demand (domestic final demand and export) of cross-industry ... 279
Appendix 11c. Results of Impacts on gross output (production) of cross-industry .. 284
Appendix 12a. Sensitive test of Constant Elasticity of Transformation
CETwith 20% cost reduction of all transportation modes: Gross output (production) of cross-industry ... 288
Appendix 12b. Sensitive test of Constant Elasticity of Substitution between Domestic/Import good
Dwith 20% cost reduction of all transportation modes: Gross output (production) of cross-industry ... 293
Appendix 12c. Sensitive test of Constant Elasticity of Substitution of production factors (L,K)
VAwith 20% cost reduction of all transportation modes: Gross output (production) of cross-industry ... 298
Appendix 12d. Sensitive test of price elasticity of demand of tourism export
Pwith
20% cost reduction of all transportation modes: Gross output (production) of cross-
industry ... 304
List of figures
Figure 0-1-1. Research structure and methodology ... 4
Figure 1-1. Mechanism of impacts of transportation policies on economy ... 8
Figure 1-2. Impacts of transportation policies on economic development ... 9
Figure 1-3. Three fundamental elements of tourism ... 14
Figure 1-4. Accessibility factors and its effects on tourism ... 15
Figure 1-5. Relationship between transportation policy and travel cost ... 17
Figure 2-1. Empirical studies using CGE model in literature and some important milestones ... 28
Figure 2-2. (a) The number of empirical papers using computable general equilibrium (CGE) models to analyze the relationships among tourism, transportation, and the economy; and (b) The number of empirical papers using CGE models to analyze the transportation-tourism relationship. ... 34
Figure 3-1. Identify the tourism industries in IO table with TSA as a linkage-An example ... 43
Figure 4-1. Illustration of multiplier effects ... 58
Figure 4-2. Output multiplier of domestic, outbound, and inbound tourism as well as other industries on economy – case of Japan ... 62
Figure 4-3. Multiplier effect of domestic, outbound, and inbound on earning ... 63
Figure 4-4. Direct and total effects of tourism industries on Japanese economy ... 64
Figure 4-5. Chains of tourism and transport with the most important industries in the Japan economy ... 76
Figure 5-1. Industries/sectors in economy ... 81
Figure 5-2. Comparison between Input-Output model and Computable General Equilibrium Model ... 84
Figure 5-3. The interactions between economy elements ... 88
Figure 5-4. The structure of the economy in CGE modelling ... 90
Figure 5-5. 2-stage of minimize the cost of domestic final demand ... 92
Figure 5-6. Effect of income level on consumer demand and maximize the utility ... 93
Figure 5-7. Analytical framework for transportation policy analysis for regional model
... 106
Figure 5-8. Integrating transportation models into interregional Computable General
Equilibrium Model ... 107
Figure 5-9. Capabilities of CGE model in observing the impacts of transportation policies ... 110
Figure 6-1. Total contribution of tourism to world economy in term of value ... 114
Figure 6-2. Total contribution of tourism to the world economy in term of share ... 115
Figure 6-3. Ranking international tourism expenditure by country/region (US$100 mil.) ... 116
Figure 6-4. Trend of inbound tourist to Japan ... 117
Figure 6-5. Consumption trend of inbound tourism ... 118
Figure 6-6. Fluctuation of domestic travelers in Japan ... 119
Figure 6-7. Domestic travelers’ expenditure, same-day trips and overnight trips ... 119
Figure 6-8. Overnight trips per person and nights per person of domestic tourism ... 120
Figure 6-9. Trend of oversea travel from Japan ... 120
Figure 6-10. Trend of foreign visitors and Japanese oversea ... 121
Figure 6-11. Freight transportation situation in Japan ... 122
Figure 6-12. Domestic passenger transportation trend in Japan ... 123
Figure 6-13. Selection of scenario for policy analysis ... 127
Figure 6-14. Scenario design for transportation policy analysis ... 128
Figure 6-15. Analytical framework for transportation policy analysis ... 131
Figure 6-16. CGE Modelling procedure ... 137
Figure 6-17. CGE model calibration procedure ... 140
Figure 6-18. Impacts of transport cost reduction on domestic tourism ... 149
Figure 6-19. Impacts of transportation cost reduction on outbound tourism ... 150
Figure 6-20. Impacts of transportation cost reduction on inbound tourism ... 152
List of tables
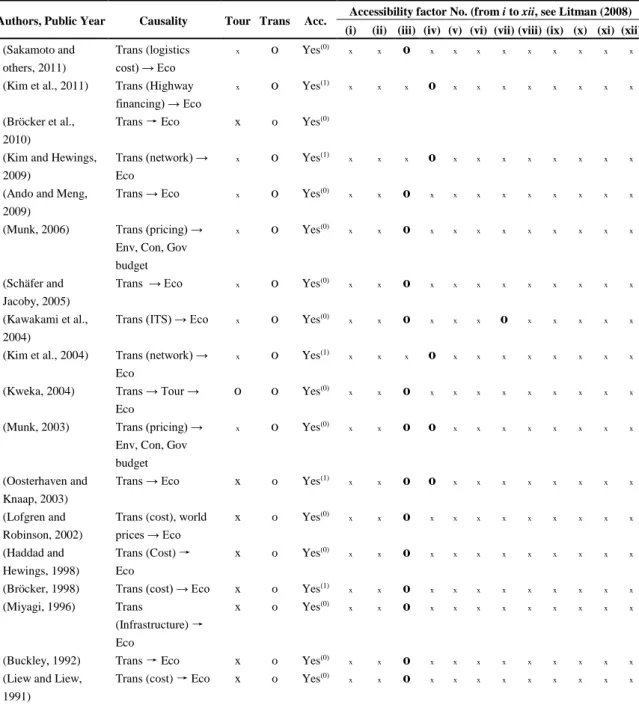
Table 2-1. The consideration of transport accessibility factors in CGE models (only
papers consider accessibility factors are presented) ... 32
Table 2-2. Conclusions, strengths, and further recommendations for future research ... 35
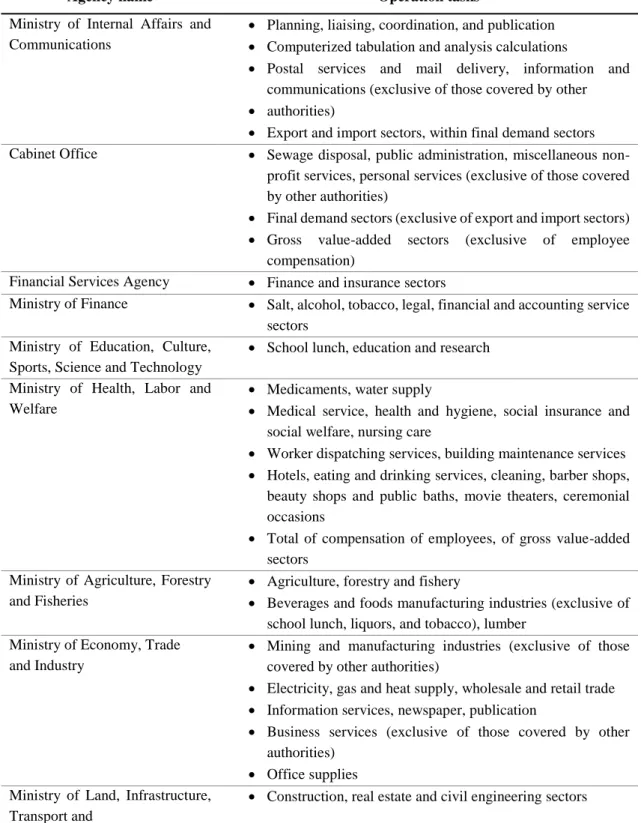
Table 3-1. Agencies involved and task in develop original Input-Output table ... 39
Table 3-2. Format of original 518x397 Input-Output table of Japan, year 2011 ... 40
Table 3-3. Tourism expenditure classified by items and categories ... 41
Table 3-4. The square form of Japan IO table 2011 ... 44
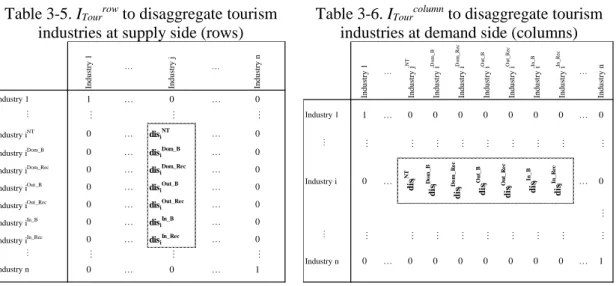
Table 3-5. I
Tourrowto disaggregate tourism industries at supply side (rows) ... 46
Table 3-6. I
Tourcolumnto disaggregate tourism industries at demand side (columns) ... 46
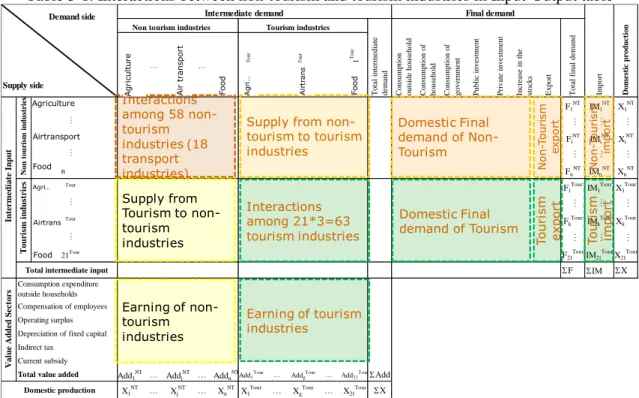
Table 3-7. IO table with transportation services and tourism industries presented ... 49
Table 3-8. Interactions between non-tourism and tourism industries in Input-Output table ... 51
Table 3-9. The format of Social Accounting Matrix ... 53
Table 4-1. Cross-industrial ranking with HEM indicator ... 66
Table 4-2. The total output and value-added effect on tourism of transportation (per 100JPY transportation final demand) ... 70
Table 4-3. The total output and value-added effect on transportation of tourism (per 100JPY tourism final demand) ... 71
Table 4-4. Impacts of transportation on tourism (per 100JPY) ... 73
Table 4-5. Impacts of Tourism on Transportation (per 100JPY) ... 74
Table 4-6. Ten dominant industries of domestic and inbound tourism ... 75
Table 4-7. Ten dominant industries of outbound tourism ... 75
Table 6-1. Freight transportation situation in Japan ... 122
Table 6-2. Domestic passenger transportation trend in Japan ... 124
Table 6-3. Transportation modal share for freight and tourism passenger ... 129
Table 6-4. Impacts of transportation cost changes on national economy ... 145
Table 6-5. Changes in gross output and final demand under the transportation cost changes ... 146
Table 6-6. Impacts on demand and gross output of transportation service industries under
the shocks ... 147
Table 6-7. Impacts of transport cost reduction on domestic tourism ... 149
Table 6-8. Impacts of transportation cost reduction on outbound tourism ... 151
Table 6-9. Impacts of transportation cost reduction on inbound tourism ... 152
Table 6-10. Sensitivity test scenario design ... 154
Table 6-11. Sensitive test of Constant Elasticity of Transformation
CETwith 20% cost reduction of all transportation modes ... 155
Table 6-12. Sensitive test of CES Domestic/Import good
Dwith 20% cost reduction of all transportation modes ... 156
Table 6-13. Sensitive test of factor elasticity of substitution
VAwith 20% cost reduction of all transportation modes ... 157
Table 6-14. Sensitive test of price elasticity of demand of tourism export
Pwith 20% cost reduction of all transportation modes ... 158
Table 6-15. Research contributions and future considerations ... 167
Abbreviations
IO Input-Output
SAM Social Accounting Matrix
CGE Computable General Equilibrium
SCGE Spatial Computable General Equilibrium
CES Constant Elasticity of Substitution CET Constant Elasticity of Transformation
C-D Cobb – Douglas
GTAP Global Trade Analysis Project
RoW Rest of the World
GDP Gross Domestic Product
WTTC World Travel and Tourism Council
HEM Hypothetical Extraction Method
REMI Regional Economic Models, Inc.
GIS Geographic Information System
AI Artificial Intelligent model
NN Neural Network
ANN Artificial Neural Network
AIDS Almost Ideal Demand System
SEM Structure Equation Modeling
CBA Cost-Benefit Analysis
MMRF Monash Multi-Regional Forecasting
FMD Foot-and-Mouth Disease
ITS Intelligent Transportation Systems
MIC Ministry of Internal Affairs and Communications, Japan MLIT Ministry of Land, Infrastructure, Transport and Tourism,
Japan
SNA System of National Account
TSA Tourism Satellite Account
FOB Free on Board
CIF Cost, Insurance and Freight
Introduction
Research motivations and significances
From the arguements of the transportation roles on tourism development
Tourism has become an important industry over the last few decades, and its economic impact, including direct, indirect, and induced effects, has been enormous. Based on a 2014 data set comprised of information from more than 180 countries, travel and tourism contributed $7,580.9 billion, which is equivalent to 9.8% of the global Gross Domestic Product (GDP), and provided 276,845,000 jobs, which is equivalent to 9.4% of total global employment. Tourism’s economic contribution is predicted to increase to an estimated $11,381.9 billion in the coming years (10.5% of GDP), and activities from tourism are projected to add 356,911,000 jobs by 2025 (10.7% of total global employment) (WTTC, 2015).
Transportation is one of the most important factors that contributes to the success of the tourism industry (Page 2009, Palhares 2003). According to Lamb and Davidson (1996), transportation is crucial in the tourism industry, as it connects supply (production) and demand (market) directly. The role of transportation in tourism is essentially to provide accessibility. It has been widely claimed by many scholars that without accessibility, tourism simply cannot take place (Chew 1987, Prideaux 2000). Accessibility is not only defined as providing ability to tourists to reach destinations, but also using transportation services at destinations once they arrive. These accessibility factors influence tourists’
impressions during their trip, and serve as determining factors of the destinations’ overall attractiveness (Le-Klähn and Hall 2015, Page and Connell 2014, Boopen 2005, Naudé and Saayman 2005, Gunn and Var 2002, Chew 1987, Robinson 1976).
There are policies to effect to the transportation accessibility of a tourism destination, which are grouped into three categories:
• The first category is policies of infrastructure development. These incudes activities
of re-structuring the network; construction of new links or facilities, such as new
links of roads, railway, or new airport…; improvement of existing ones; or
improving the connectivity of a part or entire network by investing/improve infrastructure…etc.
• The second category is service policies. It may contain the strategies of improvement of travel speed/time for passenger transportation, such as reducing the waiting time, increase frequency; improvement of public transport connectivity, i.e.
reducing the transfer time; public transport subsidy, or discount for student…;
applying road pricing; taxes of fuel; or introduction of new transportation modes which provide faster traveling, more comfortable, more convenient…
• The final one is regulation policies, for example, the regulation of the emission standard, or restriction of driving may also effect to the accessibility of tourism destination.
The transportation policy may be introduced in individual or in combination of several policies. In one or another way, the introduction of transportation policies may reduce or increase the travel cost, which is expressed in two terms: direct money which the travelers pay for transportation service to bring them from origins to tourism destination and within the tourism destination; and the time they spend for traveling, which can be converted into money term in specific circumstances.
Budget to develop transportation system is always constrained. Many economies are trying to find the answers for the problem of which transportation sector are prioritized to be invested? Even within a transport sector, which projects are prioritized to have the best responses from tourism is a hot topic for discussion.
To the practical facts
Although the transportation is important to the tourism, the applications of inter-industry analyses, such as Input-Output and CGE model to enhance this statment are rarely acknowledged (Van Truong and Shimizu, 2017). Some critical points are drawn out:
• It is rare to recognize an empirical study pointing out the linkage between transportation and tourism with the scientifec figures.
• There is only one empirical study on the interaction between transportation and
tourism using Computable General Equilibrium Model. However, the consideration
of transportation policies is not clear enough.
• The critical fact that transportation policies (or alternatives) aim to promote tourism need to be appraised, and compared to find out the most effective one. This gurantees to get the best responds from tourism with the most saving alternatives.
Research questions
The fact of lacking the empirical studies on the economic impacts of transportation on tourism by employing CGE model raises some critical questions for the author to find answers for the research questions, namely:
1. How important is transportation on the promotion of tourism?
2. With respect to transportation policy(s), how to assess the economic impacts of transportation on tourism?
3. What models can quantify the impacts?
4. How to develop the database for the analysis?
5. How decision makers/practitioners take advantage of the method for their institutional activities?
Research objectives
Overall goal of the research is to propose a model with integrating transport accessibility factors into CGE models to estimate the economic impacts of transportation on tourism.
This model provides a general method to take transportation policies into account in CGE framework. Transportation model will convert policy shocks into cost in term of time or/and monetary. These results are injected into CGE framework to solve for the changes in income, demand/supply, investment/saving as well as import demand and export…etc.
of the economy.
To obtain the overall goal of the research, the following detailed objectives need to be archived:
1. Understanding on the mechanism of the relation between transportation and tourism.
2. The survey in literature on the empirical studies to figure out the application of CGE framework in the transportation – tourism area. This objective will provide a comprehensive look on which area of study should be more critical;
3. Development of the database for transportation – tourism analysis relying on
the CGE model
4. Introduce a theoretical framework to integrate transportation into CGE model to evaluate the impacts of transportation on tourism;
5. Employ the framework to analyze the economic impacts of transportation policies on the development of tourism as a case study.
Research methodology and structure
The research is structured into six major parts corresponding to six chapters, excluding introduction and conclusion (see Figure 0-1-1). The introduction part briefly presents the research motivations-significances, research questions, research objectives, major methods applied, and the structure of entire study.
Figure 0-1-1. Research structure and methodology
In the first chapter, the theoretical arguments on the roles of transportation on the economic development and tourism are discussed. Some arguments are presented with practical evidence. This chapter also mentions the quantitative methods widely used to assess the economic impacts of transportation in general and the economic impacts of transportation on tourism in particular.
Chapter 2 focuses on the literature review of the applications of Computable General Equilibrium (CGE) Models to assess the economic impacts of transportation on tourism.
Conclusion
Motivation; method; objectives; structure
The role of transportation on tourism
Clarify the high potential points for research to contribute to literature
Development Input-Output table for transport-tourism analysis
Examine the relationship between transport and tourism industries
Indices: MM, Input-output coefficients,…
Method to integrate transport into CGE
Responses of tourism with respect to transportation policy scenario
Academic contributions; Future considerations C1 - Role of Trans
on Tourism
Introduction on the research
C2 - Literature review
C3 –Database development C4 –Trans-Tour linkage
C5 –Integration of trans model into CGE
C6 –Trans policy scenario analysis IO model
CGE model
Method Report structure Main contents/ major indices
Japan IO table 2011 Tourism consumption survey
Investigation based on Google scholar/ Scopus/
Web of Science Theory expression
The survey also extends to the studies on the economic impacts of transportation to economy and the economic impacts of tourism. These extensions aim to understand how transportation and tourism industries are treated in CGE frameworks. The understanding of these knowledges will lay the foundation for the developing framework of integration transportation models into CGE models.
The content of Chapter 3 is about the development the database for the Input-Output and CGE modelling. The development is based on the original Input-Output table of Japan and Tourism Consumption Trend Survey, both of original data is in 2011 calendar year.
The methodology of the database development and the results as Input-Output table and SAM for transportation and tourism analysis are presented explicitly in this chapter.
Relying on the results of Chapter 3, Chapter 4 examines the contributions of tourism industries to the Japanese economy. The linkages between transportation and tourism industries are also identified. The main method applied in this part is Input-Output model.
Some specific analysis methods are used, such as Input-Output coefficients, Multiplier analysis, Hypothetical Extraction Method (HEM), and Forward-Backward Method. The aim of this part is to answer for the question “is tourism important to the economy?” and
“how strong is the linkage between transportation and tourism?”
Before examining the economic impacts of some transportation policy shocks, Chapter 5 introduces the standard structure of CGE model for a small-open economy. Frameworks to integrating transportation model into regional and inter-regional CGE are presented.
Some relevant maters, such as potential applications of the integration framework, and the challenges of integrating transportation model into CGE are also discussed.
Take advantage of the integration framework in Chapter 5, Chapter 6 moves one more step to examine the economic impacts of five scenarios of transportation policy shocks.
The experiment illustrates the applications of the integration at basic level, in which
transportation cost deregulation scenarios are injected directly into the price, demand, and
production models of CGE. In this chapter, the economic roles of four basic transportation
modes on the national economy and the various types of tourism, for instance, domestic,
outbound, and inbound tourism are recognized. The multiple impacts of passenger
transportation cost deregulation on the demand/production of tourism
commodities/services in inbound tourism is also explained in detail. The calibration and validation procedure is included to qualified the model results. The sensitive analysis is also used to check the responses of the model results to the different values of elasticity of substitution.
The conclusions – recommendations are presented as the final part of the research. Here,
key conclusions of the research, the contributions of the research, research difficulties-
limitations are introduced. After all, some critical research topics to address the research
area are strongly recommended.
1 The role of transportation on tourism development
1.1 The roles of Transportation on the Economic development
1.1.1 Transportation policies and its roles to economy
The roles of transportation on the development of economy are widely acknowledged in literature. The impacts of transportation may be on the supply side, or on the demand side, or sometimes both supply and demand. Berg et al., (2017) surveyed the current state of the economic literature on the impact of transportation policies on the economic development and categories transportation policies into three groups: Transportation investment; Price incentives; and Regulations. Transportation investment policies include two sub-groups, the first one is infrastructure investment, for example, investment of new transportation infrastructure (new roads, new rail links, new airports, harbors…), restructuring transportation network, improvement of the existing ones, improvement of the intermodal network connectivity, or investment/improvement of the transportation technologies…; the second one is transportation service investment, which contains the introduction of new transportation modes, improve the frequency of public transportation,…Price incentives include the policies to change the prices or fares of transportation, such as subsidies, taxes to change the road users’ behavior, discounts for students or disabilities, toll installations, fares of parking, fuel taxes … Regulations contain the norm to reduce the transportation emission, like fuel emission standards, driving prohibition; or transportation management…
Berg et al., (2017) explains the mechanism of the impacts of transportation policies on the economy as in the Figure 1-1. The transportation policies can be recognized by the changes in physical infrastructure, such as the appearance of the new infrastructure, the better quality (road surface is smoother, higher speed operation…); or the better transportation services; the appearance or the improvement of transportation technology...
The changes may lead to the reduction of transportation cost, travel time; or increase in
accessibility and connectivity; the changes also appear in the environment externalities,
for example, improve health of communities. Depending on the behaviors of bodies
(government, households, firms) in economy, the impacts of transportation policies can
reach to some extent. The outcomes of the transportation policies’ impacts on the
economy can be seen in three types: Stimulation the economic growth, Inclusion, and Sustainability.
Source: (Berg et al., 2017)
Figure 1-1. Mechanism of impacts of transportation policies on economy
1.1.2 Transportation policies and accessibility
There are various ways to measure transportation policies. The first dimension is the changes in physical units which one can observe by their own eyes are popular. For example, the number of kilometers that new roads, railways, airports are constructed, or those of improvement ones. The changes or improvement in efficiency of transportation are also usually used. For instance, the increases in capacity of upgraded infrastructure, the better quality of road surface, the higher operation speed allowed. Another dimension indicates for the users’ satisfactions is also used widely, this dimension usually representative for the transportation services, such as the comfortability, loyalty, security…In many cases, in economic view point, one can also use the scale of budget invested, in monetary term for transportation policy. Depending on to which circumstance transportation policy is referred, the suitable measurement is recommended. Nevertheless, all of measurements mentioned here seem not sufficient.
Rietveld and Bruinsma (1998b) recommend an indicator that brings more precise, more comprehensive view to the transportation policy, called “accessibility”. The accessibility is usually estimated based on specific trip purpose, type of user, and destination. There are some but not limited to alternative operations of accessibility:
• Is there any link exists between a location and the network?
Transportation Infrastructure Transportation
Service Price incentives
Regulations Transportation
policies
Physical infrastructure
(new, improvement,
operation, maintenance) Transportation
services Technology Interventions
Transportation cost
Travel time (cost)
Accessibility/
connectivity
Environmental externalities
Outputs
Trade Location Transportation
use Responses
Growth
Production and Productivity
Inclusion
Opportunity Sustainability
Environment and equality of
life Outcomes
• The nearest distance one travels from a location to others.
• The number of connections from a location to others.
• The number of links connected to a location.
• Travel cost measured between locations, in a specific link.
• Travel time from a location to another.
• The total number of people who can reach to a location within a certain transportation cost limit…
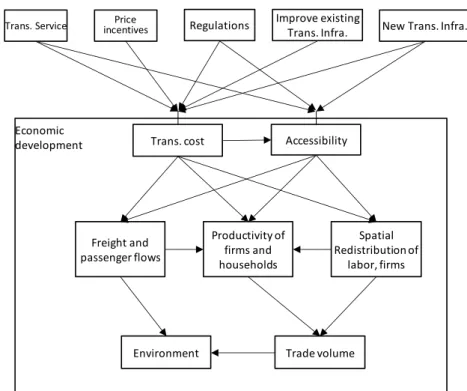
Figure 1-2. Impacts of transportation policies on economic development
The concept of accessibility is wide and can be varied by circumstance, depending on the purpose of a study. It is widely used in economic impacts assessment since it brings more potential use of infrastructure and service development. It is noted that the concept of transportation cost and accessibility are not always the same. For example, an isolated location without transportation connected is considered as non-accessible by road. In this case, the cost of transportation does not exist. If a road link is added to connect the location with the existing transportation network, then ones can reach to there. The location becomes accessible. Since then transportation cost concept appears after the introduction of a new road link. Figure 1-2 presents the flows of impacts of transportation policies to the development of economy, in which transportation cost and accessibility concepts are distinguished separately.
New Trans. Infra.
Trans. Service Price
incentives Regulations
Trans. cost
Freight and passenger flows
Productivity of firms and households
Spatial Redistribution of
labor, firms Accessibility
Trade volume Environment
Economic development
Improve existing Trans. Infra.
1.1.3 Transportation infrastructure
The improvement of existing infrastructure or investment of new one will generally improve accessibility to a location (Rietveld and Bruinsma, 1998a). It is quite easy to realize the changes in the criteria of accessibility described in the section above. If a link to a location is improved, the travel speed to the location may be improved. In other words, the travel time and/or travel cost will be saved. In another case, if a link is added to connect to a location, this link can increase opportunity to access to the location and may change the distribution of travel demand on the network under the change of network equilibrium. The impacts of new link would lead to the change in the average travel time/speed entire network.
The investment of transportation infrastructure can shorten the travel distances, or encourage higher speed. There are variety of elements induced, such as the reductions of fuel, cost of labor and capital leading to changes in generalized transportation cost. The results of changes in the form of mode choice, changes in decisions of time of day to avoid congestion… Therefore the trip generation and attraction may be changed (Rietveld and Bruinsma, 1998b). To the firms, the reduction generalized transportation cost is the driving force for the productivity increased. In turn, income of households (value added) and government (taxes), or the GDP of the related regions or nation will be encouraged.
The changes in transportation cost also change in accessibility of locations. The un- uniform of transportation effects to locations may lead to re-distribute the economic impacts spatially. Accessibility is a good indicator to stand for these differences.
Transportation infrastructure effects on regional/national employment. Naturally, transportation infrastructure investment requires labor in association with capital, import goods, as well as other relevant inputs. The interactions among others take place via substitution and the complementary relationships between them. In some circumstances, one input can be substituted by some others. The impacts on the employment also differ by regions due to the differences in growth rates of economy resulted from the different advantages they got from the impacts of transportation infrastructure.
The impacts of infrastructure investment on the trade flow may be manifested of its
impacts on generalized transportation cost, labor/employment, capital and spatial
economic. Cost, demand and income of households, and production of firms are closed related to each other’s. The reduction of cost will stimulate the demand for inputs of firms and consumption of households. The production of firms will be positively impacted. The increase of value added is the outcomes of the stimulation of productivity. Moreover, the infrastructure even can open up new markets for the economy.
The transportation infrastructure investment has some impacts on environment. For example, the construction a new road may produce some tons of air emission, dust, and noise. The new investment of road may also encourage more vehicles, then induces more emission. The construction also effects on the natural areas such as forest destroy, natural living environment of animals…
1.1.4 Transportation services
Differ to transportation infrastructure, transportation service is laid upon on the infrastructure. Without infrastructure, transportation service cannot function. Again, the roles of transportation infrastructure are emphasized for the services. However, the roles of transportation infrastructure will not be mentioned again this section. The section will discuss the roles of transportation service as its own special characteristics.
The transportation service effects can be distinguished by two elements: the direct impact, such as the reduction of travel time/cost and the indirect impacts. The direct impact may be resulted from these components:
• The increase of travel speed or reduction of travel time (resulted with new transportation modes, higher operating speed allowed by the improvement of infrastructure),
• The increase of frequency (bus, train, or other types of public transportation),
• Reduction of cost or fare.
The indirect impacts consists the elements related to the quality of the transportation services (Rietveld and Bruinsma, 1998c), such as:
• Capacity of working in traveling: The opportunities to work while being in the vehicle,
• Access time saving: the time spend for checking in procedure, boarding time,
• Opportunities for same day-return trips (reduction of expense for overnight),
• Delay time or reliability (difference between schedule and actual time of operation).
1.1.5 Some practical evidences illustrated for economic impacts of transportation
Impacts on growth
The reduction of transportation cost may increase the trade volume, open new markets, stimulate the formation of new industries, and as results, it may change the patterns of trade. The pattern of trade may differ depending on the specific circumstances of transportation infrastructure. The higher trade cost usually indicates the poorer in transportation infrastructure or less accessibility. Atkin and Donaldson (2015) exclusively worked with a sample of goods that are identified at the barcode-level and collected data on the origin location of each product, and estimate the cost of trade. They found that the cost of trade in Ethiopia or Nigeria is four to five times larger than in the US. The study also concluded that the distant consumers even bear more trade cost.
Weisbrod and Treyz (1998) used REMI regional economic model for country sides in Michigan to assess the travel cost effects, logistics cost effects, and
“accessibility/agglomeration” effects. The improvement of accessibility can serve to expand the market, allow businesses opportunities to realize the economic scale by serving markets more economically. The improvement of accessibility by highway project can provide businesses with access to a greater variety of specialized labor skills and input products. These improvements then stimulate the productivity.
The transportation policy changes economic activity and income. Damania et al. (2017) combined road survey data and GIS road networks with the Highway Development Management Model to compute the impacts of transportation cost on crop production of farmers in Nigeria. The study found that the decline of transportation cost may not be enough to push the local economy toward, but significantly increases the revenue as well as welfare of the farmers. In the study of Jacoby and Minten (2009) on the willingness- to-pay for a reduction of transportation cost from the canonical agricultural household model and utilizes it to analyze the benefits of a road project in a region of Madagascar.
The study shows that the elimination of transportation cost in area would boost the
incomes of the remotest households, which facing with the transportation cost of
approximately $75/ton by almost half.
Impacts on Inclusion
The impact of transportation on the inclusion is understood as the various dimensions of poverty that can be affected by a poor transportation. For example, the poor transportation can lead the reduction of trade, negative impacts on labor market outcomes, to some extent on bad education and health, and even crime (Berg et al., 2017). In a research of Emran and Hou (2013) about the relationship between the accessibility to the markets and the poverty of rural areas in China, the research uses straight-line distances to coastline and navigable river, along with the topography of the intervening countries. The results from the research show that better access to both domestic and international market has positive effects on per capita consumption. Fafchamps and Shilpi (2013) researches on the migrants’ choice of migration in the developing country as Nepal. For the poor immigrants, travel time to the important facilities, such as banks, road is one of the important indicators for the choice of destinations. There are also correlations between their decisions of destination with the higher income and consumption, higher housing premium, and better access to public amenities.
Impacts on sustainability
Although transportation development has great positive impacts on the economy, the development of transportation gets involved with the negative externalities, for instance, traffic congestion, accidents, pollution and health, deforestation, loss of biodiversity, degradation of ecosystems induced by transportation infrastructure (Berg et al., 2017).
The evidences from Chicago and Philadelphia about the impacts of traffic congestion on the business cost, productivity and output levels of the metropolitan areas. Even the impacts of traffic congestion are various by industry and by the characteristics of the required inputs. The impacts of raising the production cost may be reduced with traffic congestion reduction strategies (Weisbrod et al., 2003). The bad impacts of transportation on pollution and health are widely recognized. For example, Künzli et al. (2000) estimate the air pollution on public health in Austria, France, and Switzerland caused by transportation. In their work, they found that air pollution is the reason for 6% (40,000 cases) of total mortality per year, and half of all mortality caused by air pollution was attributed to motorized traffic.
1.2 Transportation and tourism promotion
1.2.1 The roles of transportation on tourism
Together with tourism demand and supply (destination) sides, transportation is one of fundamental elements of tourism (Lamb and Davidson, 1996). Transportation not only brings tourists from demand sides (origins) to the supply sides (destinations) but also contributes to destinations as facilitators. Furthermore, the specialty of transportation is that it is not only a tourism facility but also a link to connect all other tourism relevant facilities, such as hotels/accommodations, restaurants, recreational places, museums…regarding to the mobility function, transportation’s role is usually seen under the term of accessibility.
Figure 1-3. Three fundamental elements of tourism
Litman (2008) elaborated on twelve factors that effect a destination’s accessibility, specifically: (i) Transportation modes – quality of transportation options, such as with respect to comfort, and safety; (ii) Transportation network connectivity – density of link and path connections, or directness of travel between destinations; (iii) Travel cost or affordability; (iv) Mobility – travel speed and distance, capacity, or travel time; (v) Integration of the links and modes within the transportation system; (vi) Transportation demand; (vii) User information – availability of reliable information on mobility and accessibility options; (viii) Mobility substitutes – telecommunications and delivery service substitutes for physical travel; (ix) Transportation management; (x) Land use factors; (xi) Prioritization of travel activities; and (xii) The value of inaccessibility or isolation. Improving these accessibility factors can contribute to the economic success of a tourist destination (Currie and Falconer 2014, Celata 2007).
Source: Nguyen Van Truong adapted and adjusted based on:
Stephen L. J. Smith, 1988, DEFINING TOURISM A Supply-Side View;
Lamb Barbara, Davidson Sally, 1996, Tourism and Transportation in Ontario, Canada: A vital link;
▪ number of visitor arrivals or participants;
▪ tourism expenditures or receipts;
▪ length of stay at the destination site;
▪ travel propensity indices
all retail businesses that produce commodities for the travelers:
▪ Hotels, accommodation;
▪ Recreational resources: Park, Zoological gardens; sport ground…
▪ Restaurants, gastronomic services, shops, museums,…
▪ …
Three fundamental components of tourism:
Supply side (Tourism product)
Transport (Accessibility
factors)
Demand side (Market)
New modes of transportation have revolutionized the tourism industry by improving distance-travel capabilities, travel speed, travel time, and comfort level. The introduction of railway laid the foundation for modern tourism, followed by the revolution of the automobile, which changed the style of regional and inter-regional tourism. International tourism was made possible soon thereafter by innovations in long-haul air transportation, which allowed for tourism in previously unreachable destinations (Chew, 1987). While energy-intensive forms of motorized transportation are preferred for long-haul travel because they save so much time, riding bicycles or walking at the destination can provide tourists with the on-site experiences they desire, such as relaxation or adventure (Millonig and Schechtner 2006, Lumsdon 2000). Cruise ships and ferries, categorized as modes of water transportation, have not only recovered the travel demand at the end of 20
thcentury and into the 2000s (Davenport and Davenport 2006, Zapata-Aguirre and Brida 2008), but have also become tourist destinations in their own right and formed tourism destinations in some cases (Tang and Jang 2010, Hanh 2006).
Figure 1-4. Accessibility factors and its effects on tourism
In general, a tourist destination’s accessibility can also be improved by developing the transportation infrastructure network or by improving connectivity between the network and tourist facilities. For example, the distance from a tourist’s place of origin to the desired destination can be reduced by adding a direct link between the two locations within the transportation network. Activities that widen links, or providing well-
No. Acc. Factors to a Des.
1 Transport modes 2 Transport network
connectivity
3 Travel cost or affordability 4 Mobility
5 Integration 6 User information 7 Mobility substitutes 8 Transport management 9 Prioritization
10 Land use factors 11 Isolation
Source: Litman, 2008, Evaluating Accessibility for Transportation Planning
Transportfactors Others
Effects to tourism industry directly:
- Travel cost savings - Travel time
savings
Effects to other related industries, i.e.: Expense for restaurant, food, drinks,… may be reduced
Tourism Demand
and Product
organized taxi connections for tourists near central bus or train stations can also improve connectivity between the transportation network and accommodations (Rietveld and Bruinsma 1998, Litman 2008). In some exceptions, improving transportation infrastructure may reduce accessibility. For example, in congested conditions, adding a new link or improving an existing link may increase average transportation costs, due to the potential differences between users’ equilibrium and the transportation system’s optimum state (termed "Paradox"; Sheffi 1985). This phenomenon can be addressed by integrating management measures into well-designed networks to reduce total travel time.
The impact of transportation improvements on tourism may be different for different types of travelers, depending on the role of the link to the destination. For instance, the introduction of an inter-regional high-speed rail line may increase inter-regional accessibility. This development will affect tourism flows from the place of origin to the destination, rather than enhance tourism flows generated at the destination itself (Pagliara et al. 2015, Gutiérrez, González, and Gómez 1996).
Cost is a major consideration determining the demand for a destination. It generally includes two elements: the cost of travel; and the cost of living and other services at the destination (Martin and Witt 1987, Martin and Witt 1988, Bimonte, Ferrini, and Grilli 2015). For tourists, the time they spend traveling represents one portion of the total cost.
The time cost varies according to their value of time (Pagliara et al., 2015); i.e., travel
costs include the actual amount of money they pay for the transportation service and the
cost in terms of their travel time. Travel cost savings result from accessibility
improvements (see Figure 1-5).
Figure 1-5. Relationship between transportation policy and travel cost
The enhanced quality of related tourism services – specifically, communication and information, booking procedures, restaurants, accommodation, and related transportation services etc. – can not only improve the accessibility of the destination, but can also affect tourists’ preferences. Many studies have shown the importance of travel-related services in tourism. For example, Rheims, Bazin, Beckerich, and Delaplace (2011) stated that the lack of luxury hotels at a destination poses a problem, as business travelers require this type of accommodation. They also noted that limited restaurant services on the weekends can be problematic for the tourism industry. One service practice utilized in the Bahamas, called the “One-stop online booking and Immigration Card”, allows tourists to book and change their reservations online, and interact with their travel companions via email in real time. The Immigration Card, which holds travelers’ information, was designed and produced by the government of the Bahamas to improve security and simplify procedures for tourists. This service improved accessibility and attracted more tourists to the Bahamas (Wignaraja et al., 2004).
1.2.2 Transportation for tourism or tourism for transportation
Gauthier (1970) reviewed in literature and characterized the relationships between transportation and economy into three types: positive, permissive, and negative effects.
This argument was developed later into transportation and tourism field by Duval (2007).
Initial equilibrium Initial
conditions
Transport policies will change in:
- Infrastructure - Services
Tourism :
- Tourism attractiveness - Tourism competitiveness
New equilibrium Policy
shocks
Compare the scenario (%
change in Total production, employment, value added)
Origin
Travel cost Travel time
Even make change in tourism commodities and services
Increase Decrease
No. of travelers Tourism receipt
Increase Decrease
Tourism destination The total cost
for tourism trip
Transport cost (money/time)
Expenditure for commodities -
services