INTEGRATING LINGUISTICS MAPS TO SHOW SCHOLARLY INTERPRETATION
Chitsuko F UKUSHIMA
University of Niigata Prefecture, Japan [email protected]
Abstract
There are four steps in the process of map-making using a computer: 1) Electronic data production, 2) Sorting and mapping data, 3) Comparing, integrating, superimposing, and linking data, and 4) Publishing linguistic maps. The third stage includes integrating linguistic data from different sources. In this paper, map integration in this stage is focused and its examples are introduced to prove that the procedure is also based on scholarly interpretation. First, linguistic maps of a small lexical system are integrated to depict lexical stratification in the area. Second, linguistic maps made from the phonological point of view are integrated to show phonological stratification in the area. Phonologically contrastive areas and phonologically transitional areas are expressed by integrated maps.
Keywords
Geolinguistics, linguistic maps, linguistic variation, map integration, scholarly interpretation
1. Introduction
The papers presented at a recent international symposium on geolinguistics prompted the author to comment on the current trends in geolinguistics around the world. Those papers are to be published in this special issue of Dialectologia. This review has already been published as part of a report coauthored with David Heap in the first issue of Dialectologia (Fukushima and Heap 2008).
In reviewing current trends in geolinguistics, the author found that there are four
steps in the process of map-making using a computer: 1) Electronic data production, 2)
Sorting and mapping data, 3) Comparing, integrating, superimposing, and linking data, and 4) Publishing linguistic maps (Fukushima and Heap 2008: 142). The first and second steps are sufficient for making a linguistic map. However, once linguistic maps are created, they may need to be compared, integrated, superimposed, and linked in order to make deeper analyses of the data. This third step includes the following procedures: 1) Integrating linguistic data from different sources, 2) using GIS (Geographic Information Systems) and superimposing maps, 3) Combining old and new materials, 4) Linking with multimedia information, and 5) Statistical analysis. In this paper we focus on map integration, using examples where linguistic maps are compared or integrated to show scholarly interpretation.
2. Using SEAL to integrate linguistic maps
The author has developed SEAL, a software system for personal computers to assist in making linguistic maps. From its very beginning in 1983 when it was published, the system has had the function of integrating linguistic maps. SEAL has also been used for individual map making (Fukushima & Fukushima 2002).
SEAL uses quantification (frequency counts of the selected items) to process the geolinguistic data in dialectometry. Whereas studies in dialectometry often aim to demarcate linguistic areas, the author’s method is different: integration is done based on scholarly interpretation. The maps to be integrated and the words to be counted are selected by the researcher. The quantification is simple; it is just the addition of frequency. After each map is made, related maps are integrated and the linguistic variation or diffusion are visualized on the map.
Linguistic maps not only exhibit the original data used to reconstruct the
linguistic history of an area but also they are the result of interpretation; that is the
challenge for linguistic reconstruction. When making linguistic maps, word forms are
selected based on the interpretation, but when integrating linguistic maps, the linguistic
maps are selected based on the interpretation. What is important in this method is to
decide on which linguistic feature to focus.
3. Comparing or integrating linguistic maps
We compare or integrate linguistic maps in the next step. We have several reasons to do so. There are linguistic maps that have similar distributions. This is caused by “internal reasons such as common linguistic features (semantic, phonological, morphological, and syntactic) as well as external reasons such as the areal boundary or the prestige of a certain dialect or word-forms” (Fukushima 2007: 40). The comparison or integration of linguistic maps can lead to further understanding of an area.
As an example, some linguistic maps of related lexical items make up a small lexical system. These maps often show similar or related distributions. By comparing them, linguistic changes can be examined more thoroughly. For example, the kinship terms of the Tokunoshima dialect, Amami, Japan, were analyzed (Fukushima 1995, Fukushima 2000b). Tokunoshima is an island located in the southwest of Japan (see Fig. 1).
Figure 1. Location of surveyed area
The survey of kinship terms was conducted by the author and colleagues in the
1970s. The terms found in the survey were grouped based on their geographical
distributions and registers. Four groups were identified (in their estimated chronological
order): Proto-Tokunoshima Type, Original Ryukyu Type, Adapted Ryukyu Type, and
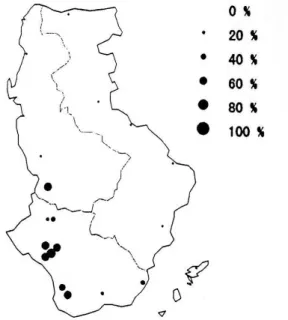
Modern Type. The variation in total word frequency in each group was displayed in integrated linguistic maps of the island. The Proto-Tokunoshima Type was? found separately in the north and the south. The Original Ryukyu Type was? found in the south and was? in complementary distributions with the Adapted Ryukyu Type. The Modern type is scattered across the island. The formation of the linguistic distributions was described as ‘dialectal stratification’ (Figs 2A-2E).
Figure 2A. Proto-Tokunoshima Type Figure 2B. Original Ryukyu Type
Figure 2C. Adapted Ryukyu Type Figure 2D. Modern Type
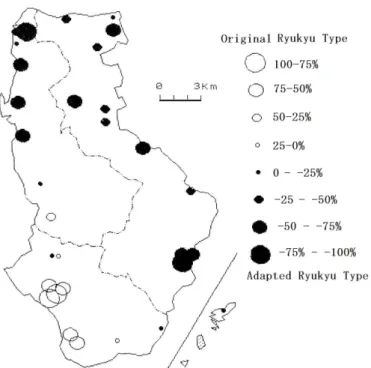
Figure 2E. Original Ryukyu Type vs. Adapted Ryukyu Type
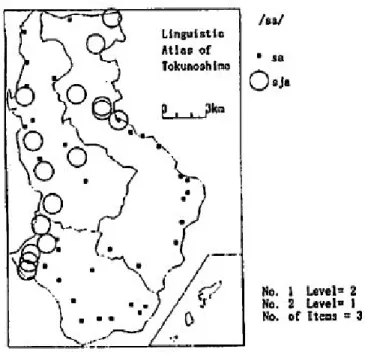
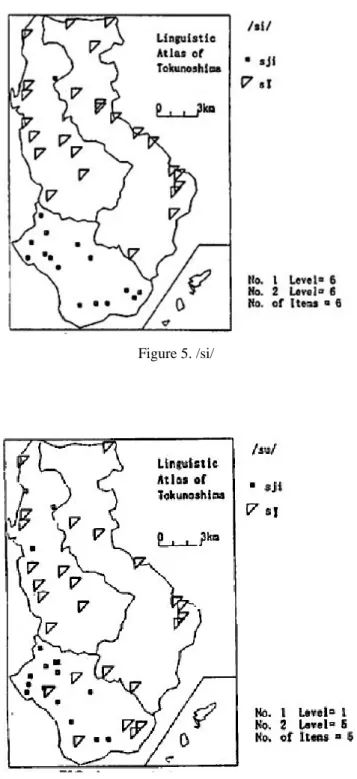
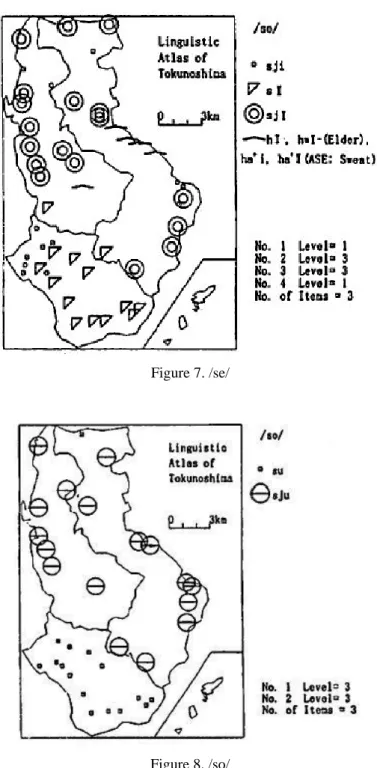
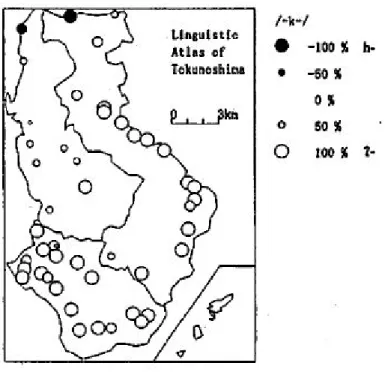
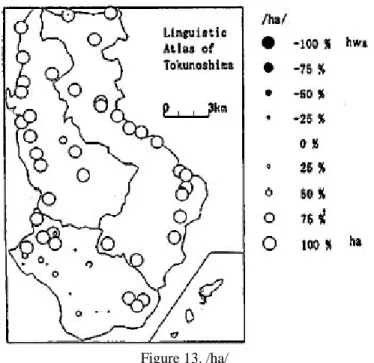
In addition to the lexical stratification shown above, phonological stratification can also be identified by integrating linguistic maps. Here we introduce examples from the Tokunoshima Dialect in one of the Ryukyu Dialects of Japanese. Groups of phonological linguistic maps are compared and integrated, thereby presenting evidence to explain the regional variation or diffusion.
4. Data
4.1. Original data
The geolinguistic data were collected in 1977 by the dialectologist Takahiro Okamura, a native-speaker. He surveyed 52 localities on the island. After the survey, the author and colleagues worked with him as a team to analyze the data and report the results (Okamura 1978). Later the author continued the analysis. She is responsible for creating the electronic data, mapping and analyzing maps for this paper.
11