Development of Listening Prochievement Tests for Third-Year Japanese Junior High School Students Studying English as a Foreign Language (Part II)
9
0
0
全文
(2)
(3)
(4)
(5)
(6)
(7)
(8)(9)
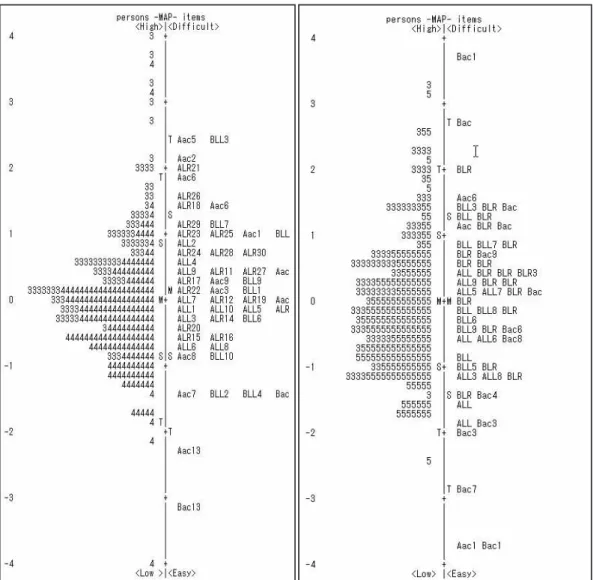
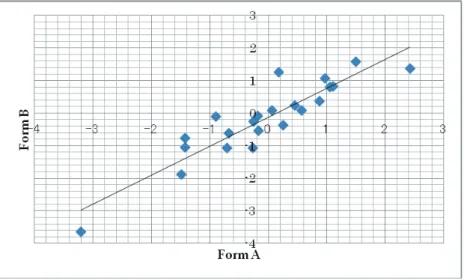
図
関連したドキュメント
Required environmental education in junior high school for pro-environmental behavior in Indonesia:.. a perspective on parents’ household sanitation situations and teachers’
The number of international students at Kanazawa University is increasing every year, and the necessity of improving the international students' Japanese writing skills,
We construct a Lax pair for the E 6 (1) q-Painlev´ e system from first principles by employing the general theory of semi-classical orthogonal polynomial systems characterised
The input specification of the process of generating db schema of one appli- cation system, supported by IIS*Case, is the union of sets of form types of a chosen application system
We show that a discrete fixed point theorem of Eilenberg is equivalent to the restriction of the contraction principle to the class of non-Archimedean bounded metric spaces.. We
Compared to working adults, junior high school students, and high school students who have a
It turns out that the symbol which is defined in a probabilistic way coincides with the analytic (in the sense of pseudo-differential operators) symbol for the class of Feller
Someone's intentionality (action or indication) inevitably and evidently links to other's one. Such co-ascription constructs an inter-bodily chain among these
