1
Influence of Chronic Kidney Disease on Coronary Plaque Components in
Coronary Artery Disease Patients with both Diabetes Mellitus and Hypertension
Eiji Shigemoto, MD 1 , Atsushi Iwata, MD, PhD 1 , Makito Futami, MD, PhD 1 , Yuta Kato, MD, PhD 1 , Motoki Yamashita, MD 1 , Satoshi Imaizumi, MD, PhD 2 , Takashi Kuwano,
MD, PhD 1 , Amane Ike, MD, PhD 1 , Makoto Sugihara, MD, PhD 1 , Keijiro Saku, MD, PhD 3, 4 , Shin-ichiro Miura, MD, PhD 1, 3
1 Department of Cardiology, Fukuoka University School of Medicine, 2 Department of
Clinical Research and Ethics Center, Fukuoka University School of Medicine,
3 Department of Molecular Cardiovascular Therapeutics, Fukuoka University School of
Medicine, and 4 Department of General Research Center for Medical Science, Fukuoka University School of Medicine, Fukuoka, Japan
Address correspondence to: Atsushi Iwata, MD, PhD, FJCC, Department of Cardiology,
Fukuoka University School of Medicine, 7-45-1 Nanakuma Jonan-ku, Fukuoka, 814-
0180, Japan. Tel: +81-92-801-1011; Fax: +81-91-865-2692; E-mail: iwaiwa@fukuoka-
2
u.ac.jp
3 Abstract
Chronic kidney disease (CKD) is well known to be associated with an increased incidence of coronary artery disease (CAD). Diabetes mellitus (DM) and hypertension (HTN), both of which are traditional risk factors for CAD, are the two most common causes of CKD. However, the influence of CKD on coronary atherosclerosis in CAD patients who have both DM and HTN remains uncertain. In these patients, we examined the relationship between CKD and coronary plaque using integrated backscatter
intravascular ultrasound (IB IVUS). Two hundred two CAD patients with both DM and HTN who underwent percutaneous coronary intervention using IB IVUS were included.
The patients were divided into two groups: CKD group (n=106) and non-CKD group
(n=96). Gray-scale and IB IVUS examinations were conducted for the non-culprit
segment of a coronary artery. As a result, although there was no significant difference in
the percentage of plaque volume, the percentage of lipid volume was significantly
higher in the CKD group than in the non-CKD group [median (IQR): 56.7% (45.4-
67.0%) vs. 52.0% (38.3-60.2%), p=0.03]. In all of the patients, estimated glomerular
filtration rate levels were negatively correlated with the percentage of lipid volume (r=-
0.15, p=0.03) and positively correlated with the percentage of fibrosis volume (r=0.15,
4
p=0.04). A multivariate regression analysis showed that CKD was an independent predictor associated with the increased lipid volume (β=0.15, p=0.047) and decreased fibrosis volume (β=-0.16, p=0.03) in coronary plaques. In conclusion, among CAD
patients who had both DM and HTN, CKD was associated with lipid-rich coronary plaques. CKD may contribute to the vulnerability of coronary plaque in these very high- risk patients.
Keywords: Chronic kidney disease; Coronary plaque; Intravascular ultrasound;
Diabetes mellitus; Hypertension
5 Introduction
Chronic kidney disease (CKD), the progressive loss of kidney function, is an expanding global public health problem [1]. It is well known that CKD is associated with adverse cardiovascular disease risk [2-4]. The two most common causes of CKD in many developed and developing countries are diabetes mellitus (DM) and hypertension (HTN) [2, 3], both of which are also traditional risk factors for coronary artery disease (CAD). A large-scale epidemiological study reported that patients with both DM and CKD had higher cardiovascular mortality compared to those with DM but without CKD [5]. It has also been reported that a low GFR independently predicts an increased risk for CAD in older patients with HTN [6]. Thus, CKD is associated with an increased risk of cardiovascular events in patients with DM or HTN.
Gray-scale intravascular ultrasound (IVUS) provides a more comprehensive
assessment of atherosclerotic coronary plaques compared with a coronary angiography
in humans [7]. However, conventional IVUS cannot be used to accurately identify
different components of coronary plaque. Recently, integrated backscatter IVUS (IB
IVUS) has been developed to evaluate the tissue characteristics of coronary plaques in
humans [8]. It has been reported that coronary plaque compositions as evaluated by IB
IVUS are well correlated with histological findings of coronary atherosclerosis [8]. In
6
fact, an increased lipid composition in coronary plaques as assessed by IB IVUS has been reported to be an independent predictor of future cardiac events in patients with CAD [9, 10]. A recent study using IB IVUS reported that lower estimated glomerular filtration rate (eGFR) levels were associated with greater lipid and lower fibrous components [11]. In CAD patients with DM, another study using virtual histology IVUS showed that patients with a lower level of eGFR had a greater necrotic core volume than those with a higher level of eGFR [12]. However, in CAD patients with both DM and HTN, who are at very high risk of future cardiac events, the impact of CKD on coronary atherosclerosis as evaluated by IB IVUS remains unclear. The purpose of the present study was to examine the relationship between CKD and coronary plaque using IB IVUS in CAD patients with both DM and HTN.
Materials and methods
Patients and study design
For this retrospective single-center study, a total of 1822 patients with stable CAD who
underwent percutaneous coronary intervention (PCI) at Fukuoka University Hospital
from October 2010 to January 2018 were screened. Of these, patients without DM or
7
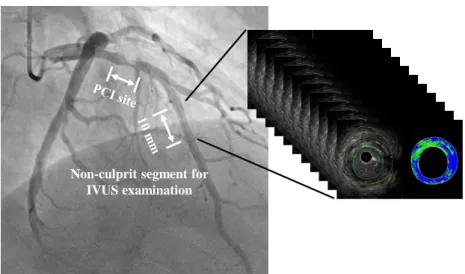
HTN, or who did not undergo PCI using IB IVUS, were excluded. The remaining patients were excluded from this study according to the following exclusion criteria: (1) patients with unanalyzable IVUS images of the non-culprit segment [7] (Fig. 1); (2) patients who underwent PCI for coronary bypass graft diseases; (3) familial
hypercholesterolemia; (4) contraindication to antiplatelet agents; (5) severe infection;
and (7) recent surgery or trauma. Ultimately, 202 CAD patients who underwent IB IVUS-guided PCI were included in the present study.
Patients were diagnosed as DM if they satisfied any of the diagnostic criteria defined by the Japan Diabetes Society [fasting blood sugar (FBS) level ≥126 mg/dl, 2-h 75 g oral glucose tolerance test glucose level ≥200 mg/dl or random plasma levels of blood sugar level ≥200 mg/dl], or if they continued to take hypoglycemic drugs with a
clear diagnosis of DM, as reported previously [13]. If patients had a current systolic blood pressure/diastolic blood pressure ≥140/90 mmHg or were receiving
antihypertensive agents, they were considered to have HTN [14]. eGFR was calculated
using the Modification of Diet in Renal Disease formula, and CKD was defined as
eGFR <60 ml/min/1.73 m 2 [15]. According to the Japanese guidelines for the secondary
prevention of myocardial infarction, all of the patients received standard antiplatelet
therapy before PCI [16]. Fasting blood samples for the measurement of clinical
8
laboratory data were collected before the PCI and IVUS procedures.
This study was approved by the ethics committee of Fukuoka University Hospital (EC/IRB: 15-7-14) and conducted according to the Declaration of Helsinki regarding investigations in humans.
IVUS procedure and analysis
Immediately after PCI of the culprit lesion, IVUS examination was conducted for the non-culprit segment (<50% stenosis evaluated by coronary angiography) of a coronary artery by an imaging catheter and a console (View IT and VISIWAVE, Terumo, Tokyo, Japan). After the intracoronary administration of an optimal dose of nitroglycerin, the IVUS catheter was advanced to the distal side of the PCI site, and pulled back
automatically at 0.5 mm/sec. As reported previously [17, 18], the most-diseased 10-mm segment (containing the cross-section with the greatest plaque burden) was selected as the target segment for IVUS analysis. The segments had to be located more than 5 mm proximal or distal to the PCI site (Fig. 1).
For IVUS analysis in this study, a quantitative IVUS analysis system
(VISIATLAS, Terumo, Tokyo, Japan) was used. This IVUS analysis system can
measure both the volume and component of coronary plaque. It has been reported that
9
the IVUS analysis system is suitable for the accurate measurement of coronary
atherosclerosis [19]. External elastic membrane (EEM) cross-sectional area (CSA) and lumen CSA were manually traced, and atheroma CSA (EEM CSA minus lumen CSA) was automatically calculated. These measurements were performed at 1-mm axis intervals for a length of 10 mm [17, 18] (Fig. 1). Using the IB IVUS analysis system, the volumes of vessel (Σ EEM CSA) and lumen (Σ lumen CSA) were calculated, and
total atheroma volume (TAV) was calculated as vessel volume minus lumen volume at the selected segment. Percent atheroma volume (PAV), the plaque burden at the selected segment, was calculated as 100 × TAV / vessel volume. The plaque
components were classified into 4 categories using the software for IB IVUS: lipid, fibrosis, dense fibrosis, and calcification, as described previously [8]. The software for IB IVUS automatically calculated the area and volume of each plaque component, and these IB IVUS parameters were presented as percentages.
According to the clinical expert consensus documents for IVUS analysis [7], an experienced physician who was unaware of the patients’ backgrounds conducted the IVUS analysis in this study.
Clinical laboratory examinations
10
For measurement of the clinical data in this study, fasting blood samples were collected just before IB IVUS-guided PCI. Low-density lipoprotein cholesterol (LDL- C), triglyceride (TG), high-density lipoprotein cholesterol (HDL-C), creatinine, FBS and Hemoglobin A1C (HbA 1c ) levels were measured at the Fukuoka University Hospital Laboratory Unit. eGFR was calculated as follows: 194×serum
creatinine −1.094 ×age −0.287 for males and 194×serum creatinine −1.094 ×age −0.287 ×0.739 for females.
Statistical data analysis
The SAS software package (version 9.4, SAS Institute) at Fukuoka University (Fukuoka, Japan) was used for statistical data analysis. Categorical variables are
presented as numbers and percentages. Continuous variables with a normal distribution are presented as mean ± SD. If continuous variables do not show a normal distribution, they are presented as median values (interquartile range). The chi-square test or Fisher’s exact test was used to compare frequency distributions of categorical variables between two groups. Differences in continuous variables with a normal distribution were
compared by the Student t test. Wilcoxon’s signed-rank sum test was used if the
continuous variables showed skewed distributions. To examine the correlations among
11
continuous variables including eGFR and IVUS parameters, the Spearman correlation or Pearson correlation was used according to the distributions of the variables. A multivariate regression analysis was conducted among conventional risk factors [age, male gender, body mass index (BMI) and current smoking] and LDL-C levels to identify the factors that were related to the percentages of lipid volume and fibrosis volume of coronary plaque. A P value less than 0.05 was considered to be significant unless indicated otherwise.
Results
Characteristics of the patients and clinical laboratory data
The patient characteristics in the present study are shown in Table 1. Patients with CKD
were significantly older than those without CKD [median (IQR): 70 years (66-78 years)
vs. 68 years (59-72 years), p=0.001]. There were no significant differences in the
frequencies of dyslipidemia, current smoking or history of myocardial infarction and
PCI between the groups. The frequencies of the use of glinide, β-blocker and diuretics
in the CKD group were significantly higher than those in the non-CKD group. The
frequency of the use of biguanide in the non-CKD group was significantly higher than
12 that in the CKD group.
Table 2 shows the clinical laboratory data of the patients in this study. There were no significant differences in LDL-C, HDL-C, HbA 1c or FBS levels, while the TG level in the CKD group was significantly higher than that in the non-CKD group [median (IQR): 146 mg/dL (90-224 mg/dL) vs. 113 mg/dL (78-151 mg/dL), p=0.005].
Systolic and diastolic blood pressure were similar between the groups.
Gray-scale and IB IVUS parameters at the non-culprit segment
Table 3 shows the gray-scale and IB IVUS parameters at the non-culprit segment.
Although TAV and vessel volume in the CKD group were significantly greater than those in the non-CKD group [median (IQR): 68.9 mm 3 (43.1-97.3 mm 3 ) vs. 54.7 mm 3 (32.9-74.0 mm 3 ), p=0.004 and 153 mm 3 (106-193 mm 3 ) vs. 130 mm 3 (78-168 mm 3 ), p=0.01, respectively], there was no significant difference in PAV between the groups (47.0% ± 11.8% vs. 44.7% ± 11.1%, p=0.15). The percentage of lipid volume in the CKD group was significantly higher than that in the non-CKD group [median (IQR):
56.7% (45.4-67.0%) vs. 52.0% (38.3-60.2%), p=0.03]. The percentage of fibrosis
volume was significantly lower in the CKD group than in the non-CKD group (39.6% ±
12.6% vs. 43.5% ± 11.9%, p=0.03). There were no significant differences in the
13
percentages of dense fibrosis volume or calcification volume between the groups.
Relations between clinical data and coronary plaques
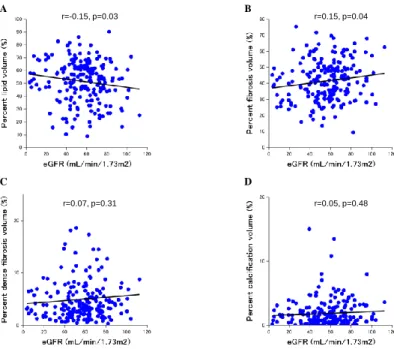
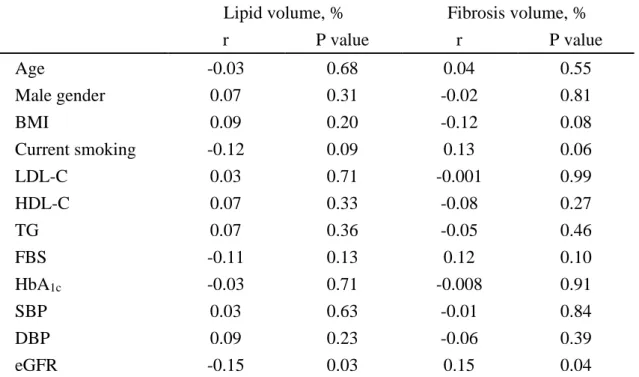
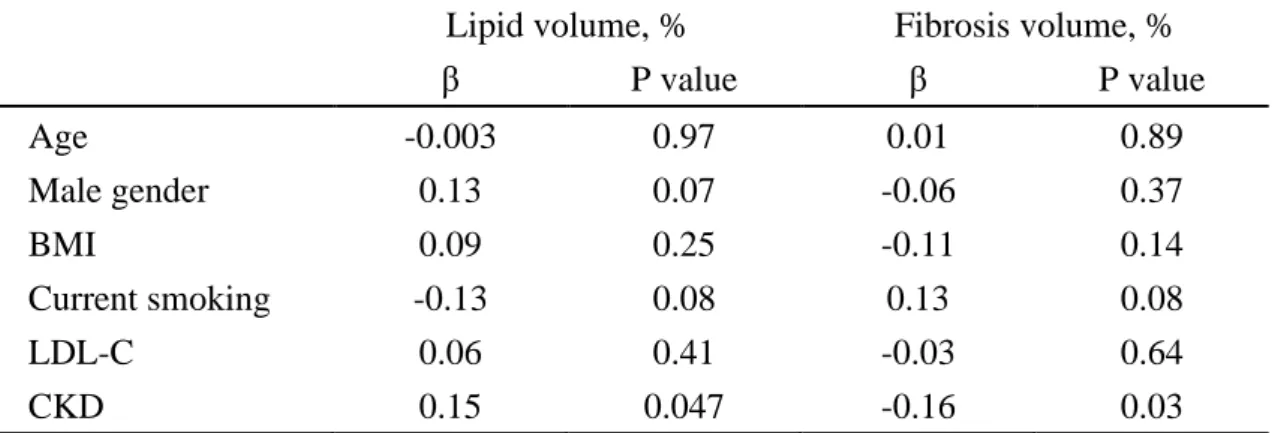
The relations between clinical data including eGFR levels and lipid and fibrosis volume at the non-culprit segment in all of the patients are shown in Table 4. There were no significant associations between the percentages of lipid volume and fibrosis volume and age, gender, BMI, smoking status, serum levels of LDL-C, HDL-C and TG, FBS and HbA 1c levels and systolic and diastolic blood pressure. Figure 2 shows the
associations between eGFR levels and gray-scale IVUS parameters in all of the patients.
eGFR levels were negatively correlated with TAV (r=-0.19, p=0.006) and vessel volume (r=-0.17, p=0.01), while there was no significant correlation between eGFR levels and PAV (r=-0.11, p=0.13). In all of the patients, as shown in Table 4 and Figure 3, eGFR levels were negatively correlated with the percentage of lipid volume (r=-0.15, p=0.03) and positively correlated with the percentage of fibrosis volume (r=0.15, p=0.04). There were no significant correlations between eGFR levels and the percentages of dense fibrosis volume and calcification volume (Fig. 3).
Table 5 shows the results of a multivariate regression analysis to identify the
factors that were related to the percentages of lipid volume and fibrosis volume at the
14
non-culprit segment. After adjustment for conventional coronary risk factors including LDL-C levels, CKD was found to be an independent predictor associated with increased lipid volume (β=0.15, p=0.047) and decreased fibrosis volume (β=-0.16, p=0.03) in coronary plaques.
Discussion
The present study showed that CKD was significantly associated with increased lipid and decreased fibrous plaque components as assessed by IB IVUS in CAD patients with both DM and HTN. In addition, a lower eGFR was significantly related to increased lipid volume and decreased fibrous volume of coronary plaques. After adjustment for conventional coronary risk factors by multivariate regression analysis, CKD was identified as an independent predictor associated with increased lipid and decreased fibrosis contents of coronary plaques.
The cause of the increased prevalence of CAD in individuals with CKD has not yet been fully elucidated, and is likely to be multifactorial. At least some of the increase in cardiovascular events in CKD patients is considered to be associated with the
clustering of traditional risk factors for CAD. DM and HTN, which are conventional
15
cardiovascular risk factors, are also the two most common causes of CKD [2, 3]. In patients with DM or HTN, renal dysfunction is related to an increased risk of
cardiovascular events [5, 6]. On the other hand, Nakayama et al. investigated the effects of DM and HTN on the risk for CAD in patients with CKD. They reported that patients with diabetic nephropathy or hypertensive nephropathy had a higher risk of
cardiovascular events than those with primary renal disease. [20].
Coronary plaque formation begins with risk factors for CAD that initiate the
process that leads to vascular tissue damage. Oxidative stress can trigger endothelial
dysfunction and the inflammatory process. All of these factors are involved in the
initiation and development of atherosclerotic diseases [21]. Both DM and HTN are
associated with the increased production of free radicals and oxidative stress, which
promote an inflammatory state and endothelial dysfunction [21-23]. Oxidative stress,
inflammation and endothelial dysfunction are also involved in the progression of renal
injury [24]. It has been reported that endothelial function is more impaired in patients
with early-stage CKD than in those without CKD [25], and endothelial dysfunction may
be an independent and incremental predictor of cardiovascular events in individuals
with CKD [26]. In addition, patients with end-stage renal diseases are subject to
enhanced oxidative stress caused by reduced anti-oxidant systems and increased pro-
16
oxidant activity [27]. These common pathophysiological conditions in patients with DM, HTN and CKD may strongly promote the progression of coronary atherosclerosis.
Several studies have been conducted to investigate the influence of CKD on coronary atherosclerosis. A postmortem study examined the relation of a renal function with advanced coronary atherosclerosis defined as American Heart Association type IV (atheroma), type V (fibro-atheroma), and type VI (complicated plaque). As a result, a lower eGFR was related to a high percentage of advanced coronary atherosclerosis [28].
Kashiyama et al. investigated the association between CKD and coronary plaque
progression/regression using IVUS after statin treatment. The authors demonstrated that plaque progression was found despite statin therapy in patients with eGFR <60
ml/min/1.73 m 2 , whereas plaque regression was observed in patients with eGFR ≥ 60
ml/min/1.73 m 2 [29]. Other studies using IVUS examined the relationship between
CKD and coronary plaque components. Miyagi et al. reported that CAD patients who
underwent elective PCI with eGFR <60 ml/min/1.73 m 2 had a higher percentage of lipid
volume and a lower percentage of fibrosis volume as evaluated by IB IVUS compared
to those with eGFR ≥ 60 ml/min/1.73 m 2 [30]. Another study using IB IVUS showed
that the decline in eGFR levels was associated with greater lipid and lower fibrosis
components of coronary plaques in CAD patients [11]. In CAD patients with DM, Ogita
17
et al. [12] reported that patients with a lower eGFR level had a greater necrotic core volume as assessed by virtual histology IVUS compared to those with a higher eGFR level. In the present study, we examined the impact of CKD on the tissue characteristics of coronary plaques in higher-risk CAD patients who had both DM and HTN.
Consistent with the results of previous studies, CKD and a lower eGFR were significantly associated with greater lipid components of coronary plaques. As
mentioned above, the clustering of risk factors for CAD such as DM, HTN, and CKD could more strongly promote oxidative stress, inflammation and endothelial damage, and as a result, the lipid components of coronary plaque may increase further.
The clustering of traditional cardiovascular risk factors does not fully account for the high incidence of CAD in CKD patients. Several conditions that are related to a decline in renal function are considered to be novel risk factors for CAD. Anemia accompanies worsening renal function as a result of a decline in the production of erythropoietin in the kidney. Anemia has been reported to be associated with an increased risk of cardiovascular events in CKD patients [31-33]. In addition, several factors such as abnormalities of calcium and phosphorus metabolism, altered
coagulation factors and impaired vascular stiffness may contribute to an increase in
cardiovascular events in individuals with CKD [32, 33]. Furthermore, it is well known
18
that higher albuminuria is an independent predictor of cardiovascular mortality in general population cohorts regardless of eGFR levels [34]. We did not examine the relationships between these factors and the tissue characteristics of coronary plaques.
Further studies using IVUS will be required to address these issues.
This study has several limitations. First, the sample size of the study is relatively small. A more large-scale study with IVUS will be needed to confirm our findings. Second, CAD patients who underwent PCI without IB IVUS examinations or who had unanalyzable IB IVUS images of the non-culprit segment were excluded from this study. Therefore, it is possible that there is a selection bias and our findings may not be applicable to all CAD patients with both DM and HTN. Third, we did not investigate the associations between the changes in renal function and coronary plaque components.
A prospective study with serial IB IVUS examinations will be required. Fourth,
although coronary plaques with increased lipid components are considered to be
vulnerable [8], the vulnerability of plaque also depends on the thickness of the fibrous
cap. Optical coherence tomography (OCT) can evaluate thin-cap fibroatheroma more
accurately than IVUS [35, 36]. Therefore, further studies using both IVUS and OCT
will be required to examine the associations between vulnerable plaques and CKD more
precisely.
19
In conclusion, among CAD patients with both DM and HTN, CKD was associated with an increased lipid content of coronary atherosclerosis. In these patients who are at very high risk of future cardiovascular events, CKD may contribute to the vulnerability of coronary plaque.
Conflict of interest
KS and SM are Directors of NPO Clinical and Applied Science, Fukuoka, Japan. KS and SM received a grant from the Public Interest Incorporated Foundation of “Clinical Research Promotion Foundation” in Fukuoka, Japan, and part of this work was
transferred to NPO Clinical and Applied Science, Fukuoka, Japan. KS has an Endowed
Department of Molecular Cardiovascular Therapeutics (SM), Fukuoka University,
supported by MSD Co., Ltd.
20 References
[1] Hu JR, Coresh J (2017) The public health dimension of chronic kidney disease: what we have learnt over the past decade. Nephrol Dial Transplant 32(suppl_2):ii113-ii120.
[2] Drawz P, Rahman M (2015) Chronic kidney disease. Ann Intern Med 162:Itc1-16.
[3] Jha V, Garcia-Garcia G, Iseki K, Li Z, Naicker S, Plattner B, Saran R, Wang AY, Yang CW (2013) Chronic kidney disease: global dimension and perspectives. Lancet 382(9888):260-272.
[4] Go AS, Chertow GM, Fan D, McCulloch CE, Hsu CY (2004) Chronic kidney disease and the risks of death, cardiovascular events, and hospitalization. N Engl J Med 351(13):1296-1305.
[5] Afkarian M, Sachs MC, Kestenbaum B, Hirsch IB, Tuttle KR, Himmelfarb J, de Boer IH (2013) Kidney disease and increased mortality risk in type 2 diabetes. J Am Soc Nephrol 24(2):302-308.
[6] Rahman M, Pressel S, Davis BR, Nwachuku C, Wright JT, Jr., Whelton PK, Barzilay J, Batuman V, Eckfeldt JH, Farber MA, Franklin S, Henriquez M, Kopyt N, Louis GT, Saklayen M, Stanford C, Walworth C, Ward H, Wiegmann T, ALLHAT Collaborative Research Group (2006) Cardiovascular outcomes in high-risk
hypertensive patients stratified by baseline glomerular filtration rate. Ann Intern Med
21 144(3):172-180.
[7] Mintz GS, Nissen SE, Anderson WD, Bailey SR, Erbel R, Fitzgerald PJ, Pinto FJ, Rosenfield K, Siegel RJ, Tuzcu EM, Yock PG (2001) American College of Cardiology Clinical Expert Consensus Document on Standards for Acquisition, Measurement and Reporting of Intravascular Ultrasound Studies (IVUS). A report of the American
College of Cardiology Task Force on Clinical Expert Consensus Documents. J Am Coll Cardiol 37(5):1478-1492.
[8] Kawasaki M, Takatsu H, Noda T, Sano K, Ito Y, Hayakawa K, Tsuchiya K, Arai M, Nishigaki K, Takemura G, Minatoguchi S, Fujiwara T, Fujiwara H (2002) In vivo quantitative tissue characterization of human coronary arterial plaques by use of integrated backscatter intravascular ultrasound and comparison with angioscopic findings. Circulation 105(21):2487-2492.
[9] Sano K, Kawasaki M, Ishihara Y, Okubo M, Tsuchiya K, Nishigaki K, Zhou X, Minatoguchi S, Fujita H, Fujiwara H (2006) Assessment of vulnerable plaques causing acute coronary syndrome using integrated backscatter intravascular ultrasound. J Am Coll Cardiol 47(4):734-741.
[10] Amano T, Matsubara T, Uetani T, Kato M, Kato B, Yoshida T, Harada K,
Kumagai S, Kunimura A, Shinbo Y, Ishii H, Murohara T (2011) Lipid-rich plaques
22
predict non-target-lesion ischemic events in patients undergoing percutaneous coronary intervention. Circ J 75(1):157-166.
[11] Hayano S, Ichimiya S, Ishii H, Kanashiro M, Watanabe J, Kurebayashi N,
Yoshikawa D, Amano T, Matsubara T, Murohara T (2012) Relation between estimated glomerular filtration rate and composition of coronary arterial atherosclerotic plaques.
Am J Cardiol 109(8):1131-1136.
[12] Ogita M, Funayama H, Nakamura T, Sakakura K, Sugawara Y, Kubo N, Ako J, Ishikawa SE, Momomura S (2009) Plaque characterization of non-culprit lesions by virtual histology intravascular ultrasound in diabetic patients: impact of renal function. J Cardiol 54(1):59-65.
[13] Seino Y, Nanjo K, Tajima N, Kadowaki T, Kashiwagi A, Araki E, Ito C, Inagaki N, Iwamoto Y, Kasuga M, Hanafusa T, Haneda M, Ueki K (2010) Report of the committee on the classification and diagnostic criteria of diabetes mellitus. J Diabetes Investig 1(5):212-228.
[14] Oparil S (2014) Updated guidelines for management of high blood pressure in Japan. Hypertens Res 37(6):484-487.
[15] Levey AS, Bosch JP, Lewis JB, Greene T, Rogers N, Roth D (1999) A more
accurate method to estimate glomerular filtration rate from serum creatinine: a new
23
prediction equation. Modification of Diet in Renal Disease Study Group. Ann Intern Med 130(6):461-470.
[16] JCS Joint Working Group (2013) Guidelines for Secondary Prevention of Myocardial Infarction (JCS 2011). Circ J 77(1):231-248.
[17] Maejima N, Hibi K, Saka K, Nakayama N, Matsuzawa Y, Endo M, Iwahashi N, Tsukahara K, Kosuge M, Ebina T, Umemura S, Kimura K (2015) Morphological features of non-culprit plaques on optical coherence tomography and integrated backscatter intravascular ultrasound in patients with acute coronary syndromes. Eur Heart J Cardiovasc Imaging 16(2):190-197.
[18] Mitsuhashi T, Hibi K, Kosuge M, Morita S, Komura N, Kusama I, Otsuka F, Endo M, Iwahashi N, Okuda J, Tsukahara K, Ebina T, Umemura S, Kimura K (2011)
Relation between hyperinsulinemia and nonculprit plaque characteristics in nondiabetic patients with acute coronary syndromes. JACC Cardiovasc Imaging 4(4):392-401.
[19] Nakayama N, Hibi K, Endo M, Miyazawa A, Suzuki H, Maejima N, Isshiki T, Kozuma K, Kimura K (2013) Validity and reliability of new intravascular ultrasound analysis software for morphological measurement of coronary artery disease. CircJ 77(2):424-431.
[20] Nakayama M, Sato T, Miyazaki M, Matsushima M, Sato H, Taguma Y, Taguma Y,
24
Ito S (2011) Increased risk of cardiovascular events and mortality among non-diabetic chronic kidney disease patients with hypertensive nephropathy: the Gonryo study.
Hypertens Res 34(10):1106-1110.
[21] Dzau VJ, Antman EM, Black HR, Hayes DL, Manson JE, Plutzky J, Popma JJ, Stevenson W (2006) The cardiovascular disease continuum validated: clinical evidence of improved patient outcomes: part I: Pathophysiology and clinical trial evidence (risk factors through stable coronary artery disease). Circulation 114(25):2850-2870.
[22] De Vriese AS, Verbeuren TJ, Van de Voorde J, Lameire NH, Vanhoutte PM (2000) Endothelial dysfunction in diabetes. Br J Pharmacol 130(5):963-974.
[23] Dinh QN, Drummond GR, Sobey CG, Chrissobolis S (2014) Roles of
inflammation, oxidative stress, and vascular dysfunction in hypertension. Biomed Res Int 2014:406960.
[24] Haugen E, Nath KA (1999) The involvement of oxidative stress in the progression of renal injury. Blood Purif 17(2-3):58-65.
[25] Moody WE, Edwards NC, Madhani M, Chue CD, Steeds RP, Ferro CJ, Townend JN (2012) Endothelial dysfunction and cardiovascular disease in early-stage chronic kidney disease: cause or association? Atherosclerosis 223(1):86-94.
[26] Hirata Y, Sugiyama S, Yamamoto E, Matsuzawa Y, Akiyama E, Kusaka H,
25
Fujisue K, Kurokawa H, Matsubara J, Sugamura K, Maeda H, Iwashita S, Jinnouchi H, Matsui K, Ogawa H (2014) Endothelial function and cardiovascular events in chronic kidney disease. Int J Cardiol 173(3):481-486.
[27] Locatelli F, Canaud B, Eckardt KU, Stenvinkel P, Wanner C, Zoccali C (2003) Oxidative stress in end-stage renal disease: an emerging threat to patient outcome.
Nephrol Dial Transplant 18(7):1272-1280.
[28] Nakano T, Ninomiya T, Sumiyoshi S, Fujii H, Doi Y, Hirakata H, Tsuruya K, Iida M, Kiyohara Y, Sueishi K (2010) Association of kidney function with coronary
atherosclerosis and calcification in autopsy samples from Japanese elders: the Hisayama study. Am J Kidney Dis 55(1):21-30.
[29] Kashiyama K, Sonoda S, Muraoka Y, Suzuki Y, Kamezaki F, Tsuda Y, Araki M, Tamura M, Takeuchi M, Abe H, Okazaki M, Fujino Y, Otsuji Y (2015) Coronary plaque progression of non-culprit lesions after culprit percutaneous coronary
intervention in patients with moderate to advanced chronic kidney disease: intravascular ultrasound and integrated backscatter intravascular ultrasound study. Int J Cardiovasc Imaging 31(5):935-945.
[30] Miyagi M, Ishii H, Murakami R, Isobe S, Hayashi M, Amano T, Arai K,
Yoshikawa D, Ohashi T, Uetani T, Yasuda Y, Matsuo S, Matsubara T, Murohara T
26
(2010) Impact of renal function on coronary plaque composition. Nephrol Dial Transplant 25(1):175-181.
[31] McCullough PA, Jurkovitz CT, Pergola PE, McGill JB, Brown WW, Collins AJ, Chen SC, Li S, Singh A, Norris KC, Klag MJ, Bakris GL; KEEP Investigators (2007) Independent components of chronic kidney disease as a cardiovascular risk state: results from the Kidney Early Evaluation Program (KEEP). Arch Intern Med 167(11):1122- 1129.
[32] van der Zee S, Baber U, Elmariah S, Winston J, Fuster V (2009) Cardiovascular risk factors in patients with chronic kidney disease. Nat Rev Cardiol 6(9):580-589.
[33] Kahn MR, Robbins MJ, Kim MC, Fuster V (2013) Management of cardiovascular disease in patients with kidney disease. Nat Rev Cardiol 10(5):261-273.
[34] Matsushita K, van der Velde M, Astor BC, Woodward M, Levey AS, de Jong PE, Coresh J, Gansevoort RT (2010) Association of estimated glomerular filtration rate and albuminuria with all-cause and cardiovascular mortality in general population cohorts: a collaborative meta-analysis. Lancet 375(9731):2073-2081.
[35] Kume T, Akasaka T, Kawamoto T, Okura H, Watanabe N, Toyota E, Neishi Y,
Sukmawan R, Sadahira Y, Yoshida K (2006) Measurement of the thickness of the
fibrous cap by optical coherence tomography. Am Heart J 152(4):755.e1-e4.
27
[36] Jang IK, Tearney GJ, MacNeill B, Takano M, Moselewski F, Iftima N, Shishkov
M, Houser S, Aretz HT, Halpern EF, Bouma BE (2005) In vivo characterization of
coronary atherosclerotic plaque by use of optical coherence tomography. Circulation
111(12):1551-1555.
28 Figure legends
Figure 1. Representative coronary angiography and IVUS images of the target vessel in
gray-scale and IB IVUS analyses. The length of the target segment for the IVUS analysis was 10mm. The segment had to be located >5mm proximal or distal from the PCI site. IVUS, intravascular ultrasound; IB, integrated backscatter; PCI, percutaneous coronary intervention.
Figure 2. Associations between eGFR levels and gray-scale IVUS parameters at the
non-culprit segments in all of the patients. TAV (A), vessel volume (B) and PAV (C).
eGFR, estimated glomerular filtration rate; IVUS, intravascular ultrasound; TAV, total atheroma volume; PAV, percent atheroma volume.
Figure 3. Associations between eGFR levels and IB IVUS parameters at the non-culprit
segments in all of the patients. Lipid volume (A), fibrosis volume (B), dense fibrosis volume (C) and calcification volume (D). eGFR, estimated glomerular filtration rate;
IB, integrated backscatter; IVUS, intravascular ultrasound.
29
Figure 1. Representative IVUS measurement for the non-culprit segment
Non-culprit segment for IVUS examination
Figure 2. Associations between eGFR levels and gray-scale IVUS parameters
r=-0.11, p=0.13 r=-0.17, p=0.01 C
B
A r=-0.19, p=0.006
30
D C
B A
r=0.05, p=0.48 r=0.07, p=0.31
r=0.15, p=0.04 r=-0.15, p=0.03
Figure 3. Associations between eGFR levels and IB IVUS parameters