Geographical Distance and Frequency of Contacts between Elderly Parents and Children in Japan
Wataru Koyano (Seigakuin University, Japan)
Masanori Nishimura, Tomoaki Ishibashi (Dia Foundation for Research on Ageing Societies, Japan) Yukari Yamada (Keio University, Japan)
Background: The traditional living arrangement of Japanese seniors was co-residence with the eldest son.
During a 40-year period from 1960, however, the frequency of co-residence has drastically decreased, and a new style of intergenerational solidarity has been emerging. In this study, in order to explicate the intergenerational relationships in today’s Japan, “structural solidarity” (i.e., geographical distance and frequency of contacts) between seniors and their adult children was observed.
Methods: The survey was carried out in 1998 with a nationally representative sample of seniors aged 65 years and over, and 2,311 persons were successfully interviewed (the response rate was 77.0%). The respondents ranged in age from 65 to 100 years, with an average of 72.1 years; 45.1% were men, and the remaining 54.9% were women. The respondents were asked to name all their children, and to indicate geographical distance from and the frequency of contacts with each of the children.
Results: Among the children named (n=5,947), 26.8% co-resided with parents, and 22.0% lived within 30 minutes of distance (with usual of transportation) from their parents (Table 1). For the seniors, 58.1% had coresident child(ren); 38.4% had child(ren) not co-residing but living within 30 minutes of transportation time;
73.6% had child(ren), either co-resident or not, living within 30 minutes of distance (Table 2). Significant differences by city size were found for the percentage of seniors who had child(ren) living near, when the effects of other variables were partialled out (Table 3).
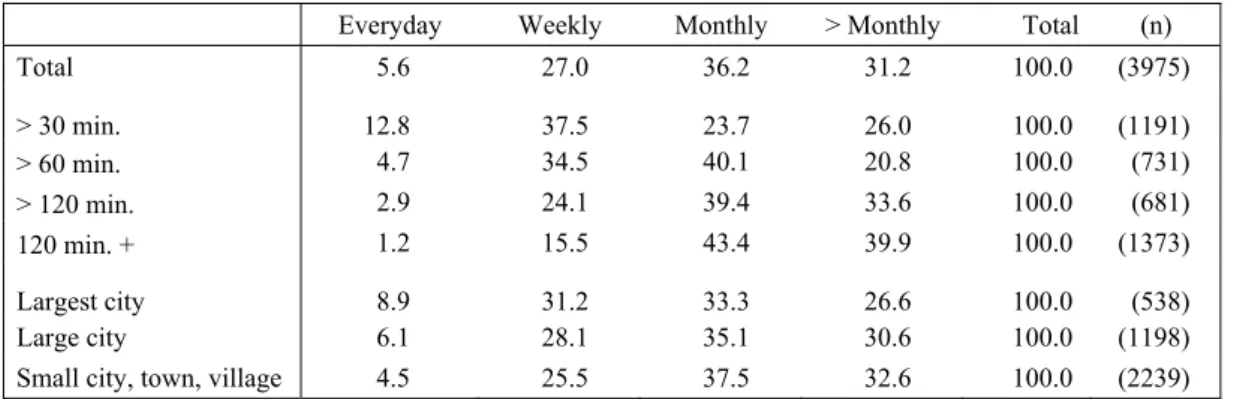
50.1% of the children living apart had face-to-face contacts at least monthly (Table 4), and 68.8% had mail and/or telephone contacts at least monthly (Table 5). Multiple logit analyses revealed significant urban-rural differences:
children whose parents lived in the largest cities were more likely to have frequent contacts with their parents than their counter parts, when the effects of other variables were controlled (Table 6).
Discussion: In the highly urbanized areas, the percentage of seniors co-residing with adult children, as well as those who had children living near, was significantly lower than in the less urbanized areas. However, the urbanization positively affected upon the frequent contacts between generations. The findings seem to indicate the emergence of a new pattern of intergenerational solidarity among Japanese seniors living in urban areas.
Table 1. Distance of Children City size of parents
Co-resident > 30 min. > 60 min. > 120 min. 120 min. + Total (n)
Total 26.8 22.0 13.4 12.4 25.3 100.0 (5497)
Largest city 28.8 15.2 15.5 18.1 22.4 100.0 (763) Large city 26.3 25.6 14.2 12.1 21.9 100.0 (1632) Small city, town, village 26.5 21.9 12.6 11.3 27.8 100.0 (3102) Figures are unweighted percentages based on the number of children.
Paper presented at the 17th World Congress of the International Association of Gerontology, Vancouver, Canada. July, 2001.
Address correspondence to: Wataru Koyano, DHSc., Professor of Gerontology, Seigakuin University,
362-8585, Japan. E-mail: [email protected]
Table 2. % of Seniors Having Children City size of parents
Co-resident > 30 min. > 60 min. > 120 min. 120 min. + No child Total (n)
Total 58.1 38.4 24.1 23.1 39.3 7.1 100.0 (2311)
[58.1] [73.6] [81.0] [86.0] [92.9] [100.0]
Largest city 51.9 24.3 25.1 29.5 33.8 13.0 100.0 (370) [51.9] [63.2] [72.4] [81.6] [87.0] [100.0]
Large city 54.2 41.8 23.8 21.2 36.0 7.1 100.0 (706)
[54.2] [73.7] [81.0] [85.6] [92.9] [100.0]
Small city, town, village 62.2 40.6 24.0 22.2 42.9 5.3 100.0 (1235) [62.2] [76.8] [83.6] [87.5] [94.7] [100.0]
Figures are unweighted percentages based on the number of seniors; figures in [ ] are cumulative frequencies.
Table 3. Effects of City Size on Having Children
Co-resident child Children living near (< 30 Min)
Either
Largest city (=1.0) 1 1 1
Large city 1.051 2.058** 1.55**
Small city, town, village 1.265 1.569** 1.498**
Figures are odds ratio when the other effects are controlled.
** p < .01.
Table 4. Frequency of Face-to-Face Contacts
Everyday Weekly Monthly > Monthly Total (n)
Total 6.5 17.1 26.5 49.9 100.0 (3996)
> 30 min. 19.7 40.3 29.3 10.7 100.0 (1197)
> 60 min. 3.0 18.8 49.3 29.0 100.0 (735)
> 120 min. 0.1 7.5 35.1 57.3 100.0 (681)
120 min. + 0.0 0.9 7.8 91.3 100.0 (1383)
Largest city 6.3 18.7 26.1 49.0 100.0 (541) Large city 8.0 20.2 27.8 43.9 100.0 (1197) Small city, town, village 5.7 15.1 26.0 53.3 100.0 (2258) Figures are unweighted percentages based on the number of children living apart.
Table 5. Frequency of Mail / Telephone Contacts
Everyday Weekly Monthly > Monthly Total (n)
Total 5.6 27.0 36.2 31.2 100.0 (3975)
> 30 min. 12.8 37.5 23.7 26.0 100.0 (1191)
> 60 min. 4.7 34.5 40.1 20.8 100.0 (731)
> 120 min. 2.9 24.1 39.4 33.6 100.0 (681) 120 min. + 1.2 15.5 43.4 39.9 100.0 (1373) Largest city 8.9 31.2 33.3 26.6 100.0 (538) Large city 6.1 28.1 35.1 30.6 100.0 (1198) Small city, town, village 4.5 25.5 37.5 32.6 100.0 (2239) Figures are unweighted percentages based on the number of children living apart.
Table 6. Effects of City Size of Parents on Frequent Contacts Face-to-Face Mail / Telephone
Largest city (=1.0) 1 1
Large city 0.67* 0.639**
Small city, town, village 0.526** 0.637**
Figures are odds ratio when the other effects are controlled.
* p < .05, ** p < .01.
Geographical Distance and Frequency of Contacts
between Elderly Parents and Children in Japan
Wataru Koyano Masanori Nishimura Tomoaki Ishibashi Yukari Yamada
Distance of Children
0% 20% 40% 60% 80% 100%
Child
Co-resident > 30 Min > 60 Min
> 120 Min 120 Min +
Distance of Children
(By City Size of Parents)
0 20 40
Co-resident > 30 Min > 60 Min > 120 Min 120 Min +
Largest City Large City Small City, Town, Village
%
% of Seniors Having Children (Cumulative Frequency)
0 20 40 60 80 100
Co-resident < 30 Min < 60 Min < 120 Min 120 Min +
% of Seniors Having Children (Cumulative Frequency by City Size)
0 20 40 60 80 100
Co-resident < 30 Min < 60 Min < 120 Min 120 Min + Largest City Large City Small City, Town, Village
Effects of City Size on Having Children
(Odds Ratio; Other Effects are Controlled)
**
**
** **
0 1 2
Co-resident <30 Min Either
Largest City (=1.0) Large City Small City, Town, Village
Frequency of Contacts
(Face-to-Face)
0% 20% 40% 60% 80% 100%
120 Min +
> 120 Min
> 60 Min
> 30 Min
Total Everyday
Weekly Monthly
> Monthly
Frequency of Contacts
(Face-to-Face; by City Size of Parents)
0% 20% 40% 60% 80% 100%
Small City, Town, Village
Large City Largest City Total
Everyday Weekly Monthly > Monthly
Frequency of Contacts
(Mail / Telephone)
0% 20% 40% 60% 80% 100%
120 Min +
> 120 Min
> 60 Min
> 30 Min
Total Everyday
Weekly Monthly
> Monthly
Frequency of Contacts
(Mail / Telephone; by City Size of Parents)
0% 20% 40% 60% 80% 100%
Small City, Town, Village
Large City Largest City Total
Everyday Weekly Monthly > Monthly
Effects of City Size of Parents on Frequent Contacts
(Odds Ratio; Other Effects are Controlled)
* **
**
**
0 1
Face-to-Face Mail / Telephone Largest City (=1.0) Large City Small City, Town, Village