materials and acidic hot spring water as
advanced direct use of geothermal energy
著者
バニー ノビタ アルビアーニ
学位授与機関
Tohoku University
materials and acidic hot spring water as
advanced direct use of geothermal energy
(先進的地熱直接利用としての廃アルミニウムと酸性
温泉を用いた水素製造)
A dissertation presented for the degree of Ph. D
Student number : B7GD1505
Name
: Vani Novita Alviani
Department of Environmental Studies for Advanced Society
Graduate School of Environmental Studies
Tohoku University
Japan
指 導 教 員
Supervisor at Tohoku Univ.
Prof. Noriyoshi TSUCHIYA
研 究 指 導 教 員 Research Advisor at
Tohoku Univ.
Assistant Prof. Nobuo HIRANO
審 査 委 員 (○印は主査) Dissertation Committee
Members The name marked with “○” is the Chief Examiner
○ Prof. Noriyoshi TSUCHIYA
1. Prof. Chihiro INOUE 2. Prof. Kazuyo MATSUBAE
3. Assoc. Prof. Noriaki WATANABE 4. Assistant Professor Nobuo HIRANO
Abstract
Ever-increasing global warming impacts and rising energy demand have led to increasing demand for reliable, renewable, and clean alternative energy. Hydrogen (H2) has gained massive attention
toward future energy for being abundant in nature, providing 120 MJ of usable energy per kg that is 2-3 times higher than other available fuels, can be produced by any form of energy, and many more. However, mature technologies in H2 production are currently derived from fossil fuel
utilization. Even though H2 is considered clean energy, yet it does not make it free pollution and
renewable by utilizing fossil fuel in the process. At the current rate, the large amount of CO2 is
still emitted to the atmosphere unless the way to generate H2 is taken from renewable resources.
Due to its excellent properties and broad purposes, H2 demand is expected to rise, and accordingly,
the renewable route for H2 production becomes necessary.
Amongst other renewable methods, the reaction of hydrolyzing metal with water is considered useful to provide a pure and high amount of H2 as it has been known that water is the most
substantial quantity of H2 feedstock. Of metals available, aluminum (Al) provides many
advantages of being abundant, low-cost, safe, and being able to generate H2 inahighly effective
amount. Considering raw materials, the utilization of waste materials and abundant natural resources is of great advantage. Natural acidic thermal water from geothermal manifestation or industrial wastewater is two of those potential sources. Aside from generating H2 in renewable
methods, the use of acidic thermal water or hot spring can be regarded as an effort toward the advancement of direct geothermal use. The use of industrial wastewater and Al waste materials are beneficial for handling waste properly. This study proposes an Al-H2O low hydrothermal
reaction to produce H2. The study objective is to bring an alternative H2 production method for
the fast-growing future H2 demand that is considered environmentally friendly and highly
efficient by utilizing naturally available thermal water resources and Al waste materials via method so-called Al-H2O low hydrothermal reaction. Another purpose is to evaluate the
environmental impact in terms of CO2 emission and energy requirement involved in the system,
as it is expected to contribute a low emission method to generate H2.
The Al-H2O low hydrothermal reaction employed reaction of Al and water at various levels of
temperature and pH in acidic and alkaline media. Acidic reactions were used in HCl and H2SO4
solutions, and alkaline reactions were used NaOH. Extreme pH (1-2 for acidic and 11-13.5 for alkaline) conditions and low hydrothermal temperatures ranged from 40ºC-100ºC were utilized
to satisfy the natural state of target resources. H2 production by this method was strongly pH- and
temperature-dependent, in which pH had a more significant effect than temperature. Overall, the H2 production rate in alkaline conditions was faster than in the acidic conditions. The use of strong
alkalis and acids in this method was useful to corrode the oxide layer on the Al surface as a significant issue owing to this Al-H2O reaction. The more extreme pHs and elevated temperatures
yield more amount of H2. The highest amount of H2 using acidic media appeared at pH 1 and
100°C within 2 hours (as for HCl and H2SO4 are 50.02 and 45.06 mmol gAl-1, respectively). The
highest production reached almost maximum theoretical yield in alkaline reaction within 2 hours at pH 13.5 and 100°C (55.56 mmol gAl-1).
The Al dissolution reaction in an extremely acidic solution was taken place to form Al3+ ions and
simultaneously produce H2. The release of H+ in the solution changed the bulk solution’ pH into
less acidic. Al(OH)3 was then precipitated as Al3+ concentration became saturated enough. The
H2 production reaction in an extreme acidic proceeded in these following mechanisms:
𝐴𝑙 + 3𝐻+→ 𝐴𝑙3++ 3/2𝐻 2,
𝐴𝑙3++ 3𝐻2𝑂 → 𝐴𝑙(𝑂𝐻)3+ 3𝐻+.
In the alkaline reaction, Al dissolved rapidly to produce Al(OH)4− (as the only Al ion presents in
alkaline condition) and release H2 gases. The concentration of Al(OH)4− gradually becomes
saturated due to the progressive consumption of OH− ions, and then it precipitated as Al(OH)3,
the following reactions occurred:
𝐴𝑙 + 3𝐻2𝑂 + 𝑂𝐻−→ 𝐴𝑙(𝑂𝐻)4−+ 3/2𝐻2.
𝐴𝑙(𝑂𝐻)4−→ 𝑂𝐻−+ 𝐴𝑙(𝑂𝐻)3.
From the H2 production amount, the reaction rate constant could be determined as a kinetics
consideration. The reaction rate constant was used to quantify both reactions in the following equations for three different solutions media:
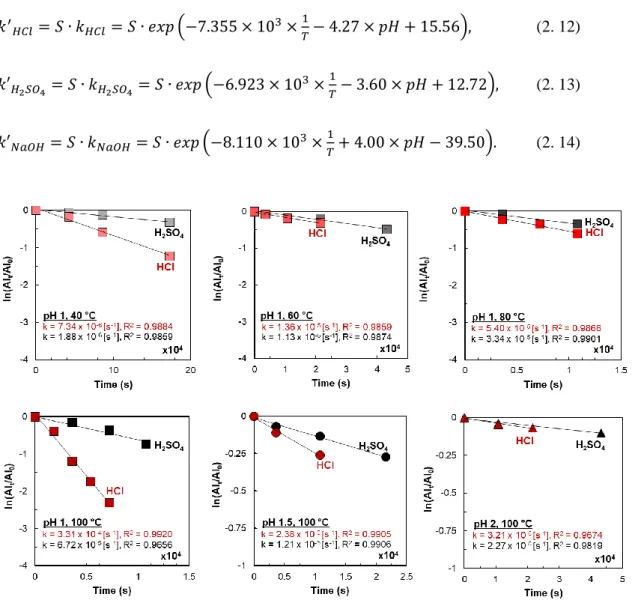
𝑘′𝐻𝐶𝑙 = 𝑆 ∙ 𝑘𝐻𝐶𝑙= 𝑆 ∙ 𝑒𝑥𝑝 (−7.355 × 103× 1 𝑇− 4.27 × 𝑝𝐻 + 15.56), 𝑘′𝐻2𝑆𝑂4= 𝑆 ∙ 𝑘𝐻2𝑆𝑂4= 𝑆 ∙ 𝑒𝑥𝑝 (−6.923 × 10 3×1 𝑇− 3.60 × 𝑝𝐻 + 12.72), 𝑘′𝑁𝑎𝑂𝐻= 𝑆 ∙ 𝑘𝑁𝑎𝑂𝐻= 𝑆 ∙ 𝑒𝑥𝑝 (−8.110 × 103× 1 𝑇+ 4.00 × 𝑝𝐻 − 39.50).
The kinetics and reaction mechanisms were used to formulate a predictive model of H2 production
at certain conditions given in acidic media. The predictive H2 production model was used to fit
acidic and higher HCl-H2SO4 ratio than Zao, resulted in ~17.9 L (0.79 mol) H2 in 2.5 h, and the
Zao spring ~3.6 L (0.16 mol) within 5 h. The result of both springs was having a good agreement, which suggested the model could be reproduced.
The finding in Al-H2O low hydrothermal reaction led to the subsequent investigation of
considering suited Al waste materials and acidic thermal water. Al sources were considered from waste materials such as Al dross and abandoned Al waste to replace primary metal that having a substantial environmental load. Water sources were from naturally occurring hot spring waters, Tamagawa hot spring, whose features satisfy the referred condition (extremely acidic with pH ~1). In this way, an advancement of direct geothermal use can also possibly be made. The reaction of Al waste materials and Tamagawa hot spring were temperature-dependent. Higher temperatures were more favorable to obtain a more significant production of H2. The largest
amount at the shorter reaction for both materials was about 55.30 mmol gAl-1 Al (for the chip),
and 19.74 mmol gAl-1 (for the dross) received at 100°C within 12 hours. Regardless of the
conditions examined, Al chip had more production compared to dross because of higher in Al content. As Al dross comprised mainly of Al2O3, the production rate became sluggish due to the
stable oxide layer on Al. The reaction mechanism of both was following the similar reaction progressed at extreme acidic in which Al dissolution reaction produced H2, and Al3+ ions in the
solution precipitated as Al(OH)3, as follows:
𝐴𝑙 + 3𝐻+→ 𝐴𝑙3++ 3/2𝐻2,
𝐴𝑙3++ 3𝐻2𝑂 → 𝐴𝑙(𝑂𝐻)3+ 3𝐻+.
Other reactions, e.g., the reaction of Na or Mg, might have occurred due to the compositional of the hot spring and Al materials (particularly dross). There was also additional concern on the decline of total As concentration, which may have taken place as either AsH3 formation or
arsenate compounds precipitation. It has not been confirmed in this work and thus required further investigation. The onsite measurement was performed using Al chip at Tamagawa hot spring at pH 1.18, 60.7ºC, within 4.5 h, and resulted in 8.51 L (0.38 mol). The onsite measurement had consistent results with the simulation. Overall, the reaction of Al waste materials and acidic hot spring water promoted a potential renewable source of H2.
The experimental results of lab and field scaled were used to examine an environmental assessment of H2 fuel in Semboku City (Akita Prefecture, Japan), a city that hosts the Tamagawa
hot spring. The scenario was that H2 fuel obtained from Al-H2O hydrothermal reaction being
compared to gasoline use. Comparison of Al materials for H2 production involved primary Al, Al
global energy requirement/GER (MJ) per unit mass of H2 produced from all processes in the
system boundary, including H2 production, hot spring neutralization, H2 purification, H2 storage,
by-products extraction, and fuel emission.
The Semboku City scenario required a 480 Nm3 H
2 per day according to the local community
estimation. The results to fulfill requirement scenarios obtained from the H2 fuel scenario by
Al-H2O low hydrothermal reaction were 80.9, -4.8, and -8.6 kgCO2-eq per kg H2 produced,
respectively, for primary Al, Al chip, and Al dross. In similar order for GER were 1,393.5 MJ, 178.8 MJ, and 123.1 MJ per kg H2. Gasoline scenario in a comparable amount required 257 L
gasoline per day. The GWP and GER of gasoline scenarios were 3.7 kgCO2-eq and 36.6 MJ per
liter gasoline. In general, utilizing Al waste materials for H2 production is beneficial for being
lower CO2 emission with comparable net energy toward gasoline scenarios and other available
technologies.
Aside from being useful and efficient in generating a renewable and environmentally friendly way of H2 production, Al waste materials utilization in this proposed method could contribute to
handling the waste of about 600 tons of Al dross, or 141 tons of abandoned Al waste per year. Then, utilizing hot spring water in the Semboku City scenario was equal to direct geothermal utilization of about 2.33 MWt and 73.40 TJ per year.
Furthermore, the present study brings an alternative solution to fast-growing H2 demand from
i
Table of contents
Table of contents ... i
List of figures ... iii
List of tables ... vi
Chapter 1 Introduction ... 1
1.1 Background ... 1
1.2 Methods on H2 production from renewable sources ... 4
1.3 Direct geothermal utilization ... 6
1.4 Advantages of Al waste materials ... 8
1.5 Problem-setting and proposed method ... 9
1.6 Study objectives and issues ... 11
1.7 Thesis overview ... 12
Chapter 2 Mechanisms and possible applications of the Al-H2O reaction under extreme pH and low hydrothermal temperatures ... 14
2.1 Introduction ... 14
2.2 Experimental details ... 16
2.2.1 Starting materials and lab experiments ... 16
2.2.2 Starting materials and onsite experiments ... 18
2.2.3 Analytical methods ... 20
2.3 Results and discussions ... 22
2.3.1 pH and temperature effect on H2 production ... 22
2.3.2 Liquid samples ... 29 2.3.3 Solid products ... 30 2.3.4 Reaction mechanism ... 39 2.3.4.1 Acidic reaction ... 39 2.3.4.2 Alkaline reaction ... 41 2.3.5 Kinetics models ... 42
2.3.6 Predictive mathematical models of H2 production ... 47
2.3.6.1 Calculation model ... 47
2.3.6.2 Fitting results ... 52
2.4 Summary ... 54
Chapter 3 Feasibility and advantages of Al waste materials and acidic hot spring water reaction ... 57
3.1 Introduction ... 57
3.2 Experimental details ... 59
3.2.1 Starting materials ... 59
3.2.1.1 Al chip... 59
3.2.1.2 Al black dross powder ... 59
3.2.1.3 Characterization of Al chip and Al dross ... 59
ii
3.2.2 H2 production experiment ... 67
3.2.3 Analytical methods ... 68
3.3 Results and discussions ... 70
3.3.1 H2 production ... 70 3.3.2 Reaction mechanism ... 75 3.3.3 Other reactions ... 83 3.3.4 Kinetics analysis ... 85 3.3.5 Onsite H2 production ... 89 3.4 Summary ... 91
Chapter 4 Environmental assessment on the proposed model of Al waste materials and acidic hot spring water reaction ... 93
4.1 Introduction ... 93
4.2 System boundaries ... 95
4.3 Materials flow and inventory... 96
4.4 Schematic design on H2 production plant ... 97
4.5 Results and discussions ... 99
4.5.1 H2 amount required ... 99
4.5.2 Acidic hot spring neutralization ... 102
4.5.3 H2 purification ... 102
4.5.4 H2 storage... 103
4.5.5 By-products extraction... 103
4.5.6 Fuel emission ... 104
4.5.7 AsH3 removal... 104
4.5.8 Transport of raw materials ... 104
4.5.9 Gasoline fuel ... 105
4.5.10 Environmental assessment results on the scenario of H2 use in Semboku City ... 105
4.5.11 Contribution to waste management and direct geothermal use ... 111
4.6 Summary ... 111
Chapter 5 Conclusion ... 114
5.1 Conclusion ... 114
5.2 Possible future works ... 117
References ... 120
Acknowledgments ... 128
iii
List of figures
Figure 1. 1 Fossil fuel utilization makes up the domination of the current H2 production methods
[26]. ... 4
Figure 1. 2 Distribution of direct geothermal utilization in Japan as of: (a) thermal capacity and (b) utilization by categories according to [33]. ... 7
Figure 1. 3 Potential hot springs for H2 feedstocks in Japan [36]. ... 8
Figure 1. 4 Al-H2O low hydrothermal reaction scenario used in this study. ... 11
Figure 1. 5 Structure of the thesis. ... 12
Figure 2. 1 Hastelloy C-22 reactor used. ... 17
Figure 2. 2 Pure Al powder; (a) as received, (b) in XRD pattern, and (c) under SEM observation. ... 18
Figure 2. 3 Front views of onsite reaction set-up in: (a) Zao (Tsuruya) hot spring, (b) Tamagawa hot spring, and schematic model. The inset figure in (c) shows Al concentration, pH, temperature, and heat changes through the reactor. ... 19
Figure 2. 4 Flow chart of the Al-H2O low hydrothermal reaction for H2 production. ... 21
Figure 2. 5 H2 produced by Al and solutions of (a) HCl, (b) H2SO4, and (c) NaOH. The horizontal dashed line is the theoretical maximum yield of H2 obtainable. As reaction proceeds with time, the H2 generation rate increases following elevated temperature and extreme pH. ... 27
Figure 2. 6 Comparative results of H2 production in the different acidic and alkaline reactions according to relevant studies. The dashed line is the theoretical H2 yield of the Al-H2O reaction [65,71,72,76–79]. ... 28
Figure 2. 7 The Al ion concentrations in the solution show a relatively consistent result from both *ICP-AES measurement and **H2 production tracing. ... 30
Figure 2. 8 XRD results for Al and Al(OH)3 phases: (a) HCl, (b) H2SO4, and (c) NaOH reactions, which all were compared to pre-reacted Al... 31
Figure 2. 9 Weight loss indicates the thermal dehydration of Al(OH)3 and associated endothermic peaks in (a) HCl, (b) H2SO4, and (c) NaOH reactions. ... 37
Figure 2. 10 SEM images show the surface morphology of pure Al powder and Al powder after reactions under various conditions in: HCl―(a) pH 1.5, 100ºC, 1 h, (b) pH 1, 40ºC, 12 h; H2SO4―(c) pH 1.5, 100ºC, 1 h, (d) pH 1, 40ºC, 12 h; NaOH― (e) pH 13, 40ºC, 12 h, (f) pH 13.5, 100ºC, 1 h. ... 38
Figure 2. 11 The change of pH toward less acidic occurs in the Al dissolution reaction using both acidic solutions (HCl and H2SO4). ... 40
Figure 2. 12 The change of pH toward less alkaline occurs in the Al dissolution reaction using the alkaline solution (NaOH). ... 42
Figure 2. 13 First-order rate constants for reactions at various acidic conditions. ... 44
Figure 2. 14 First-order reaction rate constants for Al reacting in NaOH at different pH and temperature conditions. ... 45
iv
Figure 2. 15 Reaction rates constant plotted with respect to pH and temperature for (a) HCl, (b) H2SO4, and (c) NaOH reactions. ... 46
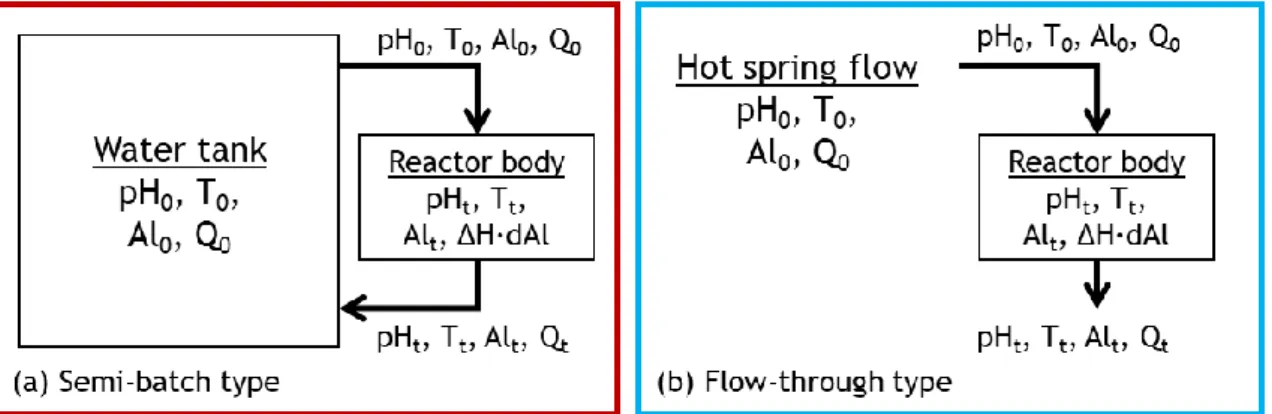
Figure 2. 16 Set-up of (a) semi-batch and (b) flow-through types are showing pH, temperature, Al concentration, and heat changes through the reactor. ... 48 Figure 2. 17 Semi-batch and flow-through types were simulated as H2 production, Al3+ ion
concentration, pH, and temperature. ... 51 Figure 2. 18 Predicted and measured H2 production at two hot springs. ... 53
Figure 2. 19 Simulated and measured pH, temperatures, Al3+ concentrations for reactions at (a)
Tamagawa and (b) Zao hot springs. ... 54 Figure 3. 1 (a) Photo, and (b) SEM image of as-received Al chips. ... 60 Figure 3. 2 (a) Photo, (b) SEM image, and (c) backscatter image of as-received Al black dross powders. ... 60 Figure 3. 3 XRD patterns of (a) Al pure powder, (b) Al chip, and (c) Al dross. Al pure powder and Al chip have Al peaks only. Meanwhile, Al dross contains not only Al characteristic peaks but also S=MgO4Al2, A=Al2O3, H=NaCl, N=AIN, and Qz=SiO2. ... 61
Figure 3. 4 Non-overlapping peaks of Al and Al2O3 standards. ... 63
Figure 3. 5 XRD patterns for peak intensities of Al and Al2O3 standards... 64
Figure 3. 6 Peak intensity ratio from four different weight ratios of Al and Al2O3 standards gives
K value. ... 65 Figure 3. 7 XRD patterns for peak intensities of Al dross and Al2O3 standards. ... 65
Figure 3. 8 Flow chart of Al-H2O low hydrothermal reaction using Al waste materials for H2
production. ... 69 Figure 3. 9 H2 production results by Al waste materials and Tamagawa hot spring water. ... 70
Figure 3. 10 H2 production comparison of this study and other relevant studies [65,71,72,76–79].
... 71 Figure 3. 11 A consistent correlation of Al3+ ion concentrations according to *ICP-OES
measurement and **H2 production tracing. It is obtained from the reaction of Tamagawa
hot spring with Al chip or Al dross. The dashed line is the Al3+ ion background
concentration of Tamagawa thermal water. ... 75 Figure 3. 12 XRD patterns of (a) Al chip, and (b) Al dross. ... 76 Figure 3. 13 TG-DTA analysis results from solid products of (a) Al chip, and (b) Al dross. ... 78 Figure 3. 14 The change of pH toward less acidic occurs in the Al dissolution reaction of Al chip and Al dross. ... 80 Figure 3. 15 SEM images show the surface morphology of Al chip after reactions under various conditions of; (a) 40ºC in 1 h, (b) 40ºC in 72 h, (c) 60ºC in 1 h, (d) 60ºC in 48 h, (e) 80ºC in 1 h, (f) 80ºC in 18 h, (g) 100ºC in 1 h, and (h) 100ºC in 9 h. The intensive crack generations occur at higher temperatures and prolonged exposure. Precipitated Al(OH)3
was observed as smaller particles. ... 81 Figure 3. 16 SEM images show the surface morphology of reacted Al after reactions under various conditions of; (a) 40ºC in 1 h, (b) 40ºC in 144 h, (c) 60ºC in 1 h, (d) 60ºC in 72 h, (e) 80ºC in 1 h, (f) 80ºC in 18 h, (g) 100ºC in 1 h, and (h) 100ºC in 12 h. The higher temperatures and prolonged exposure make metallic Al consumed and leave Al2O3.
Precipitated Al(OH)3 was observed on the surface. ... 82
Figure 3. 17 Na+ and Mg2+ ions concentration of reacted samples. Dashed lines are the background
v
Figure 3. 18 Total As concentration of reacted samples. The dashed line is the background concentration of As in Tamagawa hot spring. ... 85 Figure 3. 19 First-order rate constants for reactions using Al waste materials. ... 86 Figure 3. 20 Reaction rates constant plotted concerning pH and temperature for (a) Al chip, and (b) Al dross. ... 88 Figure 3. 21 Predicted and measured H2 production derived from Al waste material (Al chip) at
Tamagawa hot spring have relatively consistent results. ... 90 Figure 3. 22 Onsite H2 production results from Al chip and Tamagawa hot spring represented by
pH, temperatures, and Al3+ concentrations have a close agreement with the simulated
results. ... 90 Figure 4. 1 System boundaries for the H2 scenario. ... 96
Figure 4. 2 Material flow required to produce 1 kg H2. *Al dross is assumed to have approximately
23.5% Al content. ... 97 Figure 4. 3 Schematic design of the H2 production plant and its final use. The inset figure shows
pH, temperature, Al concentration, and heat changes in the flowing-hot spring reactor (FHR). ... 98 Figure 4. 4 Simulation results for H2 required per day in the Semboku City scenario from the
reaction of Tamagawa hot spring and (a) Al chip, and (b) Al dross. ... 100 Figure 4. 5 Simulated temperature and pH from the reaction of (a) Al chip and (b) Al dross with Tamagawa hot spring according to Semboku City scenario per day. The change of temperature is controllable, and the shift in pH suggests a neutralization reaction. .... 101 Figure 4. 6 Total CO2 emissions from gasoline and H2 fuels according to the H2 requirement
amount in Semboku City. H2 fuel derived from Al waste materials provided lower GWP
results (negative values are from neutralization contribution) than gasoline fuel and H2
fuel by primary Al. ... 107 Figure 4. 7 Energy requirement from gasoline and H2 fuel according to the H2 requirement amount
in Semboku City. H2 fuel derived from Al waste materials provided lower GER results
than gasoline fuel and H2 fuel by primary Al. ... 107
Figure 4. 8 GWP represents total CO2 emissions of the Al-H2O low hydrothermal reaction and
other H2 technologies, according to Borole and Greig (2019) [106]. H2 fuel derived from
Al waste materials provided lower GWP results than other available methods. ... 109 Figure 4. 9 GER represents the total energy required of the Al-H2O low hydrothermal reaction
and other H2 technologies, according to Borole and Greig (2019) [106]. H2 fuel derived
from Al waste materials provided relatively average GER results due mainly to indirect sources. ... 110
vi
List of tables
Table 2. 1 Summary of experimental conditions using commercial Al powders as the Al source.
... 16
Table 2. 2 The starting materials and reaction conditions used for the onsite experiments at Tamagawa and Zao hot springs. ... 18
Table 2. 3 Experimental results for various temperatures and pH values in acidic and alkaline experiments. ... 23
Table 2. 4 Comparative results of H2 production in the different acidic and alkaline reactions according to relevant studies [65,71,72,76–79]. ... 32
Table 2. 5 Cumulative weight loss of solid products by TG-DTA analysis corresponds with precipitated Al(OH)3*. ... 32
Table 2. 6 Reaction rate constants for H2 production from Al powder. ... 43
Table 2. 7 Similarities observed between acidic and alkaline reactions. ... 46
Table 2. 8 Differences between the acidic and alkaline reactions. ... 47
Table 2. 9 Simulation parameters used in the semi-batch and flow-through types. ... 51
Table 2. 10 Simulation parameters used in Zaoand Tamagawa hot springs. ... 52
Table 2. 11 Onsite H2 production results by Al foil and hot spring water. ... 53
Table 3. 1 Major element compositions of Al dross. ... 61
Table 3. 2 Minor element compositions of Al dross. ... 62
Table 3. 3 Peak intensity ratio of Al and Al2O3 standards from different weight fractions. ... 63
Table 3. 4 Peak intensity ratio of Al dross and Al2O3 standards from different weight fractions. ... 66
Table 3. 5 Tamagawa hot spring water composition. ... 66
Table 3. 6 The starting materials and reaction conditions used for all experiments. ... 67
Table 3. 7 H2 production results by Al waste materials and Tamagawa hot spring water. ... 72
Table 3. 8 Comparative studies of H2 production in this study and some other studies [65,71,72,76–79]. ... 74
Table 3. 9 Cumulative weight loss of solid products by TG-DTA analysis corresponds with precipitated Al(OH)3*. ... 79
Table 3. 10 Cumulative weight loss of solid products by TG-DTA analysis corresponds with precipitated Al(OH)3*. ... 79
Table 3. 11 Reaction rate constants of Al chip and Al dross and its specific surface. ... 86
Table 3. 12 Differences observed of both Al chip and Al dross reactions. ... 88
Table 3. 13 Similarities observed of both Al chip and Al dross reactions. ... 88
Table 3. 14 Simulation parameters used in Tamagawa hot spring and Al chip reaction progressed in flow-through type ... 89
Table 3. 15 Onsite H2 production results by Al chip and Tamagawa hot spring water. ... 90
Table 4. 1 Material inventory of CO2 emission and energy requirement per 1 kg H2 produced. 97 Table 4. 2 Simulation parameters used for Al waste materials and Tamagawa hot spring reaction required in Semboku City scenario. ... 100
vii
Table 4. 3 Total emissions and energy requirement for the complete system of Semboku City scenario. ... 106 Table 4. 4 Comparison of Al-H2O low hydrothermal reaction to other H2 production methods
1
Chapter 1
Introduction
1.1 Background
The continuous burning of fossil fuels exposes a large number of greenhouse gases to the atmosphere. Additionally, conventional fuel extraction leads to resource scarcity, poses price instability, and increases import dependency. Rising energy demand, along with ever-increasing global warming impacts from fossil fuel dependency, has led to increasing demand for reliable, renewable, and clean alternative energy. According to those reasons, hydrogen (H2) has gained
massive attention as the best fit for future energy carrier, especially for fossil fuel replacement [1–5].
H2 is the oldest known and simplest element that is composed of both a single proton and electron.
It is abundantly occurred in nature and makes up the main components of the universe. Long before H2 being considered to replace fossil fuel that is widely used today, H2 has majorly been
used for many industries such as ammonia production, petroleum refining, chemical industries, food industries, metal refining, and many more [6].
Currently, the global demand for H2 is mainly consumed in the refining industries [7]. In the
petroleum refineries, H2 works in the hydrocracking and hydroprocessing in which H2 is made to
react with hydrocarbons [6]. Hydrocracking and hydroprocessing are aimed to obtain a refined fuel with smaller molecules and a higher H/C ratio [8,9]. H2 can hydrogenate sulfur and nitrogen
compounds to leave H2S and NH3 only. There has been significant demand regarding the stricter
standard for unit emissions (NOx and SOx emissions), and product quality and specifications
control (higher fuel conversion and yield) [6]. Another primary use in the industry accounts for more than 40% of the total pure H2 produced represented by ammonia production [7]. Ammonia
2
is the primary precursor to nitrogen-based fertilizers. The process takes place by reacting gaseous H2 and N2 at high pressure to produce ammonia (e.g., Haber-Bosch process and other methods)
[10,11]. In petrochemical industries, H2 has been widely used to produce chemicals, such as
methanol, acetic acid, butyraldehyde, hydrochloric acid, and many more that are commercially available at present [6]. Aside from that, plastic recycling industries use H2 to hydrogenate molten
plastic in obtaining lighter molecules. At the later stage, those lighter molecules will be reused to produce polymers, which are materials’ origin in the plastic making [6]. In the food industries, H2, with the help of Ni catalyst, is being used to decrease the unsaturation degree of fats and oil
aiming to increase the melting point and enhance the resistance of oxidation so that it enables more extended preservation periods [6]. Technically, combining regular vegetable oils and H2 can
make hydrogenated vegetable oils, e.g., butter and margarine. In the metal refining, H2 acts as a
reducing agent of many metals production such as Ni, Mo, W, Co, platinum group minerals (PGM), etc. [12]. In the Ni production, for example, Ni in the solution form is leaving ammonium sulfate [6]. It is then converted and precipitated as an elemental form of Ni. It is noting that H2
has many extensive purposes in electronics manufacturing industries as well, including for coolant, semiconductor, display, LED, and photovoltaic application segments.
H2 has a range of benefits that offers valuable applications as prescribed. Aside from those
established purposes in industries, H2 is way more popular and hailed to become a promising
energy carrier. It is renowned for its benignity to the environment because H2 is clean energy, as
it only produces water as its combustion product. H2 can also afford being used for many useful
works, e.g., electricity and fuel. Although H2 occurs abundantly in nature, it does not exist as
single or free-H2 molecules, which is having bonding with other elements, such as bonded with
O2 forms water, with carbon and oxygen forms hydrocarbon and biomass sources. However, the
separation of H2 from those compounds can be made with any forms of energy that are currently
3
Additionally, as likely as fossil fuels, H2 can also be kept and stored for extended periods either
as compressed H2 gases, liquid H2, or hydrides, which is essential in an emergency state. Above
all, H2 can be domestically produced to fulfill on-demand H2. With all those benefits H2 can offer
altogether with broad applications it can provide, its demand is expectedly to rise in the foreseeable future.
Of course, H2 energy is not a piece of cake thing to be taken. Even though the expectation of H2
is quite high, so are the challenges. The current state of H2 production is mostly derived from
fossil fuel utilization, which is considered efficient in producing pure H2. Nevertheless, generating
H2 from fossil fuels is both a non-renewable and devastating environment. It would not eliminate
CO2 emission unless it utilizes renewable sources; in fact, greenhouse gases are still released
during the production process from fossil fuel conversion. To involve fossil fuel is not sustainable either because fossil fuel is a limited resource that is destined to run out soon. Moreover, price fluctuations will strongly influence it. To find an alternative solution toward a renewable and environmentally friendly method of H2 production is urgently required.
As for the application, H2 has seen an option for the road of transport sectors [13–15]. H2 is
colorless, odorless, non-toxic, and does not produce harmful emissions from its combustion with oxygen. It has a high energy density of 120 MJ per one kg H2, which 2-3 times provides more
energy per unit mass compared to gasoline and other alternative fuels such as biodiesel, ethanol, natural gas, and LPG [13,16]. For ages, H2 has been primarily used in the aerospace and aviation
industry, also maritime technologies. Since H2 is having excellent properties for its higher
efficiency and is considered the cleanest burning fuel, it thus attracts huge interest as fuel in automobiles as well. Recently, many carmakers industries have started selling H2-powered
vehicles commercially, e.g., Toyota, Honda, etc., so that H2 cars are already on roads. The
production method of H2 from renewable sources would be the best fit to address the new
4
1.2 Methods on H
2production from renewable sources
The driving adoptions of carbon-free fuels or H2 are notably climate change danger and global
energy issues. H2, which can be produced by various methods [3,4,17–25], is well placed to satisfy
future energy demands. At present, the shares of H2 produced worldwide relies on fossil fuel
utilization to which only covers up about 4% of total shares of H2 can be considered as from
renewable sources [26] (Figure 1. 1).
Figure 1. 1 Fossil fuel utilization makes up the domination of the current H2 production methods [26].
Up to now, renewably sourced H2 production methods come with its acceptances and challenges.
The methods are mainly not mature in the technologies compared with those coming from non-renewable ones. Renewable production methods are classified into four main categories according to the process of driving energy, namely thermal, electrical, photonic, and biochemical [27]. The renewable production methods can be possible to integrate two forms of driving energy as hybrid methods; e.g., combining electrical and thermal energy in a high-temperature electrolysis, hybrid thermochemical cycle, and etc.
Thermal methods are derived from thermal energy, which can assist chemical reactions to occur. Thermal methods comprise of thermolysis, thermo-catalysis, and thermochemical processes [27]. These methods have flexibility in terms of feedstock (i.e., water, H2S, biomass, biofuels). In
48%
30%
18%
4%
Natural gas
Heavy oil and naphtha Coal
5
thermochemical methods, water splitting is the most basic method to produce H2; it is realized by
splitting water molecules. Other merits of applying thermal energy are relatively clean and sustainable. The limitation lies in operating temperature to generate high purity of H2 is preferable
by using higher temperatures (more than 1000ºC [28,29]).
Electrical methods are those ways to generate H2 by passing a direct current through an
electrolyzer done mostly in water [27]. Water electrolysis is one of the electrochemical methods that utilizing electrodes to proceed with the chemical reaction of water decomposition into O2 and
H2. The H2 produced from electrical-derived processes are found to be the simplest technology,
and no pollution with renewable sources. It is why water electrolysis having a much percentage in the global H2 production method derived from renewable sources. However, it has a
disadvantage of huge electrical consumption.
In photonic energy, H2 production uses solar radiation only. The methods consist of
PV-electrolysis, photo-catalysis, photo-electro-chemical, and bio-photolysis [27]. This method is considered as low polluted and abundant sources. Nevertheless, it challenges to maintain production due to the intermittent source of solar radiation. Improving efficiency demands sophisticated photocatalytic materials that may be toxic, costly, and uneasy to handle.
Lastly, biochemical methods are carried out by extracting H2 stored in organic matters, i.e.,
biomass. Several methods are considered from biochemical energy, including dark fermentation, enzymatic and microbial processes [27]. These methods are benefitted from readily abundant sources, has low pollution, and can be operated in ambient condition. Nonetheless, it deals with the unstable production of H2 since it depends upon microbial activity to maintain the fermentative
environment. Besides, some material sources require additional pre-treatment to remove undesirable substances; eventually, H2 conversion can be expected high due to high carbohydrate
6
Water is the most substantial quantities of H2. Out of the aforementioned renewable methods, the
hydrolysis of chemical hydrides or metals to generate H2 is of great interest. Despite being
efficient in producing H2, the use of chemical hydrides is costly in which cost has been a
bottleneck of mostly H2 production methods. Therefore, hydrolysis of metal that is considered
cheaper is way preferable. Of the metals available, aluminum (Al) has numerous advantages for being abundant, safe, inexpensive, and multi-purposes. Utilizing Al waste materials is preferable to deal with the environmental burdens of Al production. As for water sources available that can satisfy low temperatures (below 100ºC) without any additional works are industrial wastewater and hot spring water. Therefore, reacting to Al waste materials and those thermal waters would also promote a low-cost source of H2 production method from renewable sources.
1.3 Direct geothermal utilization
Geothermal has been used either directly or indirectly for a long time since it has been found. Japan and Indonesia are two of those countries leading to geothermal resources [30–32]. The indirect use of geothermal refers to the extraction of geothermal heat by injecting lower temperature water into the subsurface and then converting the heat by a heat exchanger; eventually, the cooled water is pumped back and heated up again due to the Earth’s heat. Indirect geothermal use is associated with power generation. Meanwhile, the direct use of geothermal refers to the common forms of immediate use, i.e., heating system for building, farming, and tourism. In the conventional geothermal system, an active geothermal site is indicated by the presence of geothermal manifestations on the surface, such as hot/warm spring water, geyser, solfatara, fumarole, mud pool, and any of its kind which associated with direct uses. From 82 countries surveyed, there was around 70,329 MWt of installed thermal power; 587,786 TJ per year (163,287 GWh per year) of annual energy use; and a 0.265 of capacity factor [33] of direct geothermal use. Hot spring is a discharge of hot water from a vent at the Earth’s surface, which is generally characterized by temperatures about 40ºC and boiling point [34]. In the case of Japan, hot springs
7
are utilized mainly for bathing purposes in the Japanese-style inns or so-called onsen [33]. In Japan, the total capacity currently used is about 2,186 MWt, and the country’s total energy use of about 26,130 TJ annually. The direct use applications in Japan were summed up as 1.9% for geothermal heat pumps, 3.7% for space heating, 1.7% for greenhouse heating, 0.5% for fish farming, 0.6% for air conditioning, 0.1% for industrial uses, 1.4% for snow melting, and the rest of 90% is for bathing and swimming [33] (see in Figure 1. 2). Although there has been an increase in energy use in number from the previous survey, direct purposes remained to have no difference in categories, which are not optimized enough in applications other than balneology. By taking into account the vast capacity available, direct use application is conceivably diversified more.
Figure 1. 2 Distribution of direct geothermal utilization in Japan as of: (a) thermal capacity and (b) utilization by categories according to [33].
As hot springs are originated as fluid beneath the surface, not all of them are safe to be directly used by human beings or living organisms. Its features of having dissolved elements (Na, K, Ca, Mg, Al, Cl, SO4, HCO3, etc. [35]), the temperature range of ~40-100ºC [34], and pH around 1-11
[36], waters from hot spring remain possible to provide other benefits. Many potential hot springs in Japan have pH around 1-2 [36], which may benefit other purposes, e.g., H2 resources (Figure
1. 3). In this way, the use of hot spring will not affect other applications. Instead, the advancement and diversification use of geothermal energy can also be made.
5% 3% 2% 0% 2% 0% 83% 5% 4% 2% 2% 0% 1% 0% 90% 1%
Geothermal heat pumps Space heating Greenhouse heating Fish farming Air conditioning Industrial uses Bathing and swimming Snow melting
8
In the H2 production nowadays, geothermal energy takes part indirectly to provide auxiliary
electricity supply in lowering the burden from fossil fuels-derived power. Therefore, the attempt to utilize hot spring to produce H2 is considered not the only novel in H2 technologies but also
intensifying the direct role of geothermal energy toward H2 energy.
Figure 1. 3 Potential hot springs for H2 feedstocks in Japan [36].
1.4 Advantages of Al waste materials
Al is abundant on the Earth, widely used in various fields, safe, and inexpensive. The production volume of Al consistently increases every year, either from primary or secondary processes. It thus raises a massive concern of high energy and environmental impact caused by producing Al from bauxite. The energy required in the primary production alone is about 153 MJ, with a total emission as equal as 11.1 kgCO2-eq per one kg Al produced [37]. Secondary production has a
0 50 0 10 00 15 00 20 00 25 00 30 00 35 00 0 1 2 3 4 5 6 7 8 9 10 11 Number of s pa fa cil ities (ho t springs) pH potential
9
significantly lower impact per unit mass of Al produced of about 4.8 MJ kgAl-1 and 0.288 kgCO2
-eq kgAl-1, respectively [38].
In H2 production, the Al-H2O reaction has gotten massive attention because it is considered useful
to obtain a high amount and high purity of H2 as well as more economical compared to the use of
chemical hydrides. Considering the energy issue in Al production, Al ingot is no longer an option. The use of Al waste materials benefits the effort of lowering environmental impacts by taking note of only those waste materials that are not demanded by other processes or industries. Therefore, it does provide global material flow on the track and refrains new bauxite extraction, and also contributes a waste management effort accordingly. The candidate goes to abandoned Al waste and unused Al dross. Abandoned Al waste refers to those Al waste from Al-producing industries (e.g., electric manufacturers) that is considered unwanted or unrecycled, i.e., technical considerations. Al dross is typical by-products of Al smelter; it may have some percentage of valuable Al metallic content. The unused Al dross refers to those residual drosses after metallic Al being recovered in the doss industry. It is a significant breakthrough to utilize the unused Al dross than to leave it landfilled improperly.
1.5 Problem-setting and proposed method
The Al-H2O reaction has always been a fascinating topic to be discussed according to concerns
and interests (i.e., corrosion and passivation metal). Despite the Al-H2O reaction becomes a
common reaction to produce H2, and there has been a large number of researches conducted in
this field, one cannot conclude the global mechanism of this reaction. The challenging mechanism makes any sense due to certain specific conditions used, e.g., reactants’ concentration, solutions’ pH, anions’ presence and its nature, any pre-treatments, solid composition, solid form, temperature, immersion time, the presence of external media, and many others [39].
According to the background of the study and problem setting mentioned, the study proposes a method of producing H2 through an Al-H2O low hydrothermal reaction. This method is practically
10
a hydrolysis reaction of Al metal at a range temperature of 40ºC to 100ºC and an extreme pH condition (pH 1-2 for acidic and 11-13.5 for alkaline). It is noted to satisfy thermal water in the natural condition without applying for any pre-treatments or works. The Al metal is selected among other possible hydrolyzing metals for its availability and its excellent properties as a reducing agent to react with water. The reaction of Al and water to produce H2 is
thermodynamically favorable from room temperature to nearly melting point of Al. The reaction can afford high purity and highly efficient of H2 produced. Al-H2O reaction gives a beneficial
H2/Al molar ratio of 1.5, which means for every 1 g Al metal reacted with water, it can produce
about 1.24 L of H2.
In the previous study, investigation of pure water and Al at temperatures up to 340°C using various shapes and sources of Al has been successfully demonstrated and creating a predictive model [40]. Another study has also formulated a predictive model from different low operating temperatures and acidic pHs, in targeting the reaction of acidic hot spring and Al waste materials [41,42]. In this study, low operating temperature is also being a target, so that it extended the data from [40–42] under extreme pH at the low hydrothermal condition to reveal the fundamental study and practicable production. To date, a predictive model obtained from laboratory experiments is used to facilitate the development of industrial-scale, in-time, and on-demand H2
generation onsite.
Subsequently, the study recognizes the issue coming from Al sources. As Al production is being energy extensive, the sources of Al are considered from waste materials that remaining to contain considerable Al, such as abandoned Al waste and Al dross. Correspondingly, this way can handle a waste management issue. The study thus investigates the reaction of Al waste materials with hot spring water (i. e., extremely acidic hot spring whose pH more or less 1) both in the lab experiments and onsite production. Aside from a set of technical experiments to understand fundamental investigation at an early stage, the study is also equipped by an environmental
11
evaluation to provide knowledge of how efficient the system can contribute to the total emission and energy requirement in the use of H2 for fuel. The aim is to understand fundamental
investigation as part of research to assess the practicability of industrial H2 production at a later
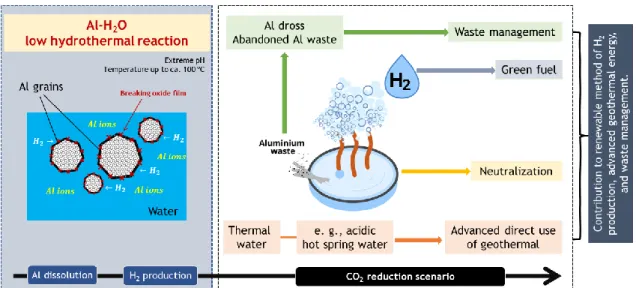
stage. Therefore, a complete roadmap of the study is shown in Figure 1. 4. The overall system remarks some consideration, including H2 use as a green fuel, hot spring neutralization,
advancement of direct geothermal use, and waste management.
1.6 Study objectives and issues
The proposed study aims two objectives according to the problem-setting, as mentioned above. The first objective is to bring an alternative H2 production method for the fast-growing future H2
demand, which is considered environmentally friendly and highly efficient by utilizing naturally available thermal water resources and Al waste materials via Al-H2O low hydrothermal reaction.
In particular, this study employs an extreme pH condition of the available resources to enhance the H2 production amount. The second is to evaluate the environmental impact in terms of total
CO2 emission and total energy requirement involved in the system according to the CO2 reduction
scenario roadmap in Figure 1. 4.
12
In achieving the study objectives, it demands to find the clarity of some issues, including the feasibility of the method and reaction mechanism at the fundamental investigation stage, a possible design of H2 production plant, and environmental assessment at the practical application
stage.
1.7 Thesis overview
The structure of this study covers five main chapters. Briefly, the thesis structure is shown in Figure 1. 5. Chapter 1 is the introductory part, which mainly comprises of background overview of the proposed study, problem-setting, and study objectives.
Chapter 2 discusses a more-in-depth study of Al-H2O reaction under low temperature and extreme
pH conditions. Pure Al and pH-adjusted waters (both acidic and alkaline) are used to examine the reaction under various temperatures, pHs, and reaction times. The H2 production results revealed
kinetics and reaction mechanisms, which help to propose a prediction model. The advantages of this study are reviewed in an onsite production.
Figure 1. 5 Structure of the thesis.
Chapter 3 investigates the finding in Chapter 2. The Al waste materials are considered from Al chip and Al dross as remarkable candidates for non-primary Al sources. This chapter delivers the
13
mechanism and kinetics of the reaction of Al waste materials and Tamagawa hot spring for H2
production. These two sources of Al are considered to minimize the burden of environmental impact from primary or secondary Al production routes. The results are used to investigate practicality in the field use by comparing the predictive model (established in Chapter 2) with the onsite measurement results.
Chapter 4 describes a system boundary, material flow and inventory, a possible design of the H2
production plant, and an environmental assessment. A system boundary defines a conceptual boundary or area of interest in the investigation. Material flow and inventory involve materials used to designate the final purpose. Along with system boundary and material flow and inventory, a possible design H2 production plant is proposed to provide a big picture of upscaled methods in
a practical setting. Subsequently, an environmental assessment is evaluated based on CO2
emission and energy requirement in selecting the final use of H2 as fuel. The assessment involved
all processes within system boundary, including H2 production, hot spring neutralization, H2
purification, by-products extraction, H2 storage, and emission of the fuel combustion to appraise
the effectiveness and efficiency of the system.
14
Chapter 2
Mechanisms and possible applications of the Al-H2O
reaction under extreme pH and low hydrothermal
temperatures
2.1 Introduction
Water is one of the most abundant H2 feedstocks. The reaction of a hydrolyzing metal with water
is an effective method for obtaining high-purity H2 [43–49]. Amongst the available metals, Al has
excellent advantages of being abundant and safe with its current extensive use. It was reported that the use of Al in hydrolysis is 10–20 times cheaper than the price of methods using hydrides; one considered also releasing a large amount of H2 gas [17,50–54]. In the Al-H2O reaction, for
each 1 g, Al can produce about 1.24 L H2 in a highly exothermic and thermodynamically
favorable reaction from room temperature to nearly the melting point of Al. Aside from heat and H2, the reaction identifies by-products as Al(OH)3 at room temperature to 280°C, AlO(OH) at
280°C–480°C, and Al2O3 at >480°C, according to these following reactions [55,56]:
2𝐴𝑙 + 6𝐻2𝑂 → 2𝐴𝑙(𝑂𝐻)3+ 3𝐻2+ 16.3 𝑀𝐽 𝑘𝑔⁄ 𝑜𝑓𝐴𝑙, (2. 1)
2𝐴𝑙 + 4𝐻2𝑂 → 2𝐴𝑙𝑂(𝑂𝐻) + 3𝐻2+ 15.5 𝑀𝐽 𝑘𝑔⁄ 𝑜𝑓𝐴𝑙, (2. 2)
2𝐴𝑙 + 3𝐻2𝑂 → 𝐴𝑙2𝑂3+ 3𝐻2+ 15.1 𝑀𝐽 𝑘𝑔⁄ 𝑜𝑓𝐴𝑙. (2. 3)
The primary issue of these reactions is the surface passive-oxide film on the Al, which prohibits water from making direct contact [57–59]. The known countermeasures to optimize H2 generation
are activated Al treatments, such as amalgamation [60] and using additives or catalyst [44,57,58,61–66]. The materials necessary for each of these treatments are often costly and
15
sometimes toxic. Sample preparations consume much energy, and treatments often lead to the possibility of the treated Al losing its chemical activity when exposed to air.
The investigation of commercial Al powders or industrial Al waste and water over a broad range of temperatures has been reported [40,43,46,58,63,67–70]. Lower-temperature reactions (usually from room temperature to ~80°C) often require mechanical treatments to activate the Al [56,65,71]. An alternative approach to use low-cost reagents and equipment is found by using acid or base for the oxide layer removal on the Al. Amongst strongly acidic solutions, HCl and H2SO4 are favored to promote the reaction [39,72]. Whereas, from alkaline solutions, NaOH and
KOH are the most suitable alkalis to expedite H2 generation [48,62–64,73], amongst others. Either
in strong acid (pH < 3.5) or strong alkali (pH > 11.5), Al dissolves intensely, and the oxide layer formed is thin. In contrast, the oxide appears as a thick and stable layer at a relatively neutral pH, thus reducing the H2 production rate [74].
Although there are numerous studies concerned in the reaction of Al-H2O for H2 generation, it is
nevertheless challenging to reveal the global mechanism on it. The mechanism strongly relies on specific conditions used, e.g., the concentration of reactant, the initial pH of the solutions, the presence of anions and its nature, pre-treatments on Al, solid composition, solid form, temperature, immersion time, the presence of external media [39]. Excluding any pre-treatment to Al, a study was performed to examine an Al-H2O reaction at higher temperatures up to 340°C in pure water
[40], and another study worked on the low hydrothermal temperature at a range of 40°C-100°C in acidic solutions [41,42]. The present study extended experiments from [41,42] under low hydrothermal conditions (less than 100°C) with no additional pre-treatments on Al and employed both extremely acidic and alkaline media. Reactions were compared at various pH levels and temperatures, and the reaction mechanism for each solution was clarified. The reaction rate results delivered kinetics to quantify the reaction. Altogether with the reaction mechanism, it proceeded a predictive model of H2 production. Aside from being favorable amongst other acids, HCl and
16
H2SO4 solutions were used because Cl− and SO42− are the main anions in the acidic water from
thermal springs as this study aims to deploy the H2 production in extreme acidic hot spring (pH
1-2). Utilizing its strong alkalinity to boost H2 production, the base considered herein is NaOH in
which often contained in industrial wastewater.
2.2 Experimental details
2.2.1 Starting materials and lab experiments
All starting materials used in the experiment are presented in Table 2. 1. The acidic reactions were conducted at pH 1–2 at 40–100°C within 0.5–48 h. The alkaline reactions were performed at the same temperatures at pH 11–13.5 and completed within 0.5–72 h. The experiments used a Hastelloy C-22 reactor in Figure 2. 1, which has a volume capacity of 170 ml, with maximum operating temperature and pressure of about 300°C and 20 MPa.
Table 2. 1 Summary of experimental conditions using commercial Al powders as the Al source.
Condition Al (mmol) Solution Time (h) pH T (°C) Solution type Volume
(ml)
Acid 4 HCl or H2SO4 135 0-48 1.0-2.0 40-100
Alkaline 4 NaOH 150 0-72 11.0-13.5 40-100
In a typical one experimental run, 0.108 g of Al powder (4 mmol, purity 99.50%; size 53-150 µm; Wako Pure Chemical Industries) in solution was loaded into an inner cylinder and set in the reactor (Figure 2. 2a). As received materials, Al was characterized by X-ray diffraction (XRD), scanning electron microscope (SEM), and Brunauer-Emmett-Teller (BET) method. From XRD identification, Al has only one crystalline phase that is Al (Figure 2. 2b), and SEM observed the Al morphology as a smooth surface (Figure 2. 2c). The specific surface area of Al powder (𝑆𝐴𝑙𝑝𝑜𝑤𝑑𝑒𝑟) obtained by BET analysis is 0.713 m2 g-1. The acidic solutions were firstly made by
diluting HCl solution (98.80%; Wako Pure Chemical Industries) or H2SO4 solution (99.9%; Wako
17
alkaline solutions were made from granular NaOH (93.00%; Wako Pure Chemical Industries) and distilled water/DW.
Figure 2. 1 Hastelloy C-22 reactor used.
Before the reaction, N2 gas was initially flowed for 10-15 min to remove impurity gases (e.g., O2)
in the reactor, which helped to prevent Al oxidation inside the reactor. As the Al–H2O reaction
has exothermic behavior, the Al/H2O ratio has a critical effect on the reaction, as it helps reaction
to proceed spontaneously. The solutions’ mixture volume was made as listed in Table 2. 1 to maintain a heating rate of about 15°C min–1 while it was heated to the desired temperatures. A thermocouple and external heater equipped the batch-type reactor to acquire constant temperature. Also, the magnetic stirrer was applied at ~150 rpm to ensure the homogeneity of the mixture and temperature. Ambient pressure was used for all experiments. The reaction proceeded with time and started once the target temperature was achieved. When the reaction finished, the reactor was cooled from the reaction temperatures of 40°C-100°C to nearly room temperature for up to 3 mins by flowing cool water through a reactor jacket. After cooling, samples consisting of solid, gas, and liquid were collected through the gas valve and liquid sampling tube. The gas was collected
18
into a gas bag through a gas valve at the upper part of the reactor. The collected gas amount was measured by water displacement method in a glass measuring cylinder, which was submerged in a full chamber of tap water. Once the collected gas from the gas bag was injected into the glass measuring cylinder, the displaced water was equal to the gas volume. The solid samples were collected by filtering the solution, so it left liquid samples as well. The samples of liquid, solid, and gas were further separately analyzed.
Figure 2. 2 Pure Al powder; (a) as received, (b) in XRD pattern, and (c) under SEM observation.
2.2.2 Starting materials and onsite experiments
As previously reported in [41,42], the effect of dissolved components in hot springs has no considerable difference in terms of H2 production amount; thus, similar reactions can be
practically implemented to hot spring water without having any treatments on the dissolved components. The onsite experiments were conducted in two locations, which were Tamagawa and Zao hot springs in north-eastern Japan. The starting materials and reaction conditions are presented in Table 2. 2.
Table 2. 2 The starting materials and reaction conditions used for the onsite experiments at Tamagawa and Zao hot springs.
Materials Amount Time pH T
(h) (°C)
a. Tamagawa 1. Al foil 3.7 mol 2.5 0.88 50
2. Hot spring water 10 L
b. Zao 1. Al foil 3.7 mol 5 1.60 50
19
Al used were Al foils (thickness 12 µm; Nippaku foil, Mitsubishi Aluminium) as much as 100 g or ~3.7 mol with naturally acidic thermal water reacted in a flow-through reaction system at a flow rate of about 15 L min-1. The specific surface area of Al foil (𝑆
𝐴𝑙𝑓𝑜𝑖𝑙) was 0.014 m2 g-1
measured by BET analysis. The experimental set-up in onsite H2 production is shown in Figure
2. 3.
Figure 2. 3 Front views of onsite reaction set-up in: (a) Zao (Tsuruya) hot spring, (b) Tamagawa hot spring, and schematic model. The inset figure in (c) shows Al concentration, pH, temperature, and heat
20
As illustrated in Figure 2. 3, spiral-shaped Al foil filled the reactor body to a height of 30 cm (a volume capacity of about 10 L), and hot spring water then flowed into the bottom of the reaction chamber. The Tamagawa and Zao springs had pHs of 0.88 and 1.60, respectively, and temperatures of both were ~50°C. The gas samples, as shown in Figure 2. 3, were collected at the upper part of the reactor body. Likewise, the collected samples were prepared and measured in a similar method as in the laboratory experiments. The onsite H2 production results will be used to
assess the feasibility of the industrial scale at these spring sites.
2.2.3 Analytical methods
Gas samples were collected into gasbags, and the volume being measured in a glass measuring cylinder. The purity of H2 from the gas samples was then analyzed by gas chromatography
(GC-3200/TCD; GL Sciences Inc.). The instrument used a capillary column (TC Molsieve 5A; GL Sciences, Inc; length 30 m; inner diameter 0.53 mm; film thickness 50 μm), and the column, detector, and inlet temperatures were set to be 60°C, 100°C, and 120°C, respectively. Calibration involved H2 standard gas (pure standard 99.9% H2 gas; GC Sciences). The H2 volume was
calculated from the multiplication of the H2 purity percentage by GC and the collected gases’
volume.
Liquid and solid samples were initially separated using filter paper (Whatman 125φ). A pH meter assessed the liquid pH at ambient temperature (MM 60 R; DKK-TOA Corporation), and inductively coupled plasma–atomic emission spectroscopy (ICP–AES; Thermo Scientific ICAP 6300 Duo) measured the Al ion concentration in solution. The preparation involved diluting samples to 1 wt% solutions (for 10 mL total liquid, it comprised of 0.1 mL sample, 9.4 mL Mili-Q water, and 0.5 mL 63% HNO3).
X-ray diffraction (XRD; Rigaku, MiniFlex II; tube voltage 30 kV; current 13 mA) identified crystal phases in the solid samples. Thermogravimetric differential thermal analysis (TG–DTA; Rigaku; ThermoPlus Evo DSC 8120) involved raising the temperature to 600°C, and a heating
21
rate was set at 10°C min–1 under atmospheric conditions with an airflow rate of 100 mL min–1. Scanning electron microscopy (SEM; Hitachi SU8000) was used to observe the morphological structure of Al. The specific surface area of Al powder was calculated from Kr adsorption-desorption isotherms (for Al foil) and N2 adsorption-desorption isotherms (for Al powder) by
NOVAtouch instrument (Al powder) and AutosorbiQ instrument (Al foil) to measure the specific surface area of as-received Al materials according to Brunauer-Emmett-Teller/BET multipoint method at Quantrachrome instruments Japan G.K.
The GC analysis aids in determining H2 generation yield over time, and thus reaction rate constant.
It further cooperates with the kinetics of the reaction. Additionally, analysis of XRD, TG-DTA, SEM, and ICP-AES supports a reaction mechanism. Alongside kinetics, the reaction mechanism will employ a predictive model to testify the applicability in an onsite production. The general scheme is shown in Figure 2. 4.
22
2.3 Results and discussions
2.3.1 pH and temperature effect on H
2production
Figure 2. 5 summarizes H2 production results from Al powder in the three different aqueous media
under various pH and temperature conditions (Table 2. 3). The H2 production results in acidic
media were previously reported [41,42] and were presented herein following the unit used in the study. Thepurity of H2 obtained from the reaction using solutions of HCl, H2SO4, and NaOH was
up to 91%, 86%, and 88%, respectively (the impurity might be from N2 that left when it was
flowing prior to reaction). In each case, prolonged exposure of Al powder to the solutions increased the amount of H2. The three different solutions all seem to promote H2 production, and
temperature, as well as pH, greatly influence Al corrosion. The results show the apparent dependence of reaction rate on temperature and pH. The rate of H2 production gradually increased
as the acidity or alkalinity increased, and thus the time to achieve the maximum H2 amount
significantly become shorter. Higher temperatures more promoted corrosion and increased amounts of H2. The pH effect was more pronounced then temperature.
From previous investigations, HCl provides a faster Al corrosion reaction than H2SO4 under
comparable conditions [39,75]. The present research, however, considers both anions, Cl− and SO42−, which are the main anions in natural hot spring water. As a comparative study, Table 2. 4
and Figure 2. 6 present the maximum quantity of H2 individually in this study and several studies
done previously [65,71,72,76–79]. Those studies were selected to employ low hydrothermal and extreme pH conditions. Results in the original manuscript may differ; here are presented and calculated following unit set in our study. In the present work, the highest amount of H2 using
acidic media appeared at pH 1 and 100°C within 2 hours (as for HCl and H2SO4 are 50.02 and
45.06 mmol gAl-1, respectively). A study [72] performed H2 generation by Al alloy and 1 M HCl
solution (pH less than 1), it reported generating about 61.45 mmol H2 g-1 Al at room temperature
23
Table 2. 3 Experimental results for various temperatures and pH values in acidic and alkaline experiments.
Solution Initial pH
Temperature Time Final pH
H2 production Al ion concentration H2 purity
(°C) (h) (mmol gAl-1) (mL gAl-1) (mg L-1)* (mg L-1)** (%) HCl 1.0 100 0.5 1.19 18.19 407.41 221 262 83.02 1.0 100 1 1.52 38.86 870.37 545 560 83.19 1.0 100 1.5 1.44 45.88 1027.78 640 661 89.52 1.0 100 2 1.61 50.02 1120.37 703 720 90.98 1.0 80 1 1.07 11.16 250.00 140 161 72.97 1.0 80 2 1.11 16.53 370.37 200 238 80.00 1.0 80 3 1.27 25.21 564.81 334 363 82.99 1.0 80 6 1.45 37.62 842.59 510 542 83.49 1.0 80 12 1.70 47.54 1064.81 651 685 91.27 1.0 60 1 1.03 4.13 92.59 60 60 58.82 1.0 60 2 1.05 6.61 148.15 98 95 61.54 1.0 60 3 1.06 9.09 203.70 132 131 66.67 1.0 60 6 1.13 14.47 324.07 205 208 67.31 1.0 60 12 1.39 35.55 796.30 544 512 87.76 1.0 60 24 1.55 45.47 1018.52 650 655 90.16 1.0 40 12 1.09 9.09 203.70 111 131 78.57 1.0 40 24 1.17 24.80 555.56 312 357 89.55 1.0 40 48 1.36 39.27 879.63 486 565 90.48 1.5 100 1 1.60 5.79 129.63 72 83 63.64 1.5 100 3 1.87 12.81 287.04 142 185 75.61 1.5 100 6 2.26 16.12 361.11 205 232 78.00 1.5 100 12 2.75 18.60 416.67 230 268 86.54 1.5 100 24 3.01 19.43 435.19 250 280 90.38 1.5 100 48 3.21 20.67 462.96 285 298 90.91
24
Table 2. 3 (continued).
Solution Initial pH
Temperature Time
Final pH H2 production Al ion concentration H2 purity (°C) (h) (mmol gAl-1) (mL gAl-1) (mg L-1)* (mg L-1)** (%) HCl 2.0 100 3 2.09 2.48 55.56 34 36 39.22 2.0 100 6 2.40 3.72 83.33 44 54 64.29 2.0 100 12 2.45 4.13 92.59 55 60 66.67 2.0 100 24 2.56 4.55 101.85 61 65 73.33 2.0 100 48 2.65 4.96 111.11 68 71 85.71 H2SO4 1.0 100 1 1.02 8.27 185.19 103 119 64.52 1.0 100 2 1.15 17.36 388.89 238 250 73.68 1.0 100 3 1.22 28.94 648.15 397 417 82.35 1.0 100 12 1.66 45.06 1009.26 621 649 83.85 1.0 80 1 1.00 4.55 101.85 65 65 61.11 1.0 80 3 1.07 16.53 370.37 221 238 81.63 1.0 80 12 1.42 40.92 916.67 554 589 81.82 1.0 80 24 1.61 42.58 953.70 589 613 82.40 1.0 60 6 1.06 9.92 222.22 149 143 75.00 1.0 60 12 1.15 21.49 481.48 308 310 83.87 1.0 60 24 1.31 35.96 805.56 485 518 84.47 1.0 60 48 1.58 49.60 1111.11 696 714 85.11 1.0 40 12 1.02 3.31 74.07 37 48 72.73 1.0 40 24 1.05 6.61 148.15 91 95 73.39 1.0 40 48 1.13 15.29 342.59 226 220 74.00 1.5 100 1 1.58 3.72 83.33 54 54 45.00 1.5 100 3 1.79 7.03 157.41 136 101 62.96 1.5 100 6 2.01 13.23 296.30 166 190 80.00 1.5 100 12 2.25 16.53 370.37 216 238 81.63
25
Table 2. 3 (continued).
Solution Initial pH Temperature Time Final pH
H2 production Al ion concentration H2 purity
(°C) (h) (mmol gAl-1) (mL gAl-1) (mg L-1)* (mg L-1)** (%) H2SO4 1.5 100 24 3.64 23.56 527.78 318 339 82.61 1.5 100 48 3.86 30.18 675.93 411 435 85.88 2.0 100 3 2.19 2.07 46.30 26 30 41.67 2.0 100 12 3.11 5.37 120.37 76 77 65.00 2.0 100 24 3.29 6.61 148.15 81 95 69.57 2.0 100 48 3.33 7.44 166.67 98 107 78.26 NaOH 11.0 100 12 10.84 0.08 1.85 3.60 1.07 7.58 11.0 100 24 9.85 0.14 3.24 4.00 1.88 8.26 11.0 100 52 9.42 0.27 6.10 4.00 3.53 9.41 11.0 100 72 9.30 0.42 9.32 6.00 5.39 13.43 11.5 100 12.8 10.90 0.63 14.20 14.20 8.21 16.14 11.5 100 24 10.87 0.83 18.70 16.60 10.82 17.16 11.5 100 48 10.71 1.31 29.30 17.90 16.95 18.08 12.0 100 1 11.71 0.15 3.34 15.00 1.93 3.61 12.0 100 3 11.55 0.54 12.04 23.00 6.96 11.32 12.0 100 6 11.56 6.30 141.05 54.00 81.61 25.80 12.0 100 12 11.46 11.61 260.17 111.00 150.53 36.20 12.5 100 1 12.01 0.48 10.86 13.10 6.28 27.83 12.5 100 3 11.97 1.31 29.30 21.20 16.95 13.03 12.5 100 6 11.87 10.66 238.89 149.00 138.21 34.34 12.5 100 12 11.85 16.74 375.00 216.00 216.96 55.04 13.0 100 0.5 12.73 7.29 163.20 99.00 94.42 43.68 13.0 100 1 12.73 14.32 320.83 157.00 185.62 53.41
![Figure 1. 1 Fossil fuel utilization makes up the domination of the current H 2 production methods [26]](https://thumb-ap.123doks.com/thumbv2/123deta/5914009.1050560/19.892.228.658.399.658/figure-fossil-utilization-makes-domination-current-production-methods.webp)
![Figure 1. 2 Distribution of direct geothermal utilization in Japan as of: (a) thermal capacity and (b) utilization by categories according to [33]](https://thumb-ap.123doks.com/thumbv2/123deta/5914009.1050560/22.892.130.767.498.748/figure-distribution-geothermal-utilization-capacity-utilization-categories-according.webp)


![Table 2. 4 Comparative results of H 2 production in the different acidic and alkaline reactions according to relevant studies [65,71,72,76–79]](https://thumb-ap.123doks.com/thumbv2/123deta/5914009.1050560/47.1262.136.1119.154.425/comparative-results-production-different-alkaline-reactions-according-relevant.webp)