JAIST Repository
https://dspace.jaist.ac.jp/
Title 音声による話者及び感情の知覚における時間的手がか
りの寄与に関する研究
Author(s) Zhu, Zhi Citation
Issue Date 2018‑03
Type Thesis or Dissertation Text version ETD
URL http://hdl.handle.net/10119/15319 Rights
Description Supervisor:鵜木 祐史, 情報科学研究科, 博士
Contribution of temporal modulation cues on the perception of speaker individuality and vocal emotion
Zhi Zhu
Japan Advanced Institute of Science and Technology
Doctoral Dissertation
Contribution of temporal modulation cues on the perception of speaker individuality and vocal emotion
Zhi Zhu
Supervisor: Professor Masashi UNOKI
School of Information Science
Japan Advanced Institute of Science and Technology
March 2018
Abstract
The ability of speech communication should be the biggest difference between human and any other animal. Human speech carries not only the language message (linguistic information) but also nonlinguis- tic information such as speaker individuality and vocal emotion. The speaker individuality information can be defined as the information that is used by human to distinguish such a specific speaker from any other person. The vocal emotion information can be defined as the information that is used by human to identify the emotion state of speaker from speech. Both speaker individuality and vocal emotion play an important role in the speech communication of our daily life. Understanding the mechanism of how human can perceive nonlinguistic information from speech should be very important for the clarification of the mechanism of speech perception. However, the perceptual process of speaker individuality and vocal emotion is still not fully clarified at present.
Previous studies about the perception of nonlinguistic information were always based on the source- filter theory from the viewpoint of speech production. The basic reason is that nonlinguistic information can be thought to be derived from human vocal organs. The contributions of typical acoustic features conveyed in speech, such as F0, spectral envelope, intensity, and speech rates, were investigated. However, it was found that such typical acoustic features have difficulty to account for the human response from cochlear-implant (CI) listeners. A probable reason is that, for CI listeners, the temporal modulation cues provided by the temporal envelope are used as primary cues, however, the typical acoustic features can not represent the features of the temporal envelope well. The temporal modulation cues provided by the temporal envelope are also considered to be important for perceiving nonlinguistic information.
Why the temporal modulation cues provided by temporal envelope of speech should be important and needed to be clarified. At first, from the viewpoint of auditory, temporal envelope plays an important role in human auditory system. The signal processing in peripheral auditory system can be roughly modeled as band-pass filtering (auditory filterbank) and envelope extracting (inner-hair cell model). The sound signal is first divided into several narrow band signals by auditory filterbank. Then the temporal envelope of each band is extracted as the mechanism of inner hair cells. Furthermore, it is suggested that human auditory system carries out a kind of modulation frequency analysis on the temporal envelope that can be modeled as a modulation filterbank. The auditory system should analysis the modulation frequency components at the early stage close to the periphery. Therefore, the temporal modulation cues provided by temporal envelope may contribute the perception of nonlinguistic information.
For speech perception, the temporal envelope has also been proved to be an important cue in the perception of linguistic information. Studies using noise-vocoded speech (NVS) demonstrated that human can perceive linguistic information with using the temporal envelope as a primary cue. NVS can be generated by dividing speech signal into several narrow bands and replacing the carriers in each narrow band with band-limited noise. The spectral cues provided will be poorer and poorer with less number of channels. It is shown that NVS with only four bands is sufficient to achieve good vowel, consonant, and sentence recognition. Furthermore, previous studies also showed that the low modulation frequency components of temporal envelope should contribute to the perception of linguistic information. If the temporal modulation cues are so that important to speech perception, they should also contribute to the perception of nonlinguistic information.
temporal envelope information as a primary cue, however, the temporal fine structure information is not effectively encoded. As the poor spectral cue, CI listeners have problem with identifying the speaker or the emotion from only speech. It is necessary to clarify the contribution of temporal modulation cues on the perception of nonlinguistic information to optimize the CI device and improve the performance of speaker and vocal-emotion recognition of CI listeners and also for the clarification of the perceptual process of nonlinguistic information. Furthermore, the clarification of the contribution of temporal modulation cues to the perception of speaker individuality and vocal emotion will also deepen our understanding of the temporal modulation information and speech perception. To clarify the contribution of temporal mod- ulation cues, an analysis method purely based on the modulation frequency analysis mechanism of the auditory system is necessary.
The ultimate research goal of the present study is to clarify the contribution of temporal modulation cues to the perception of speaker individuality and vocal emotion. To reach that goal, at first, the role of temporal envelope and modulation frequency information in speaker and vocal emotion recognition was investigated to confirm whether temporal modulation cues actually contribute to the perception of speaker individuality and vocal emotion. Speaker and vocal-emotion recognition experiments using NVS were carried out to investigate the effects of different temporal and spectral resolutions of NVS on the perception of speaker individuality and vocal-emotion. The spectral and temporal modulation cues will be reduced when the spectral and temporal resolution decrease.
For spectral cue, the speaker distinction performance was not sensitive to the spectral resolution, at least in the limited set of stimuli in the present study. For vocal-emotion recognition, the spectral resolution was important for the recognition of only neutral, joy, and cold anger NVS, but not sadness or hot anger NVS. For temporal modulation cues, the results showed that the recognition rates were significantly decreased with lower upper limit of modulation frequency for both speaker and vocal emotion.
In the other word, it was more difficult to recognize the speaker or vocal emotion from NVS if the temporal modulation cues provided were reduced. Therefore, it was confirmed that the temporal modulation cues contribute to the perception of speaker individuality and vocal emotion. Compared to the perception of linguistic information, the temporal modulation cues provided by higher modulation frequency bands are suggested to be important for the perception of speaker individuality and vocal emotion.
At the next step, the relationship between the modulation spectral features and the perceptual data obtained from speaker and vocal-emotion recognition experiments was analyzed to clarify the exactly con- tribution of temporal modulation cues on the perception of speaker individuality and vocal-emotion. The modulation spectral features were extracted from the modulation spectrogram of speech data. The mod- ulation spectrogram was calculated by the process of auditory filterbank, temporal envelope extraction and modulation filterbank. The correlation between the discriminability index of modulation spectral features and the perceptual data was calculated to demonstrate the relationship between modulation spectral features and the perception of speaker individuality and vocal-emotion.
For speaker individuality, there were positive correlations between the modulation spectral features and the perceptual data of speaker distinction experiment. For vocal emotion, similar results were also obtained, however, the correlations were roughly higher than that of speaker distinction experiments. The
showed that the vocal-emotion recognition paradigm using NVS can be used to investigate vocal emotion recognition by CI listeners. Furthermore, it was also suggested that the modulation spectral features can also be used to account the performance of CI listeners in the vocal-emotion recognition.
Effect of the modification of modulation spectrogram on the vocal-emotion recognition was then investigated. A method based on a linear prediction (LP) scheme was proposed to modify the modulation spectrogram and its features of neutral speech to match that of emotional speech. The temporal envelopes were modulation-filtered by using IIR filters to modify the modulation spectrum from neutral to emotional speech. The IIR filters were derived from the relation of modulation characteristics of neutral and vocal emotions on a LP scheme. On the acoustic frequency domain, the average amplitude of the temporal envelope was corrected using the ratio of the average amplitude between neutral and emotional speech.
Finally, a vocal-emotion recognition experiment using NVS generated by the converted temporal envelope was carried out. The results showed that the modulation spectrogram of neutral speech can be successfully converted to that of emotional speech by the proposed method. The results of the evaluation experiment confirmed the feasibility of vocal emotion conversion on the modulation spectrogram for NVS.
In conclusion, the fact that the temporal modulation cues contribute to the perception of speaker individuality and vocal emotion was confirmed by the speaker and vocal-emotion recognition experiments using NVS. Furthermore, the investigation of modulation spectral features demonstrated that there were high correlations between modulation spectral features and the perceptual data obtained from speaker and vocal-emotion recognition experiments. Therefore, the modulation spectral features could be important cues contribute to the speaker and vocal-emotion recognition with NVS. These results further proved that the temporal modulation cues play an important role in the perception speaker individuality and vocal-emotion.
Keywords: Speech perception, speaker individuality, vocal emotion, temporal cue, noise-vocoded speech, modulation spectral feature
Acknowledgments
First and foremost, I would like to express my deepest appreciation to my supervisor, Professor UNOKI Masashi, for his tremendous guidance and support. I feel very lucky to have him to be the supervisor of my master and PhD study. Without his invaluable guid- ance, motivation, and great care, my research work would never be successful. Studying with him over these years was a wonderful experience that I would never forget.
I would like to acknowledge my vice supervisor, Professor AKAGI Masato, for his invalu- able suggestions and comments in my research. The discussions with Professor AKAGI make my research progress continuously. My sincerest gratitude goes to Professor DANG Jianwu, for his may insightful discussions and invaluable guidance for this thesis and my research like.
I would also like to express my sincere thanks to Doctor FURUKAWA Shigeto, for his invaluable guidance and many insightful discussions that directly contributed to this the- sis. I would like to acknowledge Professor ARAKI Yukiko, for her great suggestions an comments for the thesis. I would like to acknowledge Professor KITAMURA Tatsuya, for his valuable data of perceptual speaker similarity.
Most importantly, I am forever indebted to my mother and father. I am profoundly indebted to my wife, CHENG Yu, for her unconditional support and encouragement.
I dedicate this thesis to my parents and my wife, for their unfailing love, support and patience.
Table of Contents
Abstract i
Acknowledgments iv
Table of Contents v
List of Figures viii
List of Tables xiii
Acronym and Abbreviation xvi
1 General introduction 1
1.1 Introduction . . . 1
1.2 Motivation . . . 3
1.2.1 The contribution of temporal cue to speech perception . . . 3
1.2.2 Perception of nonlinguistic information by cochlear implant listeners 4 1.3 Research goal . . . 5
1.4 Outline of thesis . . . 6
2 Research background 10 2.1 Introduction . . . 10
2.2 The perception of nonlinguistic information . . . 10
2.2.1 Speaker individuality . . . 10
2.2.2 Vocal emotion . . . 12
2.3 The perception of temporal envelope . . . 13
2.3.2 Contribution of temporal modulation cues on the perception of lin-
guistic information . . . 14
2.4 The research approach of this study . . . 15
3 The role of temporal modulation cues on the perception of speaker individuality and vocal emotion 18 3.1 Introduction . . . 18
3.2 Signal Processing: Noise-Vocoded Speech . . . 19
3.3 speaker distinction experiment using noise-vocoded speech with different temporal resolution . . . 29
3.3.1 Speech Data . . . 29
3.3.2 Participants and Procedure . . . 29
3.3.3 Results . . . 31
3.3.4 Discussion . . . 33
3.4 Vocal emotion recognition experiment using noise-vocoded speech with dif- ferent temporal resolution . . . 37
3.4.1 Speech Data . . . 37
3.4.2 Participants and Procedure . . . 37
3.4.3 Results . . . 37
3.4.4 Discussion . . . 45
3.5 General discussion . . . 50
3.6 Summary . . . 51
4 Contributions of modulation spectral features on the perception of speaker individuality and vocal emotion 52 4.1 Introduction . . . 52
4.2 Method to analysis modulation spectral features . . . 53
4.3.2 Speaker distinction experiment using NVS . . . 63
4.3.3 The correlation between the perceptual data and modulation spec- tral features . . . 67
4.4 Modulation spectral features related to the perception of vocal emotion . . 69
4.4.1 The perceptual data of vocal-emotion recognition experiment . . . . 69
4.4.2 The modulation spectrogram of vocal-emotion speech . . . 71
4.4.3 The correlation between the perceptual data and modulation spec- tral features . . . 77
4.4.4 Discussion . . . 82
4.5 General discussion . . . 83
4.6 Summary . . . 84
5 Discussion of the application of temporal modulation information 85 5.1 Feasibility of using noise-vocoded speech to simulate cochlear implant lis- teners’ response in vocal emotion recognition . . . 86
5.1.1 Intoduction . . . 86
5.1.2 Method . . . 87
5.1.3 Results . . . 88
5.1.4 Discussion . . . 92
5.1.5 Summary . . . 93
5.2 Effect of the modification of modulation spectrogram on the vocal-emotion recognition with noise-vocoded speech . . . 96
5.2.1 Introduction . . . 96
5.2.2 Vocal-emotion conversion on modulation spectrogram . . . 97
5.2.3 Vocal emotion conversion based on LP scheme . . . 100
5.2.4 Evaluation experiment . . . 106
5.2.5 Summary . . . 108
6 Conclusion 109 6.1 Summary . . . 109
6.2 Contributions . . . 112
6.3 Future works . . . 113
Appendices 116 A Confusion matrix of the results of vocal-emotion recognition experi-
ments 117
B Scatterplots of perceptual speaker similarity and the d’ of MSFs 125 C Scatterplots of the d’ of MSFs and the results of speaker distinction
experiments 130
D Scatterplots of the d’ of MSFs and the results of vocal-emotion recog-
nition experiments 135
Bibliography 135
Publications 151
List of Figures
1.1 Organization of this dissertation. . . 9 2.1 The research approach of this study. . . 17 3.1 Schematic diagram of noise-vocoder method used to generate stimuli (BPF:
band-pass filter; LPF: low-pass filter; and NBN: narrow-band noise). . . 20 3.2 Frequency response of the ERBN-number based 16-band band-pass filterbank. 22 3.3 Frequency response of the ERBN-number based 8-band band-pass filterbank. 23 3.4 Frequency response of the ERBN-number based 4-band band-pass filterbank. 24 3.5 Spectrogram of original speech. . . 26 3.6 Spectrogram of the 16-band NVS and the upper limit of modulation fre-
quency is 64 Hz. . . 27 3.7 Spectrogram of the 4-band NVS and the upper limit of modulation fre-
quency is 4 Hz. . . 28 3.8 The experiment environment. . . 31 3.9 speaker distinction rates in all 27 NVS conditions and original speech con-
dition. Error bars indicate ±1 standard error of mean. . . 32 3.10 Speaker distinction rates in each condition of number of channels and their
sigmoid fitting lines for 4-band NVS. Coefficients (95 % confidence interval):
a = 23.84 (0.0342, 47.65), b = -0.8913 (-2.873, 1.091), c = 4.862 (2.509, 7.215), d = 58.59 (44.04, 73.14). Coefficient of determinations: R2 = 0.86. . 34 3.11 Speaker distinction rates in each condition of number of channels and their
sigmoid fitting lines for 8-band NVS. Coefficients (95 % confidence interval):
a = 20.3 (13.99, 26.61), b = -1.914 (-4.204, 0.3764), c = 4.163 (3.472, 4.854), d = 61.79 (57, 66.58). Coefficient of determinations: R2 = 0.96. . . 35
3.12 Speaker distinction rates in each condition of number of channels and their sigmoid fitting lines for 16-band NVS. Coefficients (95 % confidence inter- val): a = 23.02 (10.46, 35.58), b = -1.163 (-2.792, 0.4665), c = 4.054 (2.748, 5.359), d = 60.91 (51.28, 70.55) Coefficient of determinations: R2 = 0.93. . 36 3.13 Vocal-emotion recognition rates in all 27 NVS conditions and original speech
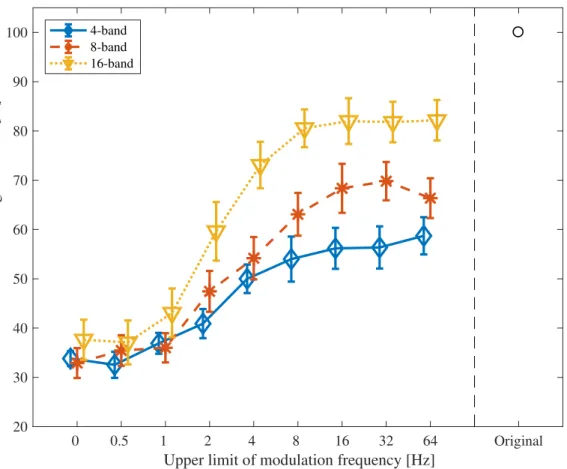
condition. Error bars indicate±1 standard error of mean. . . 39 3.14 Vocal-emotion recognition rates of neutral speech. Error bars indicate ±1
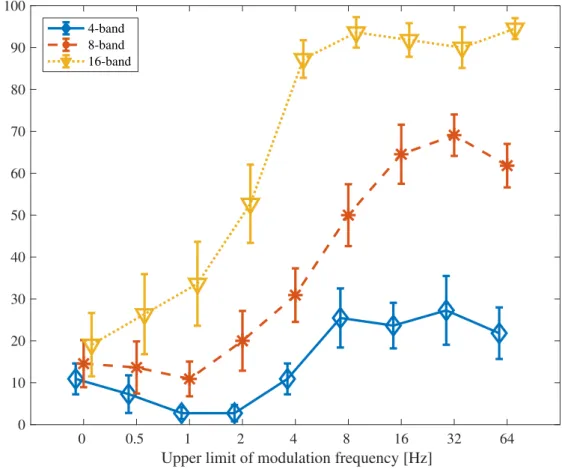
standard error of mean. . . 40 3.15 Vocal-emotion recognition rates of joy speech. Error bars indicate±1 stan-
dard error of mean. . . 41 3.16 Vocal-emotion recognition rates of cold anger speech. Error bars indicate
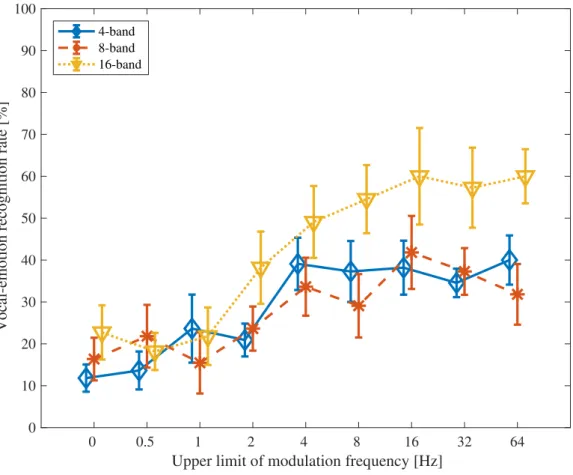
±1 standard error of mean. . . 42 3.17 Vocal-emotion recognition rates of sadness speech. Error bars indicate ±1
standard error of mean. . . 43 3.18 Vocal-emotion recognition rates of hot anger speech. Error bars indicate
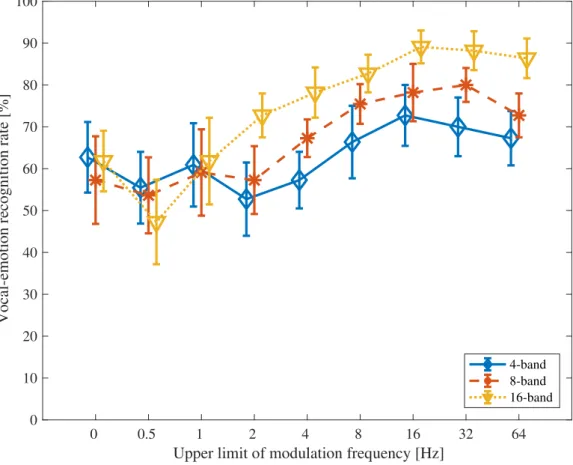
±1 standard error of mean. . . 44 3.19 Vocal-emotion recognition rates in each condition of number of channels
and their sigmoid fitting lines for 4-band NVS. Coefficients (95 % confidence interval): a = 24.78 (28.68, 20.89), b = -1.266 (-1.839, 0.6936), c = 4.461 (4.076, 4.845), d = 57.52 (55.44, 59.6). Coefficient of determinations: R2 = 0.9880. . . 47 3.20 Vocal-emotion rates in each condition of number of channels and their
sigmoid fitting lines for 8-band NVS. Coefficients (95 % confidence interval):
a = 36.28 (28.76, 43.8), b = -1.163 (-1.815, -0.5106), c = 4.52 (4.012, 5.028), d = 32.57 (27.33, 37.82). Coefficient of determinations: R2 = 0.9886. . . . 48 3.21 Vocal-emotion recognition rates in each condition of number of channels
4.1 Schematic diagram of noise-vocoder method used to generate stimuli (BPF:
band-pass filter; LPF: low-pass filter; and NBN: narrow-band noise). . . 55 4.2 Frequency response of the modulation filterbank. . . 56 4.3 The correlation coefficients between the d’ of modulation spectral features
and the perceptual speaker similarity for female and male speaker pairs. . . 61 4.4 The correlation coefficients between the d’ of modulation spectral features. 62 4.5 Results of speaker distinction rate for female speaker pairs. . . 65 4.6 Results of speaker distinction rate for male speaker pairs. . . 66 4.7 The correlation coefficients between the d’ of modulation spectral features
and the perceptual data for all speakers. . . 68 4.8 The results of vocal-emotion recognition experiment on the condition that
the upper limit of modulation frequency was 64 Hz. . . 70 4.9 The time averaged modulation spectrogram of a neutral speech data with
16-bands. . . 72 4.10 The time averaged modulation spectrogram of a joy speech data with 16-
bands. . . 73 4.11 The time averaged modulation spectrogram of a cold anger speech data
with 16-bands. . . 74 4.12 The time averaged modulation spectrogram of a sadness speech data with
16-bands. . . 75 4.13 The time averaged modulation spectrogram of a hot anger speech data with
16-bands. . . 76 4.14 The correlation coefficients between modulation spectral features and the
perceptual data of vocal-emotion recognition experiments. . . 78 4.15 The correlation coefficients between the d’ of 4-band modulation spectral
features of emotional speech. . . 79 4.16 The correlation coefficients between the d’ of 8-band modulation spectral
features of emotional speech. . . 80 4.17 The correlation coefficients between the d’ of 16-band modulation spectral
features of emotional speech. . . 81
5.2 The results of vocal-emotion recognition experiment for CI listeners. . . 90 5.3 The average vocal-emotion recognition rate for each CI listener. . . 94 5.4 The averaged vocal-emotion recognition rates of NH and CI listeners. . . . 95 5.5 Scheme of LP based vocal emotion conversion method. . . 99 5.6 Modulation spectrum of neutral, hot anger, and NE-HA converted speech
on 3rd band and frequency characteristic of LP based conversion filter. . . 102 5.7 Modulation spectrograms of (a) neutral, (b) joy, and (c) neutral-joy con-
verted speech. . . 103 5.8 Modulation spectrograms of (a) neutral, (b) sadness, and (c) neutral-
sadness converted speech. . . 104 5.9 Modulation spectrograms of (a) neutral, (b) hot anger, and (c) neutral-hot
anger converted speech. . . 105 5.10 Results of vocal-emotion recognition experiment. . . 107 B.1 The scatterplot of perceptual speaker similarity and d’ of modulation spec-
tral features on acoustic frequency domain for female speakers. . . 126 B.2 The scatterplot of perceptual speaker similarity and d’ of modulation spec-
tral features on modulation frequency domain for female speakers. . . 127 B.3 The scatterplot of perceptual speaker similarity and d’ of modulation spec-
tral features on acoustic frequency domain for male speakers. . . 128 B.4 The scatterplot of perceptual speaker similarity and d’ of modulation spec-
tral features on modulation frequency domain for male speakers. . . 129 C.1 The scatterplot of the d’ of the perceptual data of speaker distinction ex-
periment and modulation spectral features on acoustic frequency domain for for 8-band NVS. . . 131 C.2 The scatterplot of the d’ of the perceptual data of speaker distinction exper-
C.4 The scatterplot of the d’ of the perceptual data of speaker distinction exper- iment and modulation spectral features on modulation frequency domain for for 16-band NVS. . . 134 D.1 The scatterplot of the d’ of the perceptual data of vocal-emotion recognition
experiment and modulation spectral features on acoustic frequency domain for for 4-band NVS. . . 136 D.2 The scatterplot of the d’ of the perceptual data of vocal-emotion recogni-
tion experiment and modulation spectral features on modulation frequency domain for for 4-band NVS. . . 137 D.3 The scatterplot of the d’ of the perceptual data of vocal-emotion recognition
experiment and modulation spectral features on acoustic frequency domain for for 8-band NVS. . . 138 D.4 The scatterplot of the d’ of the perceptual data of vocal-emotion recogni-
tion experiment and modulation spectral features on modulation frequency domain for for 8-band NVS. . . 139 D.5 The scatterplot of the d’ of the perceptual data of vocal-emotion recognition
experiment and modulation spectral features on acoustic frequency domain for for 16-band NVS. . . 140 D.6 The scatterplot of the d’ of the perceptual data of vocal-emotion recogni-
tion experiment and modulation spectral features on modulation frequency domain for for 16-band NVS. . . 141
List of Tables
3.1 The boundary frequencies of the band-pass filters in Hz and ERBN-number. 21 3.2 Speaker pairs selected from ATR database and their average similarity
index measured by Kitamura et al. [1]. Left and right halves show female and male speaker pairs, respectively. . . 30 4.1 Speaker pairs selected from ATR database and their average similarity
index measured by Kitamura et al. [1]. Left and right halves show female and male speaker pairs, respectively. . . 63 4.2 The d values of perceptual data for female speakers. . . 67 4.3 The d values of perceptual data for male speakers. . . 67 4.4 The d values of the perceptual data on the condition that the upper limit
of modulation frequency was 64 Hz. . . 69 5.1 Detailed information about the CI listeners, Mean ATH is the mean abso-
lute threshold of hearing of the ear using CI. . . 88 5.2 Mean confusion matrix with 8-band NVS stimuli for CI listeners. . . 91 5.3 Mean confusion matrix with 16-band NVS stimuli for CI listeners. . . 91 5.4 Mean confusion matrix with original emotional speech for CI listeners. . . . 91 5.5 Mean confusion matrix with 8-band NVS stimuli for NH listeners. . . 92 5.6 Mean confusion matrix with 16-band NVS stimuli for NH listeners. . . 92
A.6 Mean confusion matrix with 4-band, 8 Hz NVS stimuli. . . 119
A.7 Mean confusion matrix with 4-band, 16 Hz NVS stimuli. . . 119
A.8 Mean confusion matrix with 4-band, 32 Hz NVS stimuli. . . 119
A.9 Mean confusion matrix with 4-band, 64 Hz NVS stimuli. . . 120
A.10 Mean confusion matrix with 8-band, 0 Hz NVS stimuli. . . 120
A.11 Mean confusion matrix with 8-band, 0.5 Hz NVS stimuli. . . 120
A.12 Mean confusion matrix with 8-band, 1 Hz NVS stimuli. . . 120
A.13 Mean confusion matrix with 8-band, 2 Hz NVS stimuli. . . 121
A.14 Mean confusion matrix with 8-band, 4 Hz NVS stimuli. . . 121
A.15 Mean confusion matrix with 8-band, 8 Hz NVS stimuli. . . 121
A.16 Mean confusion matrix with 8-band, 16 Hz NVS stimuli. . . 121
A.17 Mean confusion matrix with 8-band, 32 Hz NVS stimuli. . . 122
A.18 Mean confusion matrix with 8-band, 64 Hz NVS stimuli. . . 122
A.19 Mean confusion matrix with 16-band, 0 Hz NVS stimuli. . . 122
A.20 Mean confusion matrix with 16-band, 0.5 Hz NVS stimuli. . . 122
A.21 Mean confusion matrix with 16-band, 1 Hz NVS stimuli. . . 123
A.22 Mean confusion matrix with 16-band, 2 Hz NVS stimuli. . . 123
A.23 Mean confusion matrix with 16-band, 4 Hz NVS stimuli. . . 123
A.24 Mean confusion matrix with 16-band, 8 Hz NVS stimuli. . . 123
A.25 Mean confusion matrix with 16-band, 16 Hz NVS stimuli. . . 124
A.26 Mean confusion matrix with 16-band, 32 Hz NVS stimuli. . . 124
A.27 Mean confusion matrix with 16-band, 64 Hz NVS stimuli. . . 124
Acronym and Abbreviation
CI Cochlear Implant
NH Normal Hearing
NVS Noise–Vocoded Speech
ERBN Equivalent Rectangular Bandwidth MSF Modulation Spectral Feature MSCR Modulation Spectral Centroid MSSP Modulation Spectral Spread MSSK Modulation Spectral Skewness MSKT Modulation Spectral Kurtosis MSFT Modulation Spectral Flatness MSTL Modulation Spectral Tilt LP Linear Prediction
CC Correlation Coefficient
Chapter 1
General introduction
1.1 Introduction
The biggest difference between human and any other animal is that human can commu- nicate through speech. One famous test to judge artificial intelligence’s (AI) ability to exhibit intelligent behavior equivalent to human is so called Turing test. Turing thought that a perfect AI should be indistinguishable from a human in natural language conver- sation with text. Furthermore, I think the final goal of AI should be the ability of speech communication, because speech carries much more information than the language mes- sage. For this goal, we must understand how human can perceive the various information contained in speech at first.
From the viewpoint of information generation, Fujisaki divided the information con- tained in speech signal with 3 different categories [2]. Those are linguistic information, paralinguistic information and non-linguistic information.
• Linguistic information: the symbolic information that is represented by a set of discrete symbols and rules for their combination.
• Paralinguistic information: the information that is not inferable from the written counterpart but is deliberately added by the speaker to modify or supplement the linguistic information.
• Nonlinguistic information: the other information such like factors as the age,
As Fujisaki’s definition, the linguistic information is the language message that the speaker wants to convey. The paralinguistic information contains the intentions, attitudes, and speaking styles of the speaker which should be under the control of the speaker and attached to the language message. The two largest categories in nonlinguistic informa- tion should be speaker individuality and vocal emotion. The speaker individuality information can be defined as the information that is used by listener to distinguish such a specific speaker from other people. The vocal emotion information is defined as the information that is used by human to identify the emotion state of speaker from speech.
Speaker individuality and vocal emotion play important roles in the speech communica- tion of our daily life. However, the perception process of speaker individuality and vocal emotion is still not fully clarified at present.
Previous studies about the perception of nonlinguistic information were based on the source-filter theory from the viewpoint of speech production. Obviously, the basic reason is that nonlinguistic information is thought to be derived from human vocal organs. For speaker individuality, the F0 contour, spectral envelope, and the formants of speech have been proved to contribute speaker recognition [3–6]. For vocal emotion, previous works also focused on the acoustic features conveyed in speech, such as F0, spectral envelope, intensity, and speech rate [7–9]. For both speaker individuality and vocal emotion, the time-averaged acoustic features were investigated sufficiently. However, the temporal modulation cues provided by the dynamic components of speech are also considered to be important for perceiving nonlinguistic information.
From the viewpoint of auditory perception, the temporal modulation cues provided by the temporal envelope is very important. The signal processing in peripheral auditory system can be roughly modeled as band-pass filtering (auditory filterbank) and envelope extracting (inner-hair cell model) [10, 11]. The sound signal is first divided into several narrow band signals by auditory filterbank. Then the temporal envelope of each band is
The auditory system should analysis the modulation frequency components at the early stage close to the periphery. Therefore, the temporal modulation cues provided by temporal envelope may contribute the perception of nonlinguistic information. To clarify the perceptual process of nonlinguistic information, it is necessary to clarify the contribution of temporal cues. The importance to clarify the contribution of temporal modulation cues on the perception of nonlinguistic information will be described in the next section.
1.2 Motivation
1.2.1 The contribution of temporal cue to speech perception
The importance of temporal modulation cues in the perception of linguistic information has been studied by many researchers. The temporal envelope of speech has been proved to be an important cue for speech perception from the studies using noise-vocoded speech (NVS) [13–16]. NVS is generated by replacing the temporal fine structure of the sub- band of speech with band-limited noise, so the spectral cue is reduced dramatically and the temporal modulation cues are preserved [17]. Shannon et al. showed that NVS with only four bands is sufficient to achieve good vowel, consonant, and sentence recognition [13]. Therefore, human can successfully perceive linguistic information using the temporal envelope of speech as a primary cue.
Drullman et al. investigated the important modulation frequency bands for speech perception by low- and high-pass filtering the temporal envelope of speech [18, 19]. They showed that the modulation frequency bands from 4 to 16 Hz contained important cues related to linguistic information. Xu et al. attempted to elucidate the importance of temporal envelope for phoneme recognition using NVS [20]. The spectral resolution was manipulated by varying the number of channels of NVS and the temporal resolution was manipulated by varying the lowpass cutoff frequencies used to extract the temporal envelope. The results showed that vowel recognition plateaued at the 4 Hz upper limit of modulation frequency. Tachibana et al. used a similar experimental paradigm and demonstrated that the modulation frequency components below 8 Hz is important for
Rosen developed a framework for describing the acoustic structure of speech based on temporal aspects [21]. From Rosen’s viewpoint, speech signal can be comprised of three main temporal features: envelope, periodicity, and fine-structure. The envelope cues contain the modulation frequency band between about 2 and 50 Hz. This low modulation frequency band should include the information about variations of intensity, duration, attach, decay, and segmental cues of speech. From the previous studies described above, it has been proved that such temporal modulation cues are very important for the perception of linguistic information. Therefore, temporal modulation cues also have potential to be important cues in the perception of nonlinguistic information. To understand the perceptual process in human auditory system, the contribution of temporal modulation cues in the perception of nonlinguistic information must be clarified.
1.2.2 Perception of nonlinguistic information by cochlear im- plant listeners
As CI listeners using the temporal envelope as a primary cue, it is very important to clarify the contributions of temporal modulation cues on the perception of nonlinguistic information. CI system mimic the signal processing of the auditory peripheral system with four main steps: bandpass filterbank, envelope extraction, amplitude compression, and impulse signal generation [22]. As the number of channels of the bandpass filterbank in CI system is so limited, CI device can only provide poor spectral cue. CI devices provide the temporal envelope as a primary cue, and the temporal fine structure information is not effectively encoded. NVS was usually used as a CI simulation with normal-hearing (NH) listeners to predict the response of CI listeners. As the poor spectral cue, CI listeners have problem with identifying the speaker or the emotion of speaker from only speech.
Vongphoe and Zeng evaluated whether the temporal envelope is sufficient to support
showed that training results in improved recognition rates of speaker in CI simulations [25].
Moreover, child CI listeners succeeded in differentiating their mothers’ utterances from those of other people [26]. CI listeners’ differentiation of speakers was facilitated by long- term familiarity, which suggested that temporal modulation cues have the potential to effectively support CI listeners to distinguish speakers.
It has also been known that CI listeners’ performances of vocal-emotion recognition are poorer than NH listeners, as the poor spectral cues provided by CI device [23, 24, 27, 28]. Luo et al. showed that vocal-emotion recognition of NH listeners using NVS was significantly improved as the cut-off frequency of modulation low-pass filter was increased from 50 to 500 Hz [28]. The modulation frequency bands between 50 and 500 Hz mainly included the periodic information related to F0 [21]. However, the contribution of the temporal modulation cues defined as the modulation frequency band below 50 Hz is still unknown. By comparing the performances of vocal-emotion recognition by CI listeners and HN listeners using NVS, Chatterjeeet al.[27] found that the mean performance of CI listeners was similar to that of NH listeners with 8-band NVS. They then analyzed the F0, intensity, and duration of stimuli. However, it was found that the acoustic analyses could not account for all of the perceptual data of the vocal-emotion recognition experiment with NVS.
As the CI device provide the temporal envelope as a primary cue, it is necessary to clarify the contribution of temporal cues in the perception of nonlinguistic information to optimize the CI device and improve the performance of speaker and vocal-emotion recognition of CI listeners. It seems like it is difficult to account for the perceptual data of experiments using NVS with traditional acoustic features such like F0, duration, and intensity. Acoustic analysis based purely on the temporal features may be useful, because the temporal envelope is used as a primary cue in the perception of NVS.
1.3 Research goal
Previous studies related to human auditory system showed that the temporal modulation information plays an important role. The auditory system should carry out an modulation frequency analysis at the early stage close to the periphery. The temporal modulation
From the previous studies about speech perception, it has been proved that temporal modulation cues are important for the perception of linguistic information. Therefore, temporal modulation cues also have potential to be important cues in the perception of nonlinguistic information. As the CI device provide the temporal envelope as a primary cue, discussing the contribution of temporal modulation cues in the perception of non- linguistic information is also important for optimizing the CI device and improving the performance of speaker and vocal-emotion recognition of CI listeners.
The ultimate research goal of the present study is to clarify the contribution of tempo- ral modulation cue to the perception of speaker individuality and vocal-emotion. To reach that goal, at first, the role of temporal envelope and modulation frequency components in the perception of speaker individuality and vocal-emotion is investigated to confirm that whether the temporal modulation cues contribute speaker and vocal-emotion recognition..
Then, to clarify the exact contribution of temporal modulation cues in the perception of speaker individuality and vocal-emotion, the modulation spectral features of speech are analyzed to account for the perceptual data obtained from the speaker and vocal-emotion recognition experiments using NVS.
In addition, applications of the temporal modulation information in simulating CI listeners’ response and vocal-emotion conversion of NVS are discussed. In this work, the contribution of temporal modulation cues on the perception of speaker individuality and vocal-emotion are discussed together to indicate the difference in the perception of linguistic information and nonlinguistic information and to clarify the common roles of temporal modulation cue in the perception of nonlinguistic information.
1.4 Outline of thesis
The rest of this dissertation consists of five chapters and is organized as follows. Figure
of linguistic information are reviewed to expound the importance of temporal modulation in both psychoacoustic and speech perception.
Chapter 3 purpose to clarify the role of temporal modulation cue in speaker and vocal-emotion recognition. Speaker and vocal-emotion recognition experiments are carried out to confirm whether the temporal modulation cues provided by the temporal envelope of speech contribute to the perception of speaker individuality and vocal emotion. In the experiments, speaker distinction and vocal emotion recognition are conducted by NH listeners under different upper limit of modulation frequency and the number of channels of NVS stimuli. The spectral and temporal modulation cues will be further reduced when the number of channels and upper limit of modulation frequency decrease, respectively. The experimental paradigm used in this experiment can also clarify the important modulation frequency bands for speaker and vocal-emotion recognition.
Chapter 4 describe the relationship between modulation spectral features and the perceptual data obtained in the speaker and vocal-emotion recognition experiments to clarify the exact contribution of temporal modulation cues on the perception of speaker individuality and vocal-emotion. An auditory-based method is used to calculate the modulation spectrogram of speech and the modulation spectral features are extracted from the modulation spectrogram. The correlation between the modulation spectral features and the perceptual data is then analyzed to discuss whether the modulation spectral features will contribute to speaker or vocal emotion recognition. In order to investigate the relationship between modulation spectral features and the perceptual data of speaker and vocal-emotion experiments, an discriminability index d’ is used. The d’ of each modulation spectral feature present the physical distance of the distributions of modulation spectral feature with different speaker or vocal-emotion and the d’ of the perceptual data present the psychological distance of different speaker or vocal-emotion. The correlation between the d’ values of modulation spectral features and the perceptual data is calculated to demonstrate the relationship between modulation spectral features and the perception of speaker individuality and vocal-emotion.
Chapter 5 discusses the applications of the temporal modulation information in sim- ulating CI listeners’ response and vocal-emotion conversion of NVS. The feasibility of using NVS to simulate CI listener’s response in vocal emotion recognition is discussed by
carried out vocal-emotion recognition experiments using both NVS and original emotional speech with NH and CI listeners. Effect of the modification of modulation spectrogram on the vocal-emotion recognition is then investigated. A method based on a linear pre- diction (LP) scheme is proposed to modify the modulation spectrogram and its features of neutral speech to match that of emotional speech.
Chapter 6 summarizes this study and emphasizes its contributions to this research field as well as other research fields. Furthermore, future works about deepening the understanding of the perceptual process of speech, development of CI device and other research field are introduced.
Chapter 1 General Introduction
Chapter 2 Research Background Perception of
nonlinguistic information
Perception of
temporal modulation information Research approach of this study
Chapter 3
The role of temporal modulation cues on the perception of speaker individuality and vocal emotion
Speaker recognition experiment with NVS
Vocal-emotion recognition experiment with NVS
Chapter 4
Contribution of modulation spectral features on the perception of speaker individuality and vocal emotion
Modulation spectral features related to speaker individuality
Modulation spectral features related to vocal emotion
Chapter 5
Discussion of the application of temporal modulation information Feasibility of using NVS to
simulate CI listeners’ response in vocal emotion recognition
Effect of the modification of modulation spectrogram on the
vocal emotion recognition
Chapter 6 Conclusion
Figure 1.1: Organization of this dissertation.
Chapter 2
Research background
2.1 Introduction
In this chapter, the background knowledge and previous studies about nonlinguistic in- formation and the perception of temporal envelope are introduced. At first, the previous studies of speaker individuality and vocal emotion and the approach they used are re- viewed. Then the previous studies about the importance of temporal envelope in human auditory system and the perception of linguistic information are reviewed to expound the contribution of temporal modulation cues in both psychoacoustic and speech perception.
Finally, the background knowledge and previous studies are summarized and the research approach used in this study is explained.
2.2 The perception of nonlinguistic information
2.2.1 Speaker individuality
Speaker individuality can be divided into two categories that are inherent and acquired
and both inherent and acquired features are included in based on this definition.
Previous studies about the perception of speaker individuality almost based on the source-filter theory [29] from the concept of speech production. The source-filter theory consider the vocal fold as a sound source and the vocal tract as a kind of linear filter.
Based on this theory, previous studies investigated the features related to vocal fold source (F0, etc.) and vocal tract filter (spectral envelope, formant, etc.) related to speaker individuality.
Numerous acoustic features related to the perception of speaker individuality were investigated so far. Ito et al. reported that the acoustic parameters affecting the per- ception of speaker individuality are important in the order of spectral envelope, F0, and the dynamic features of speaking style (tempo, etc.) [30], and the features about spectral envelope are especially important. Hashimotoet al. analysis the contributions of acoustic features (F0, spectrum, and duration) affecting speaker identification quantitatively with hearing experiments [31]. They found that the spectral envelope and F0 have remarkable contributions, and it is also reported that the degree of contribution depends on the dif- ference of acoustic feature between different speakers. Kasuyaet al. then investigated the contribution of static and dynamic features of vocal tract to speaker identification based on the ARX model [32]. It was reported that the contribution of static features is larger than that of dynamic features. Related to this result, Kitamura et al. reported that the spectral trajectory patterns do not affect speaker identification remarkably [33].
Some studies focus attention on one particular acoustic feature of vocal tract or vocal ford related to speaker identification. Kuwabara et al. investigated the role of formant frequencies and bandwidths in the perception of speaker individuality [34]. They found that the frequency shift of the formants below F3 affected the perception of speaker in- dividuality and the F3 is the most important feature. Kitamura et al. focused on the effect of spectral envelope especially [5, 35, 36]. As a result, the spectral envelope compo- nents above 1740 Hz carried more speaker individuality information and the components on lower frequency band seem mostly relate to the linguistic information. Moreover, it was suggested that in such high frequency band, the peaks are more important than the dips to speaker identification. From the knowledge of physiology, Kitamura et al. then found that such speaker individuality information appeared in the high frequency band
is derived from the shape of hypopharyngeal cavity that does not have much movement during speaking [6]. Aimino et al. showed that the nasal sound is effective for speaker identification based on the individuality differences in the physiological characteristics of articulatory organs such as nasal cavity and nasopharynx [37]. Akagi and Ienaga found that the contour of F0 contributes to the perception of speaker individuality [3].
2.2.2 Vocal emotion
Based on the expression of vocal-emotion, emotional speech can be divided into two categories: spontaneous emotional speech and acting emotional speech. The spontaneous emotional speech based on the emotional state of speaker which can not be controlled be speaker. The acting emotional speech based on the purpose of expressing the emotion with speakers’ controlling. The mechanism of speech production of spontaneous and acting emotional speech may be different [38, 39]. In this study, only acting emotional speech data are used for convenience.
For the perception of vocal emotion, previous works focused on the acoustic features conveyed in speech, such as F0, spectral envelope, intensity, and speech rate and using such acoustic features to modeling the perception of vocal-emotion [7, 40]. Scherer et al. presented emotion speech stimuli (14 kinds of emotion) to NH listeners to label the emotion of each stimulus [8]. At the same time, they also extracted 29 different acoustical features (F0, intensity, speaking rate, duration, time averaged spectrum, etc.) of each emotion speech signal. An emotion classification model was then constructed using multiple regression analysis analyzed the contribution of each acoustical features.
The emotion recognition rates of human response and regression model were 48% and 40% and the trend of confusion of human response and regression model was very similar.
Therefore, it is suggested that humans are also using such kinds of acoustical features to recognize the vocal-emotion of speech.
the acoustic features used in these studies were still based on source-filter model and the waveform of speech.
In summary, previous studies usually use the acoustical features based on source-filter model to investigate the perception of vocal emotion and speaker individuality. However, in the study of the perception of nonlinguistic information by CI listeners, it was found that the traditional acoustical features did not work well to account for the perceptual data [27]. As the CI device provided poor spectral cues, the traditional acoustical features can be perceived by CI listeners. On the other hand, the CI device provided temporal modulation cues as primary cues and the temporal modulation cues also play an important role in the human auditory system. For clarify the perception process of nonlinguistic information, a method based purely on the auditory perception is necessary.
2.3 The perception of temporal envelope
2.3.1 Human auditory system and modulation filterbank
This work focus on the contribution of temporal modulation cue to the perception of speaker individuality and vocal-emotion. The temporal modulation cue plays an impor- tant role in human peripheral auditory system [44]. The peripheral auditory system is composed of the outer, middle, and inner ear. The outer ear collects the sound wave and the middle convert the sound wave from air vibration to liquid vibration in cochlea effectively.
The cochlea works as an frequency analyzer and transforms the sound wave into neural signal. A membrane called the basilar membrane runs along the length of the cochlea.
Sound waves produces traveling waves along the basilar membrane. The basilar membrane works as a filter bank (auditory filterbank), splitting the complex sound wave into several frequencies. Gammatone filterbank is widely used as a model of auditory filterbank in the auditory system [45]. Furthermore, a gammachirp filterbank was proposed to simulate the auditory filterbank [46]. The Equivalent rectangular bandwidth (ERBN) was always used to measure the bandwidth of auditory filterbank [47] Glasberg and Moore then proposed a frequency scale called the ERBN-number scale based on ERBN). ERBN-number is
mel scale of pitch. The ERBN-number scale and Bark scale are all based on peripheral auditory system. The Bark scale is based on the critical bandwidth, however, the ERBN- number scale is based on the auditory filter shape measure by nothched-noise which should can simulate the frequency analysis function of auditory system better.
The movement of the basilar membrane causes a displacement of the inner hair cells and the inner hair cells transform such movement into neutral signal. As the mechanism of inner hair cells, such function can be modeled as a process of envelope extraction and amplitude compression. Therefore, the signal process in peripheral auditory system can be computationally modeled as a bandpass filterbank, envelope extraction and amplitude compression [10, 11]. The CI device basically use such signal process to simulate human peripheral auditory system [22,49]. Dauet al. proposed a computational model of human auditory signal processing and perception using modulation filterbank after the process of envelope extraction [50, 51]. The results showed that such model works better than the previous models without modulation filterbank. Recently the modulation filterbank was widely used in the speech intelligibility predictor and auditory system modeling [52–54]
There both physiological [55] and psychology [12] evidence suggested the existence of modulation filterbank in auditory system. Auditory system may also have a modulation frequency analyzer to analysis the modulation frequency components of the envelope of speech. Therefore, from the view point of auditory perception, the temporal modulation cues should play an important role in the perception of various information from speech.
2.3.2 Contribution of temporal modulation cues on the percep- tion of linguistic information
For speech perception, previous studies have proved that the temporal modulation cues are important for the perception of linguistic information. Shannonet al. showed that NH
by CI device [25, 27, 56–58]. It is shown that NVS with only four bands is sufficient to achieve good vowel, consonant, and sentence recognition [15,59]. Many other studies using NVS showed that importance of temporal modulation cues in speech perception [60–64]
Therefore, human can perceive the linguistic information with the temporal envelope as a primary cue.
For the contributions of modulation frequency components, Rosen firstly developed a framework for describing the acoustic structure of speech based on temporal aspects [21]. The envelope cues contain the modulation frequency band between about 2 and 50 Hz including the information about variations of intensity, duration, attach, decay, and segmental cues of speech. Drullman et al. investigated the important modulation frequency bands for speech perception by low- and high-pass filtering on the temporal envelope [18, 19]. They measured the speech-reception threshold for sentences in noise with reduce the high or low modulation frequency components of speech. The results showed that the modulation frequency bands from 4 to 16 Hz contained important cues related to linguistic information. Studies using NVS with similar experimental method also showed such modulation frequency bands are important for speech perception [14,20].
2.4 The research approach of this study
In this chapter, the previous studies of the perception of speaker individuality and vocal emotion were reviewed at first. The previous studies of nonlinguistic information almost focused on the acoustical features of speech based on the concept speech production such like F0, spectral envelope, etc. However, in the study of the perception of nonlinguistic information by CI listeners, it was found that the traditional acoustical features did not work well to account for the perceptual data [27]. The traditional acoustical features based on speech production have difficult to present the temporal modulation cues of speech.
Why should we clarify the contribution of temporal modulation cues on the perception of speaker individuality and vocal emotion? One important reason is that the temporal envelope plays an important role in auditory system. The auditory system should analysis the modulation frequency components at the early stage close to the periphery. Further-
perception of linguistic information. Therefore, the temporal modulation cues provided by temporal envelope should also contribute the perception of nonlinguistic information.
For clarify the perceptual process of nonlinguistic information, a method based purely on the auditory perception is necessary.
To clarify the contribution of temporal modulation cues, it must be confirmed that the temporal modulation information actually contribute to the perception of speaker individuality and vocal emotion. Shannon et al. showed that the temporal envelope contribute to the perception of linguistic information [13]. Drullman et al. investigated the important modulation frequency bands for speech perception by low- and high-pass filtering on the temporal envelope [18, 19]. These important studies demonstrated us the temporal modulation cues provided by the temporal envelope of speech contribute to the perception of linguistic information. In this study, the approaches of using NVS and low-pass filtering the temporal envelope are combined to confirm the contribution of temporal modulation cues on the perception of speaker individuality and vocal emotion.
Speaker and vocal-emotion recognition experiments using NVS are carried out with low- pass filtering the temporal envelope and varying the number of channels.
Furthermore, it is also necessary to clarify the exact features of temporal modula- tion information related to the perception of speaker individuality and vocal-emotion.
Modulation frequency analysis has been shown to be useful for many research fields such as auditory physiology, psychoacoustics, speech perception, and signal analysis and syn- thesis [65–68]. The modulation spectral features were also widely used in speech tech- nologies about nonlinguistic information such as speaker recognition [69–74] and vocal emotion recognition [75–77]. The fact that temporal modulation information is impor- tant to speech perception and can be used in speaker or vocal-emotion recognition system showed that the temporal modulation cues ought to play an important role in the percep- tion nonlinguistic information. The modulation spectral features must be more useful to
Chapter 3
The role of temporal modulation cues on the perception of speaker individuality and vocal emotion
Purpose:to confirm that whether the temporal modulation cues provided by the temporal envelope of speech actually contribute to the perception of speaker individuality and vocal emotion
Method:speaker and vocal-emotion recognition experiments using noise-vocoded speech with different spectral and temporal resolution
Hypothesis:If the temporal modulation cues contribute to the perception of speaker individuality and vocal emotion, the performance of speaker and vocal-emotion recognition
will be poorer with lower temporal resolution.
Chapter 4
Contribution of modulation spectral features on the perception of speaker individuality and vocal emotion
Purpose:to clarify the exact contribution of modulation modulation cues on the perception of speaker individuality and vocal-emotion.
Method:investigate the relationship between the modulation spectral features and perceptual data obtained from speaker
and vocal-emotion recognition experiments
Hypothesis:If the modulation spectral features contribute to the perception of speaker individuality and vocal emotion, there must be a high correlation between the
modulation spectral features and the perceptual data.
Figure 2.1: The research approach of this study.
Chapter 3
The role of temporal modulation cues on the perception of speaker individuality and vocal emotion
3.1 Introduction
This chapter aims to clarify the role of temporal modulation cues in speaker and vocal- emotion recognition using NVS and confirm that whether the temporal modulation infor- mation actually contribute to the perception of speaker individuality and vocal emotion.
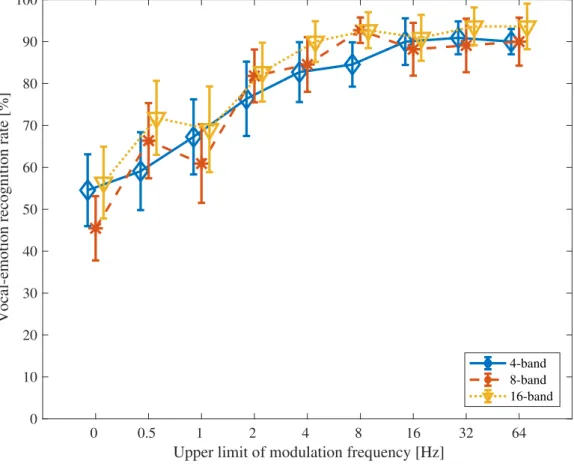
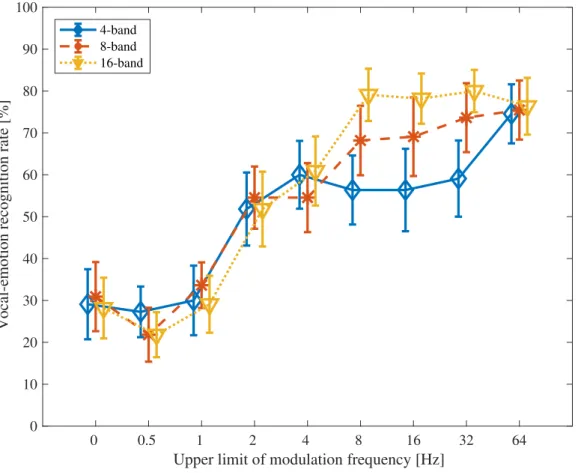
Furthermore, the effects of different spectral resolutions are also investigated. In the experiment, speaker distinction and vocal emotion recognition are conducted by NH lis- teners under different upper limit of modulation frequency (0, 0.5, 1, 2, 4, 8, 16, 32, and 64 Hz) of NVS. The temporal modulation cues provided by NVS will be poorer with lower upper limit of modulation frequency. In addition, the role of temporal modulation cues in the different spectral resolutions condition are also investigated by varying the num- ber of channels (4, 8, and 16). The spectral and temporal modulation cues are reduced
3.2 Signal Processing: Noise-Vocoded Speech
Figure 3.1 illustrates the schematic diagram of the signal processing to generate NVS.
First, to reduce the effect of the average intensity, the active speech levels of all speech signals were normalized to−26 dBov by using the P.56 speech voltmeter [78]. The speech signals(n) was then divided into several frequency bands by using a band-pass filterbank, as following,
s(k, n) =s(n)∗hBP F(k, n) (3.1)
where n is time, hBP F(k, n) is the transform function of the band-pass filter in channel k, ands(k, n) is the sub-band signal in channel k. At the same, the Gaussian white noise with the same length of the speech signal was also divided into several frequency bands using the same band-pass filterbank, as following,
W N(k, n) =W N(n)∗hBP F(k, n) (3.2) whereW N(n) is Gaussian white noise andW N(k, n) is the band-limited noise in channel k.
The bandwidth and boundary frequencies of the band-pass filters (6th-order Butter- worth infinite impulse response (IIR) filter) were defined using ERBN (Equivalent Rectan- gular Bandwidth) and ERBN-number scale [44]. The ERBN-number scale is comparable to a scale of distance along the basilar membrane, so the frequency resolution of the audi- tory system can be faithfully replicated by dividing frequency bands in accordance with the ERBN-number. The relationship between ERBN-number and acoustic frequency is defined as follows:
ERBN−number = 21.4log10
(4.37f 1000 + 1
)
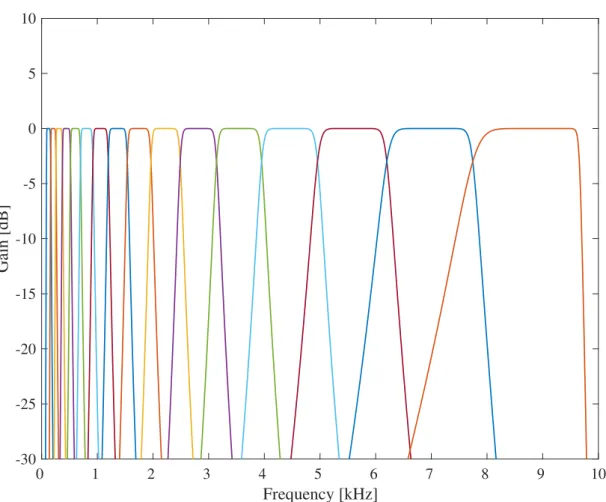
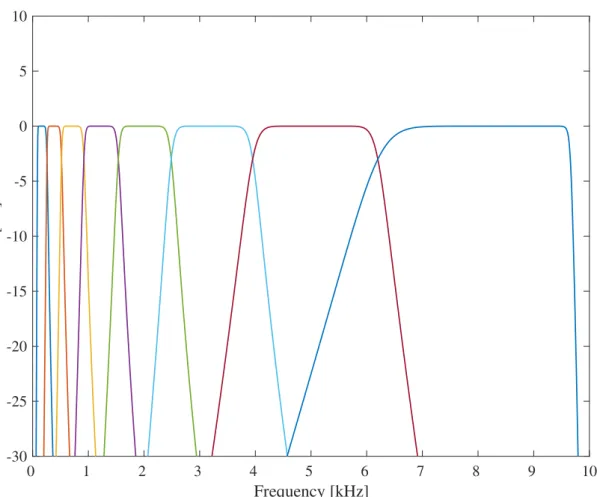
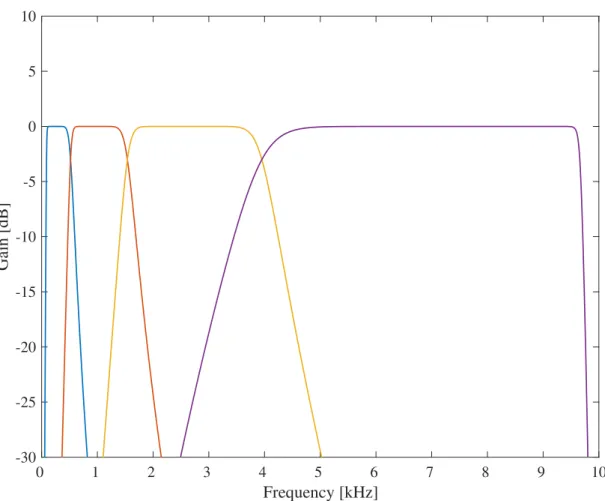
(3.3) where f is acoustic frequency in Hz. The boundary frequencies of the band-pass filters were defined from 3 to 35 ERBN-number with bandwidth as 2, 4, or 8 ERBN. Therefore, the numbers of channels of the band-pass filterbank were 16, 8, or 4. The number of channels determines the frequency resolution of NVS: higher frequency resolution will be obtained with more channels. Table 3.1 shows the boundary frequencies of the 4-, 8-, and 16-band band-pass filters in Hz and ERBN-number. Figure 3.2, 3.3, and 3.4 shows the frequency response of the ERB -number based band-pass filterbank.
B P F B P F B P F 䞉 䞉 䞉
Hil b er t T ra ns fo rm Hil be rt T rans fo rm Hil b er t T ra ns fo rm
L P F L P F L P F
䞉 䞉 䞉
N B N
䞉 䞉 䞉
N o is e- Vo co de d S pe ec h
ofnoise-vocodermethodusedtogeneratestimuli(BPF:band-passfilter;LPF:low-passfilter;andTable 3.1: The boundary frequencies of the band-pass filters in Hz and ERBN-number.
4-band 8-band 16-band ERBN-number Hz
1
1 1
3 87.18
2 5 163.1
2 3
7 257.2
4 9 373.8
2
3 5
11 518.5
6 13 698.0
4 7
15 920.5
8 17 1197
3
5
9 19 1539
10 21 1963
6
11 23 2489
12 25 3142
4
7
13 27 3951
14 29 4955
8
15 31 6200
16 33 7743
35 9657
0 1 2 3 4 5 6 7 8 9 10 Frequency [kHz]
-30 -25 -20 -15 -10 -5 0 5 10
Gain [dB]
Figure 3.2: Frequency response of the ERBN-number based 16-band band-pass filterbank.
0 1 2 3 4 5 6 7 8 9 10 Frequency [kHz]
-30 -25 -20 -15 -10 -5 0 5 10
Gain [dB]
Figure 3.3: Frequency response of the ERBN-number based 8-band band-pass filterbank.
0 1 2 3 4 5 6 7 8 9 10 Frequency [kHz]
-30 -25 -20 -15 -10 -5 0 5 10
Gain [dB]
Figure 3.4: Frequency response of the ERBN-number based 4-band band-pass filterbank.
Then, the temporal envelope e(k, n) of the output signal from each band-pass filter was extracted using the Hilbert transformation and performing a low-pass filter (2nd-order Butterworth IIR filter).
e(k, n) = |s(k, n) +jH[s(k, n)]| ∗hLP F(n), (3.4) whereH denotes the Hilbert transform andhL(n) is the impulse response of the low-pass filter. The cut-off frequency of the low-pass filter determined the upper limit of modulation frequency. The upper limit of modulation frequency relates to the temporal resolution that higher temporal resolution will be obtained with higher upper limit of modulation frequency. To investigate the role of temporal cues in the perception of nonlinguistic information, the cut-off frequencies of the low-pass filter were 0.5, 1, 2, 4, 8, 16, 32, and 64 Hz. Moreover, there was an additional “0 Hz” condition where only the direct current component of the Hilbert envelope was extracted.
Finally, the temporal envelope in each channel served to amplitude modulation with the band-limited noise that was generated by band-pass filtering white noise at the same boundary frequency. All amplitude-modulated band-limited noises were summed to gen- erate the NVS stimulus, as following,
N V S(n) =
∑K
i=1
e(k, n)×W N(k, n), (3.5)
whereN V S(n) is the NVS signal and theK is the number of channels which could be 4, 8, or 16.
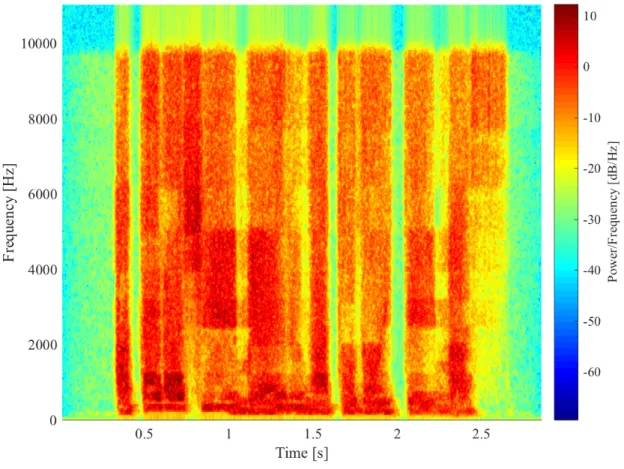
Figure 3.5 shows the spectrogram of a Japanese speech data. Figure 3.6 shows the spectrogram a 16-band NVS with the upper limit of modulation frequency is 64 Hz gener- ated from the speech data in figure 3.5. Figure 3.7 shows the spectrogram a 4-band NVS with the upper limit of modulation frequency is 4 Hz generated from the same speech data. For NVS, there is no such harmonic structure and the power in such one band is almost flat. With the decreasing of the number of channels, the spectral solution is also decreased and the spectral cue is poorer. Also with the decreasing of the upper limit of modulation frequency, the NVS is smoothed further and the temporal modulation cue is poorer.
Figure 3.5: Spectrogram of original speech.
Figure 3.6: Spectrogram of the 16-band NVS and the upper limit of modulation frequency is 64 Hz.
Figure 3.7: Spectrogram of the 4-band NVS and the upper limit of modulation frequency is 4 Hz.