"This is the Accepted Version of the following article: Immunohistochemically Detected Expression of ATRX, TSC2, and PTEN Predicts Clinical Outcomes in Patients With Grade 1 and 2 Pancreatic Neuroendocrine Tumors; Annals of surgery; Volume Publish Ahead of Print (Octover 9, 2019 ) doi:
10.1097/SLA.0000000000003624, which has been published in final form at https://doi.org/10.1097/SLA.0000000000003624 . "
1 ORIGINAL ARTICLE
1
Immunohistochemically Detected Expression of ATRX, TSC2, and PTEN Predicts 2
Clinical Outcomes in Patients with Grade 1 and 2 Pancreatic Neuroendocrine 3
Tumors 4
Jun Uemura, MD1; Keiichi Okano, MD, PhD, FACS1; Minoru Oshima, MD, PhD1; 5
Hironobu Suto, MD1; Yasuhisa Ando, MD1; Kensuke Kumamoto, MD, PhD1 ; Kyuichi 6
Kadota, MD, PhD2; Shuji Ichihara, MD, PhD3; Yasutaka Kokudo, MD, PhD4; Takashi 7
Maeba, MD, PhD5; Yoshihide Nanno, MD, PhD6, Hirochika Toyama, MD, PhD6; 8
Yasutsugu Takada, MD, PhD7; Mitsuo Shimada, MD, PhD, FACS 8; Kazuhiro Hanazaki, 9
MD, PhD9; Tsutomu Masaki, MD, PhD10; Yasuyuki Suzuki, MD, PhD1 10
Departments of 1Gastroenterological Surgery and 2Pathology, Faculty of Medicine, 11
Kagawa University, Kagawa, Japan 12
3Department of Gastroenterological Surgery, Kagawa Prefectural Central 13
Hospital, Kagawa, Japan.
14
4Department of Surgery, Kagawa Rosai Hospital, Kagawa, Japan.
15
5Department of Surgery, Japan Community Health Care 16
2 Organization Ritsurin Hospital, Kagawa, Japan.
1
6Division of Hepato-biliary-pancreatic Surgery, Department of Surgery, Kobe 2
University Graduate School of Medicine, Kobe, Japan 3
7Department of Hepato-Biliary-Pancreatic and Brest Surgery, Ehime University 4
Graduate School of Medicine, Ehime, Japan 5
8Department of Digestive and Transplant Surgery, Tokushima University, Tokushima, 6
Japan 7
9Department of First Surgery, Kochi University School of Medicine, Kochi, Japan 8
10Departments of Gastroenterology and Neurology, Faculty of Medicine, Kagawa 9
University, Kagawa, Japan 10
Address Correspondence to: Keiichi Okano, MD, PhD, FACS 11
Department of Gastroenterological Surgery, Faculty of Medicine, Kagawa University 12
1750-1 Ikenobe, Miki-cho, Kita-gun, Kagawa 761-0793, Japan 13
E-mail: kokano@med.kagawa-u.ac.jp Fax: +81 (87) 891-2439 Tel: +81 (87) 891-2438 14
Financial Support: Supported by a Grant-in-Aid for Scientific Research (25462115) 15
from the Ministry of Education, Science and Culture of Japan.
16
3
The authors have no financial conflicts of interest related to this work.
1
Running title: ATRX, TSC2 and PTEN in clinical outcome for PNETs 2
Category: Original article 3
Manuscript length: abstract, 261 words; main text, 2715 words; 3 tables; 4 figures; 1 4
supplementary table; 2 supplementary figures 5
Key words: Pancreatic Neuroendocrine Tumors, ATRX, TSC2, PTEN, G1, G2 6
7 8
4 ABSTRACT
1
Objective: The goal of this retrospective study was to clarify the clinical implications 2
of immunohistochemically detected protein expression for genes that are frequently 3
mutated in pancreatic neuroendocrine tumors (PNETs).
4
Background: The clinical management of PNETs is hindered by their heterogenous 5
biological behavior. Whole-exome sequencing recently showed that five genes 6
(DAXX/ATRX, MEN1, TSC2, and PTEN) are frequently mutated in PNETs. However, the 7
clinical implications of the associated alterations in protein expression remain unclear.
8
Methods: We collected Grade 1 and 2 (World Health Organization 2017 Classification) 9
primary PNETs samples from 100 patients who underwent surgical resection. ATRX, 10
DAXX, MEN1, TSC2, and PTEN expression were determined immunohistochemically 11
to clarify their relationships with prognosis and clinicopathological findings.
12
Results: Kaplan-Meier analysis indicated that loss of TSC2 (n=58) or PTEN (n=37) was 13
associated with significantly shorter overall survival, and that loss of TSC2 or ATRX 14
(n=41) was associated with significantly shorter recurrence-free survival. Additionally, 15
loss of ATRX or TSC2 was significantly associated with nodal metastasis. In a 16
5
multivariate analysis, combined loss of TSC2 and ATRX (n=31) was an independent 1
prognostic factor for shorter recurrence-free survival (hazard ratio 10.1, 95% confidence 2
interval 2.1-66.9, p=0.003) in G2 PNETs.
3
Conclusions: Loss of ATRX, TSC2, and PTEN expression might be useful as a method 4
of clarifying the behavior and clinical outcomes of Grade 1 and 2 PNETs in routine 5
clinical practice. Combined loss of TSC2 and ATRX had an especially strong, 6
independent association with shorter recurrence-free survival in patients with G2 PNETs.
7
Loss of pairs in ATRX, TSC2, or PTEN would be useful for selecting the candidate for 8
postoperative adjuvant therapy.
9 10
6 INTRODUCTION
1
Pancreatic neuroendocrine tumors (PNETs) are uncommon tumors that account for 1-2%
2
of all pancreatic neoplasms1, 2. The main, well-known prognostic factor for PNETs is 3
World Health Organization (WHO) histological grade, which classifies PNETs as G1, G2, 4
G3, or neuroendocrine carcinoma (PNEC) based on mitotic counts and Ki-67 labeling 5
indices3. PNEC is an extremely rare tumor that is associated with an exceptionally poor 6
prognosis4-6. On the other hand, the biological behavior of well-differentiated PNETs 7
(G1/G2) differs considerably between cases7-12. Some tumors grow slowly and do not 8
recur, even after marginal excision by enucleation, but other tumors expand aggressively 9
and metastasize rapidly. Although the Ki-67 proliferative index is a valuable prognostic 10
factor that is currently employed in routine clinical practice, it remains difficult to predict 11
which G1 and G2 tumors will recur and behave aggressively12. 12
Whole-exome sequencing of PNETs has revealed several key genetic 13
alterations13. Genes in the PI3K/Akt pathway, including TSC2, PTEN, and PIK3CA, 14
were mutated in 15% of PNETs13. Mutually exclusive somatic inactivating mutations in 15
either the DAXX or ATRX genes have been reported to be present in as much as 33% to 16
7
43% of PNETs in case series13, 14. Loss of function in these proteins leads to telomere 1
dysfunction and results in impaired non-homologous end joining, alternate lengthening 2
of telomeres, and general genomic instability15, 16. 3
If it is possible to establish consistent associations between the above mentioned 4
genetic alterations and clinical outcomes, then immunohistochemical analyses of the 5
associated proteins could be deployed rapidly in routine clinical practice as a 6
supplement to the WHO grading system. We therefore sought to investigate the 7
associations of immunohistochemically determined protein expression with clinical 8
outcomes and pathological characteristics in cases of G1 and G2 primary PNETs.
9
Protein expression was evaluated for the genes ATRX, DAXX, MEN1, TSC2, and PTEN.
10 11
MATERIALS AND METHODS 12
This study was approved by institutional review boards of Kagawa University and each 13
study center (No. H23-076).
14
Patients and Tissue Samples 15
We reviewed findings for 100 patients with PNETs who received resection of the 16
8
pancreas at 4 university hospitals affiliated with the Shikoku Consortium of Surgical 1
Research (SCSR17), Kobe University Hospital and 3 related hospitals in Kagawa 2
prefecture between September 1996 and November 2016. All tumor specimens were 3
formalin-fixed and paraffin-embedded. The paraffin blocks from the 100 patients were 4
prospectively prepared for pathologic and immunohistochemistry (IHC) studies at 5
Kagawa University. To definitively confirm the diagnosis and grade according to the 6
WHO 2017 classification3, all cases were independently reviewed by a pathologist (KK) 7
experienced in the diagnosis of PNETs. High grade pancreatic neuroendocrine 8
carcinomas (in other words, G3 or PNEC cases under the WHO 2017 classification) 9
were excluded. Mixed tumors with a pancreatic ductal adenocarcinoma, squamous, or 10
acinar component (MiNEN under the WHO 2017 classification) were also excluded.
11
For patients with multiple tumors, the largest tumor was assessed. Patients were 12
followed up and overall survival was analyzed. Disease recurrences were generally 13
identified using computed tomography imaging. Tumors were staged in accordance 14
with the 7th edition of the TNM staging system for pancreas tumor issued by the 15
American Joint Committee on Cancer18. 16
9 Immunohistochemistry
1
Formalin-fixed paraffin-embedded samples were cut into sections (thickness, 4 μm) for 2
immunolabeling. Immunohistochemical labeling was carried out using a Bond III and 3
Bond Max automatic immunostainer (Leica Microsystems, Wetzlar, Germany) after 4
incubation of the sample in a decloaking chamber for antigen activation. All samples were 5
stained immunohistochemically with the following antibodies: ATRX (Sigma-Aldrich, St.
6
Louis, MO, USA; HPA001906), DAXX (Sigma-Aldrich, HPA008736), MENMenin 7
(Bethy1 Laboratories, Montgomery, TX, USA; Clone A300-105A), TSC2, Tuberin 8
(Santa Cruz Biotechnology, Satna Cruze, CA, USA; C-20), PTEN (Dako, Carpinteria, 9
CA, USA; Clone 6H2.1), p53 (Dako, DO-7), Rb (QED Bioscience, San Diego, CA, USA;
10
3C8), p16 (MTM Laboratories, Tucson, AZ, USA; E6H4).
11
IHC results were interpreted by a pathologist (KK) and a surgeon (JU) who were 12
experienced with IHC assessment. They were completely blinded to all clinical data and 13
the tumor status of each patient's slides at the time of analysis. ATRX and DAXX 14
expressions were classified as either positive, defined as unequivocal nuclear staining in 15
tumor cells; or negative, defined as complete absence of nuclear staining in the presence 16
10
of an unequivocal internal positive control provided by non-neoplastic cells with 1
retained nuclear expression (for example lymphocytes, endothelial cells, or stromal 2
cells)16, 19. MEN1 (Menin) was evaluated as follows: results were scored as positive if 3
the intensity of cytoplasmic staining was stronger than the intensity of nuclear staining.
4
Immunohistochemical staining for TSC2 (Tuberin) and PTEN were evaluated by an 5
individual immunoreactivity score (IRS). Staining intensity was scored as 0 = negative, 6
1 = weak, 2 = moderate, or 3 = strong. Two parameters, the intensity and the percentage 7
of cells stained, were obtained and multiplied. IRS ≥ 100 was regarded as positive and 8
IRS < 100 was regarded as negative. P53 immunolabeling was classified as follows:
9
normal if 5–30% of tumor cells were stained positively on p53 immunolabeling; and 10
abnormal if either <5% of tumor cells were stained positively on p53 immunolabeling 11
(suggesting the presence of an intragenic deletion or nonsense mutation) or if >30% of 12
tumor cells were stained positively on p53 immunolabeling (suggesting the presence of 13
a missense mutation)5, 17, 20. 14
Statistics 15
All statistical analyses were performed using JMP13 (SAS Institute Inc., Cary, NC, 16
11
USA). For the investigated clinicopathologic parameters, between-group comparisons 1
were performed using the chi-square test or Fisher’s exact test. Survival curves were 2
estimated using the Kaplan-Meier method, and differences in survival were compared 3
using the log-rank test. A two-sided p-value <0.05 was considered statistically 4
significant. Variables that were found to be significant in univariate analysis at the 5
p<0.05 level were included in the multivariate analysis in a backward stepwise fashion.
6
Cox proportional hazards models were used for the multivariate analysis.
7 8
RESULTS 9
Clinicopathological characteristics and outcome 10
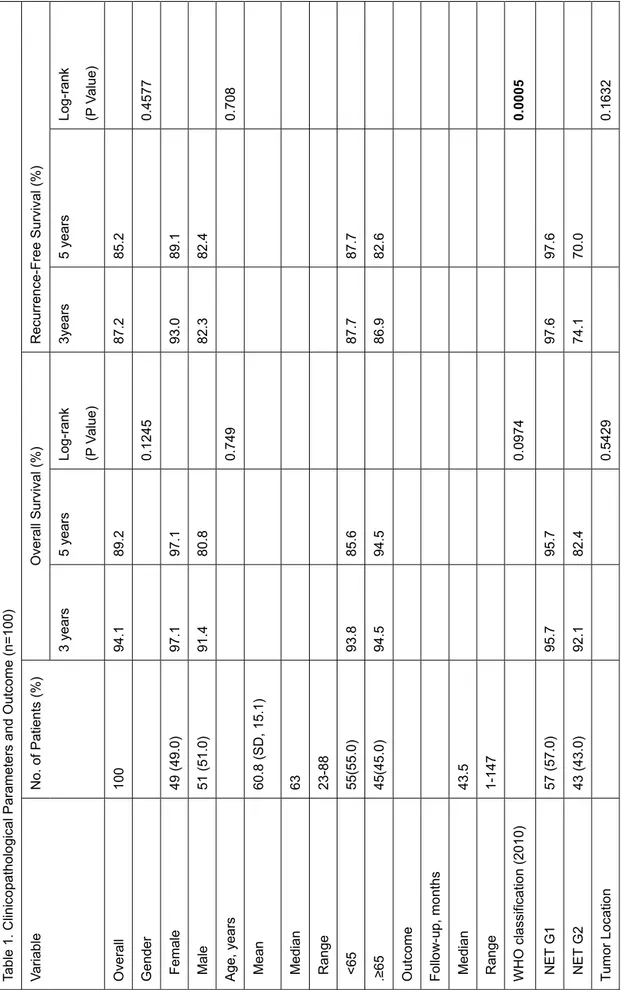
The study included a total of 100 patients who underwent surgical resections for G1 and 11
G2 PNETs. Their clinical and pathological characteristics are compared with clinical 12
outcomes in Table 1. Briefly, the median age at operation was 63 years (range, 23-88), 13
whereas the median post-operative duration of follow-up was 43.5 months (range, 14
1-147). The cohort of 100 patients (Table 1) consisted of 49 women (49%) and 51 men 15
(51%). The 3- and 5-year overall survival (OS) rates were 94.1% and 89.2%. Of the 100 16
12
re-evaluated tumors, 57 were NET G1 and 43 were NET G2.
1
The IHC results are also shown in Table 1. A single formalin-fixed paraffin- 2
embedded sample did not react with any immunohistochemical labeling, and was 3
excluded from the IHC evaluation. Among the 99 remaining tumors, loss of ATRX was 4
detected in 41 (41.4%) (Figure 1A, B), loss of DAXX was detected in 64 (64.6%), loss 5
of MEN1 was detected in 25 (25.3%), loss of TSC2 was detected in 58 (58.6%) (Figure 6
2A, B), and loss of PTEN was detected in 37 (37.8%) (Figure 3A, B).
7
Kaplan-Meier survival analysis (Table 1) indicated that nodal metastasis 8
(p=0.0513), liver metastasis (p<0.0001), vascular invasion (p=0.0142), perineural 9
infiltration (p=0.0002), loss of TSC2 (p=0.007) (Figure 2C), and loss PTEN (p=0.0486) 10
(Figure 3C) were significantly associated with shorter OS. Kaplan-Meier recurrence 11
analysis indicated that WHO classification (p=0.0005), tumor size (p<0.0001), liver 12
metastasis (p=0.008), vascular invasion (p=0.0003), perineural infiltration (p=0.00124), 13
loss of ATRX (p=0.0117) (Figure 1D), and loss of TSC2 (p=0.009) (Figure 2D) were 14
significantly associated with shorter recurrence-free survival (RFS).
15
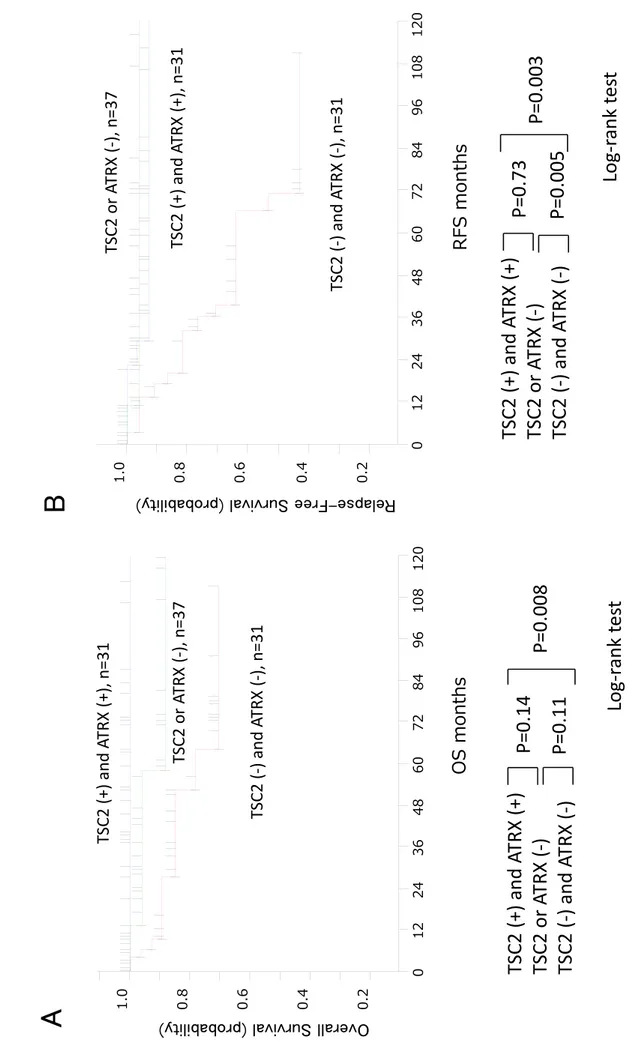
Taking advantage of the large number of tumors that were profiled, we also analyzed 16
13
the associations between pairs of protein expression statuses and clinical outcomes 1
(Figure 4, Supplementary figures 1, and 2). Interestingly, combined negative expression 2
of any 2 of the 3 proteins ATRX, TSC2, and PTEN had strong associations with clinical 3
outcome. Loss of both TSC2 and ATRX (n=31) was associated with significantly shorter 4
RFS (Figure 4B). Loss of both TSC2 and PTEN (n=30) was also associated with 5
significantly shorter RFS. (Supplementary figure 1B) Loss of both ATRX and PTEN 6
(n=45) was also associated with significantly shorter RFS. (Supplementary figure 2B) 7
In contrast, OS or RFS did not differ significantly between single protein expression loss 8
and positive (intact) protein expression. Thus, loss of pairs in ATRX, TSC2, or PTEN 9
would be clinically important than just single loss of individual genes.
10
WHO 2017 grade is based on Ki-67 or mitosis assessment, and has been accepted as 11
the most important prognostic factor for PNETs. Among the 57 patients with G1 PNETs, 12
only 1 developed recurrence (time to recurrence: 20 months after surgery). Considering 13
the indolent nature of G1 PNETs, we limited the multivariate RFS analysis to the 43 14
patients who had G2 PNETs. The multivariate analysis demonstrated that vascular 15
invasion (hazard ratio 13.5, p=0.03) and nodal metastasis (hazard ratio 6.8, p=0.02) were 16
14
independent prognostic factors for RFS. Single losses of ATRX, TSC2, are PTEN were 1
not independent prognostic factors for RFS. However, multivariate analysis of combined 2
protein expressions demonstrated that loss of TSC2 and ATRX (hazard ratio 10.1, 3
p=0.003) was an independent prognostic factor for RFS (Table 2).
4
Associations between protein expression and clinicopathological factors 5
Table 3 summarizes the associations of ATRX, DAXX, MEN1, TSC2, and PTEN 6
negativity with clinicopathological parameters (details are shown in the supplementary 7
table). The loss of ATRX was significantly associated with tumor size (p=0.0215), nodal 8
metastasis (p=0.0145), recurrence (p=0.0412), vascular invasion (p=0.0047), and 9
perineural infiltration (p=0.0024). The loss of MEN1 was significantly associated with 10
WHO classification grade (p=0.0205), tumor size (p=0.0299), liver metastasis (p=0.0231), 11
hormone production (p=0.0033), and vascular invasion (p=0.024). The loss of TSC2 was 12
significantly associated with tumor size (p=0.0240), nodal metastasis (p=0.0016), liver 13
metastasis (p=0.0194), recurrence (p=0.0109), hormone production (p=0.0008), and 14
vascular invasion (p=0.0302). The loss of PTEN was significantly associated with tumor 15
size (p=0.0202), recurrence (p=0.0446), and vascular invasion (p=0.0078).
16
15 1
DISCUSSION 2
In this study of 100 patients with G1 or G2 PNETs who received curative-intent 3
surgery, loss of ATRX, TSC2, and PTEN was immunohistochemically observed in 4
41%, 58%, and 37% of the patients and was associated with shorter OS or RFS in 5
univariate analyses. Furthermore, ATRX, MEN1, TSC2, and PTEN status were 6
identified as biologic traits that had associations with different sets of clinicopathologic 7
features. Interestingly, clinical outcomes had strong associations with combined 8
negative expression for pairs of the proteins ATRX, TSC2, and PTEN. For patients with 9
G2 PNETs, multivariate Cox proportional hazards regressions demonstrated that 10
combined loss of TSC2 and ATRX was an independent prognostic factor for RFS 11
(hazard ratio 10.1, P = 0.003). In contrast, loss of single protein expression had no 12
significant association with OS or RFS in multivariate analysis.
13
Altogether, our results for ATRX, TSC2, and PTEN suggest that, as compared 14
with assessments of single genetic alterations, assessments of combined genetic 15
alterations are more predictive of survival outcomes. Previous sequencing studies and 16
16
studies of genetically engineered mouse models have established that the accumulation 1
of genetic alterations contributes to clonal evolution and thereby has a considerable 2
influence on the biology of malignant tumors21-23. In an earlier study of pancreatic 3
ductal adenocarcinoma (PDAC), we reported comparable consequences related to 4
combined gene status for TP53, CDKN2A/p16, and SMAD4/DPC4: increasing numbers 5
of alterations were associated with shorter survival.20 Curiously, single-gene alterations 6
of ATRX, TSC2, and PTEN had no significant associations with OS or RFS in our 7
multivariate analyses of PNETs from the present study. In our earlier study of PDAC, 8
alterations to 1 of the 3 investigated genes had a significant association with OS when 9
assessed individually. The differences between the nature of PNETs and PDACs may 10
reflect the role of single-gene alterations. Further studies of the relationship between 11
clinical outcomes and the cooperative interaction of essential genes in PNETs appear 12
warranted.
13
Mutations in DAXX or ATRX have been detected in about 40% of PNETs. Jiao et 14
al.13 showed that DAXX and ATRX mutations were associated with prolonged survival 15
in patients with PNETs. In contrast, Marinoni et al.16 showed that the loss of DAXX and 16
17
ATRX expression was correlated with significantly shortened RFS. More recently, 1
Chou et. al.19 reported that single loss of expression of ATRX as determined by IHC is a 2
useful independent predictor of shorter overall survival, while DAXX has no impact on 3
clinical outcomes. The present study also confirmed that loss of ATRX protein 4
expression in PNETs was associated with worse outcomes, as evaluated using 5
univariate analysis. The discrepant findings regarding DAXX and ATRX may be 6
explained by associations with differences in disease stages. Specifically, patients with 7
advanced stage disease (stages III and IV) were dominant in the study by Jiao et al.13, 8
and all patients with ATRX- and DAXX-negative tumors presented with metastatic 9
disease. ATRX and DAXX loss may be associated with shorter survival in early stage 10
cases, but results may be different for advanced stage or metastatic cases. Because the 11
detailed roles of the genes in each stage are unclear, further studies would be required to 12
confirm whether this is a true association and to investigate potential mechanisms.
13
Among the down-regulated genes found in PNETs, TSC2 is a tumor suppressor of 14
the Akt/mTOR pathway with GTPase activating function24. TSC2 mutation leads to 15
tuberous sclerosis complex. Chromosome arm 16p, which contains TSC2, has been 16
18
found to be lost in 37% of PNETs25, 26. PTEN is another important tumor suppressor 1
gene that is involved in the same pathway. PTEN is also frequently mutated or lost in 2
several forms of sporadic or familiar cancers. In PNETs, however, the frequency of loss 3
is between 10% and 29%25-27. Missiaglia et al.24 showed that TSC2 cytoplasmic protein 4
level was down-regulated in 35% of patients with PNETs, while staining of PTEN 5
was altered in nuclear, cytoplasmic, or both cell compartments in around 60% of cases.
6
TSC2 staining correlated with both overall survival and disease-free survival in patients 7
with assumed complete tumor excision. Our findings support their results in that neither 8
PTEN nor TSC2 was an independent prognostic predictor in our multivariate analysis.
9
However, we also found that combined loss of these proteins had a strong association 10
with clinical outcomes. Several pieces of evidence associated with our TSC2 and PTEN 11
findings support the hypothesis that the Akt/mTOR pathway is involved in PNETs 12
progression24, 28, 29. Deficiency of both TSC2 and PTEN may reduce the inhibition of 13
mTOR activity more strongly than either single alteration. The current study’s finding 14
related to the accumulation of genetic alterations in the Akt/mTOR pathway may 15
present some clues for selecting treatment targets for mTOR inhibition.
16
19
The IHC-based results of the current study should be clinically valuable and might 1
have links to treatment options. In routine clinical practice, IHC results for ATRX, 2
TSC2, and PTEN could be obtained promptly from surgical specimens or biopsy 3
samples. For example, combined negative expression for pairs of ATRX, TSC2, and 4
PTEN could provide rapidly available predictions of high-risk status for postoperative 5
recurrence, which might apply to about one-third of the patients. The group of patients 6
with high-risk status might be suitable candidates for adjuvant treatment.
7
Endoscopic ultrasound fine needle aspiration (EUS-FNA) has altered the 8
diagnostic strategy for pancreatic tumor20, 30, 31. Genetic variants can be preoperatively 9
assessed immunohistochemically using EUS-FNA materials. Surgical approaches that 10
include standard lymph node dissection may be more beneficial in patients who are at 11
elevated risk of nodal metastasis (as potentially identifiable from ATRX or TSC2 loss).
12
Additionally, when considering entry into upcoming clinical trials, it would be 13
reasonable to stratify patients based on genetic status. Such stratification may help to 14
accurately define the role of currently available molecular targeted agents.
15
The present study has several limitations. First, the study design is retrospective.
16
20
Furthermore, the patients did not all receive the same treatment (e.g., type of operation 1
and lymph node dissection). To validate the individual and combined expressions of 2
ATRX, TSC2, and PTEN as prognostic biomarkers, a prospective study with a large 3
series of patients is clearly warranted.
4
In conclusion, we found that IHC-demonstrated loss of ATRX, TSC2, and PTEN 5
occurred in 41%, 58%, and 37% of the patients, and was associated with worse OS 6
and/or RFS in univariate analyses. Furthermore, ATRX, MEN1, TSC2, and PTEN were 7
identified as biologic traits that were associated with different sets of clinicopathologic 8
features. Combined negative expression of pairs of ATRX, TSC2, and PTEN had strong 9
associations with clinical outcome in G2 PNETs. IHC-identified loss of ATRX, TSC2, 10
and PTEN protein expressions might be clinically valuable and should be linked with 11
treatment options. Loss of pairs in ATRX, TSC2, or PTEN would be clinically useful for 12
selecting the candidate for postoperative adjuvant therapy in patients with Grade 1 and 2 13
PNETs.
14 15
Acknowledgements 16
21
We acknowledge Professor Shinichi Yachida for inspiring this study.
1
2
Figure Legends 3
Figure 1 4
ATRX protein expression and its relationships with the overall and recurrence-free 5
survival of patients with pancreatic endocrine tumors (PNETs).
6
Immunohistochemistry with anti-ATRX antibody (Sigma-Aldrich, HPA001906) 7
(original magnification X40): (A) PNET tissue with positive staining and (B) PNET 8
tissue with negative staining. Kaplan-Meier curves showing the correlations between 9
ATRX immunostaining status and (C) overall survival and (D) recurrence-free survival.
10
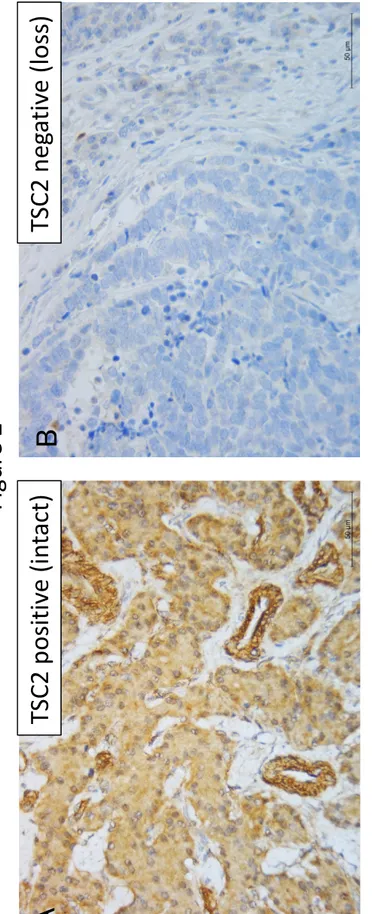
Figure 2 11
Tuberous sclerosis 2 (TSC2) protein expression and its relationships with the overall 12
and recurrence-free survival of patients with pancreatic endocrine tumors (PNETs).
13
Immunohistochemistry with anti-tuberin antibody (Santa Cruz, C-20) (original 14
magnification X40): (A) PNET tissue with positive staining and (B) PNET tissue with 15
negative staining. Kaplan-Meier curves showing the correlations between tuberin 16
immunostaining and (C) overall survival and (D) recurrence-free survival.
17
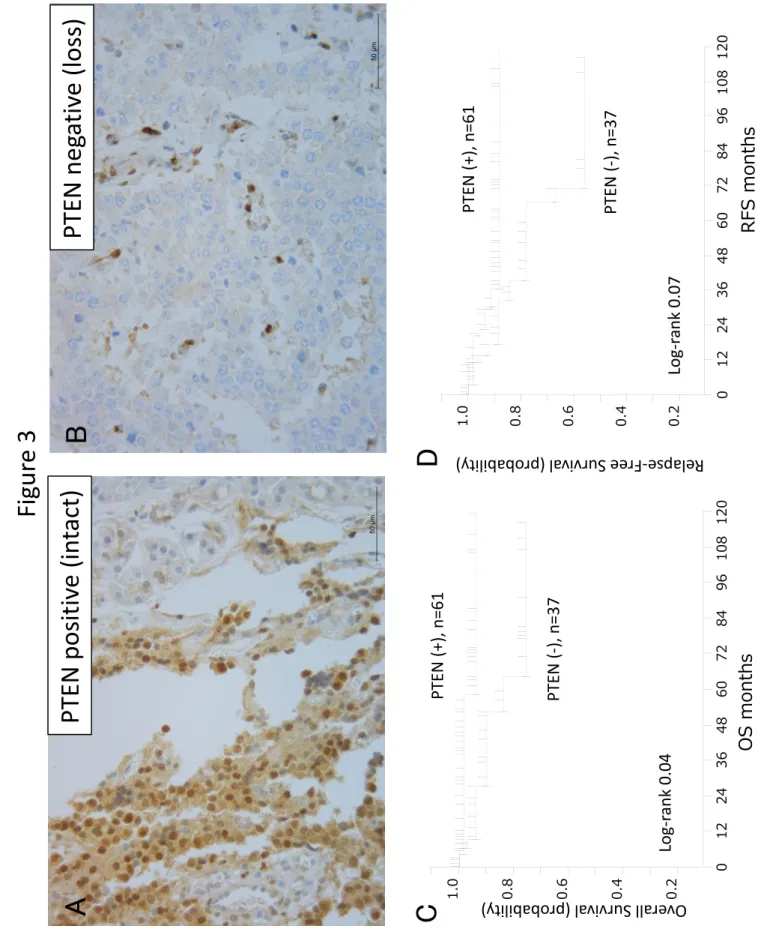
22 Figure 3
1
PTEN protein expression and its relationships with the overall and recurrence-free 2
survival of patients with pancreatic endocrine tumors (PNETs).
3
Immunohistochemistry with anti- PTEN antibody (Dako, Clone 6H2.1) (original 4
magnification X40): (A) PNETs tissue with positive staining and (B) PNETs tissue with 5
negative staining. Kaplan-Meier curves showing the correlations between PTEN 6
immunostaining status and (C) overall survival and (D) recurrence-free survival.
7
Figure 4 8
Kaplan-Meier survival curves stratified by combined TSC2 and ATRX protein expression 9
status. (A) Correlation between combined TSC2 and ATRX protein expression status and 10
overall survival. (B) Correlation between combined TSC2 and ATRX protein expression 11
status and recurrence-free survival.
12
Supplementary Figure 1 13
Kaplan-Meier survival curves stratified by combined TSC2 and PTEN protein expression 14
status. (A) Correlation between combined TSC2 and PTEN protein expression status and 15
overall survival. (B) Correlation between combined TSC2 and PTEN protein expression 16
23 status and recurrence-free survival.
1
Supplementary Figure 2 2
Kaplan-Meier survival curves stratified by combined ATRX and PTEN protein 3
expression status. (A) Correlation between combined ATRX and PTEN protein 4
expression status and overall survival. (B) Correlation between combined ATRX and 5
PTEN protein expression status and recurrence-free survival.
6 7
References 8
1. Oberg K, Eriksson B. Endocrine tumours of the pancreas. Best Pract Res Clin 9
Gastroenterol 2005; 19(5):753-81.
10
2. Halfdanarson TR, Rabe KG, Rubin J, et al. Pancreatic neuroendocrine tumors 11
(PNETs): incidence, prognosis and recent trend toward improved survival. Ann 12
Oncol 2008; 19(10):1727-33.
13
3. Lloyd RV OR, Kloppel G, Rosai J, editors. WHO Classification of Tumours of 14
Endocrine Organs 4th edition. . IARC 2017.
15
4. Gao H, Liu L, Wang W, et al. Novel recurrence risk stratification of resected 16
24
pancreatic neuroendocrine tumor. Cancer Lett 2018; 412:188-193.
1
5. Yachida S, Vakiani E, White CM, et al. Small cell and large cell neuroendocrine 2
carcinomas of the pancreas are genetically similar and distinct from well- 3
differentiated pancreatic neuroendocrine tumors. Am J Surg Pathol 2012;
4
36(2):173-84.
5
6. Benetatos N, Hodson J, Marudanayagam R, et al. Prognostic factors and survival 6
after surgical resection of pancreatic neuroendocrine tumor with validation of 7
established and modified staging systems. Hepatobiliary Pancreat Dis Int 2018;
8
17(2):169-175.
9
7. Fesinmeyer MD, Austin MA, Li CI, et al. Differences in Survival by Histologic 10
Type of Pancreatic Cancer. Cancer Epidemiology Biomarkers & Prevention 11
2005; 14(7):1766-1773.
12
8. Gibril F, Doppman JL, Reynolds JC, et al. Bone metastases in patients with 13
gastrinomas: a prospective study of bone scanning, somatostatin receptor 14
scanning, and magnetic resonance image in their detection, frequency, location, 15
and effect of their detection on management. J Clin Oncol 1998; 16(3):1040-53.
16
25
9. Hashim YM, Trinkaus KM, Linehan DC, et al. Regional lymphadenectomy is 1
indicated in the surgical treatment of pancreatic neuroendocrine tumors (PNETs).
2
Ann Surg 2014; 259(2):197-203.
3
10. Krampitz GW, Norton JA, Poultsides GA, et al. Lymph nodes and survival in 4
pancreatic neuroendocrine tumors. Arch Surg 2012; 147(9):820-7.
5
11. Metz DC, Jensen RT. Gastrointestinal neuroendocrine tumors: pancreatic 6
endocrine tumors. Gastroenterology 2008; 135(5):1469-92.
7
12. Nanno Y, Matsumoto I, Zen Y, et al. Pancreatic Duct Involvement in Well- 8
Differentiated Neuroendocrine Tumors is an Independent Poor Prognostic Factor.
9
Ann Surg Oncol 2017; 24(4):1127-1133.
10
13. Jiao Y, Shi C, Edil BH, et al. DAXX/ATRX, MEN1, and mTOR pathway genes 11
are frequently altered in pancreatic neuroendocrine tumors. Science 2011;
12
331(6021):1199-203.
13
14. Scarpa A, Chang DK, Nones K, et al. Whole-genome landscape of pancreatic 14
neuroendocrine tumours. Nature 2017; 543:65.
15
15. Heaphy CM, de Wilde RF, Jiao Y, et al. Altered telomeres in tumors with ATRX 16
26
and DAXX mutations. Science 2011; 333(6041):425.
1
16. Marinoni I, Kurrer AS, Vassella E, et al. Loss of DAXX and ATRX are associated 2
with chromosome instability and reduced survival of patients with pancreatic 3
neuroendocrine tumors. Gastroenterology 2014; 146(2):453-60.e5.
4
17. Asano E, Okano K, Oshima M, et al. Phenotypic characterization and clinical 5
outcome in ampullary adenocarcinoma. J Surg Oncol 2016; 114(1):119-27.
6
18. Edge S BD, Compton CC, et al. AJCC cancer staging manual, 7 edition. Springer 7
2010.
8
19. Chou A, Itchins M, de Reuver PR, et al. ATRX loss is an independent predictor of 9
poor survival in pancreatic neuroendocrine tumours. Hum Pathol 2018.
10
20. Oshima M, Okano K, Muraki S, et al. Immunohistochemically detected 11
expression of 3 major genes (CDKN2A/p16, TP53, and SMAD4/DPC4) strongly 12
predicts survival in patients with resectable pancreatic cancer. Ann Surg 2013;
13
258(2):336-46.
14
21. Frese KK, Tuveson DA. Maximizing mouse cancer models. Nat Rev Cancer 15
2007; 7(9):645-58.
16
27
22. Izeradjene K, Combs C, Best M, et al. Kras(G12D) and Smad4/Dpc4 1
haploinsufficiency cooperate to induce mucinous cystic neoplasms and invasive 2
adenocarcinoma of the pancreas. Cancer Cell 2007; 11(3):229-43.
3
23. Tuveson D, Hanahan D. Translational medicine: Cancer lessons from mice to 4
humans. Nature 2011; 471(7338):316-7.
5
24. Missiaglia E, Dalai I, Barbi S, et al. Pancreatic endocrine tumors: expression 6
profiling evidences a role for AKT-mTOR pathway. J Clin Oncol 2010;
7
28(2):245-55.
8
25. Chung DC, Brown SB, Graeme-Cook F, et al. Localization of putative tumor 9
suppressor loci by genome-wide allelotyping in human pancreatic endocrine 10
tumors. Cancer Res 1998; 58(16):3706-11.
11
26. Rigaud G, Missiaglia E, Moore PS, et al. High resolution allelotype of 12
nonfunctional pancreatic endocrine tumors: identification of two molecular 13
subgroups with clinical implications. Cancer Res 2001; 61(1):285-92.
14
27. Perren A, Komminoth P, Saremaslani P, et al. Mutation and expression analyses 15
reveal differential subcellular compartmentalization of PTEN in endocrine 16
28
pancreatic tumors compared to normal islet cells. Am J Pathol 2000; 157(4):1097- 1
103.
2
28. Chou WC, Lin PH, Yeh YC, et al. Genes involved in angiogenesis and mTOR 3
pathways are frequently mutated in Asian patients with pancreatic neuroendocrine 4
tumors. Int J Biol Sci 2016; 12(12):1523-1532.
5
29. Qian ZR, Ter-Minassian M, Chan JA, et al. Prognostic significance of MTOR 6
pathway component expression in neuroendocrine tumors. J Clin Oncol 2013;
7
31(27):3418-25.
8
30. Chatzipantelis P, Konstantinou P, Kaklamanos M, et al. The role of 9
cytomorphology and proliferative activity in predicting biologic behavior of 10
pancreatic neuroendocrine tumors: a study by endoscopic ultrasound-guided fine- 11
needle aspiration cytology. Cancer 2009; 117(3):211-6.
12
31. Piani C, Franchi GM, Cappelletti C, et al. Cytological Ki-67 in pancreatic 13
endocrine tumours: an opportunity for pre-operative grading. Endocr Relat 14
Cancer 2008; 15(1):175-81.
15 16
Table 1. Clinicopathological Parameters and Outcome (n=100) VariableNo. of Patients (%) Overall Survival (%) Recurrence-Free Survival (%) 3 years5 yearsLog-rank (P Value)
3years 5 years Overall 10094.189.287.285.2 Gender 0.1245 Female 49 (49.0)97.1 97.193.089.1 Male 51 (51.0)91.4 80.882.382.4 Age, years0.749 Mean60.8 (SD, 15.1) Median 63 Range 23-88 <65 55(55.0)93.885.687.787.7 .≥65 45(45.0)94.594.586.982.6 Outcome Follow-up, months Median 43.5 Range 1-147 WHO classification (2010)0.0974 NET G157 (57.0)95.795.797.697.6 NET G243 (43.0)92.182.474.170.0 Tumor Location 0.5429
Head56 (56.0)92.1 85.579.579.5 Body/tail44 (44.0)95.791.892.989.6 Tumor size, mm0.1293 Mean24.3 (SD, 20.8) Median20 Range 0.8-156 ≤20 mm51 (52.6)97.697.6100100 .>20 mm 46 (47.4)94.986.472.668.1 Nodal metastasis 0.0513 Negative77 (77.0)96.994.189.587.1 Positive23 (23.0)84.472.487.274.7 Liver metastasis <.0001 Negative92 (92.0)97.594.988.786.5 Positive8 (8.0)57.142.950.050.0 Type of hormone production0.2424 Non-functioning75(75.0)92.184.285.982.3 Functioning25(25.0)10010090.790.7 Lymphatic invasion0.1963 Negative71(78.0)94.891.586.383.7 Positive20(22.0)94.781.284.484.4 Vascular invasion 0.0142 Negative55(60.4)97.797.797.694.1
Positive36(39.6)90.377.367.167.1 Perineural infiltration 0.0002 Negative67(75.3)98.298.291.889.0 positive22(24.7)84.044.860.760.7 Immunohistochemistry ATRX 0.0558 Negative (loss) 41(41.4)88.684.078.974.3 Positive (intact) 58(58.6)97.993.092.892.8 DAXX 0.7908 Negative (loss) 64(64.6)94.588.183.080.1 Positive (intact) 35(35.4)93.793.795.795.7 MEN1 (Menin)0.5940 Negative (loss) 25(25.3)90.484.083.783.7 Positive (intact) 74(74.7)95.391.288.485.5 TSC2 (tuberin) 0.007 Negative (loss) 58(58.6)89.179.779.374.9 Positive (intact) 41(41.4)10010094.294.2 PTEN 0.0486 Negative (loss) 37(37.8)90.184.184.578.4 Positive (intact) 61(62.2)98.394.088.688.6 p53 0.1975 abnormal (loss) 65(67.0)92.989.087.083.8
normal (intact)32(33.0)10093.485.285.2 Rb1 0.4927 Negative (loss) 45(45.4)92.192.188.284.2 Positive (intact) 54(54.6)95.985.285.685.6 P16 0.3067 Negative (loss) 29(29.3)96.087.385.185.1 Positive (intact) 70(70.7)95.091.688.585.6
TSC2 and ATRX negative 10.1 2.1-66.9 0.003
Vascular invasion 10.9 1.3-10.3 0.02
Nodal metastasis 5.8 1.2-29.3 0.02
Perineural invasion 2.1 0.5-10.3 0.46
Nodal metastasis 0.014 Tumor size (>20 mm) 0.021
Recurrence 0.041
MEN1 negative (loss) 25 Hormone production 0.003
Venous invasion 0.012
Grade 0.02
Liver metastasis 0.023
Tumor size (>20 mm) 0.029 TSC2 negative (loss) 58 Hormone production 0.0008
Nodal metastasis 0.001
Recurrence 0.01
Liver metastasis 0.019
Tumor size (>20 mm) 0.024
Venous invasion 0.03
PTEN negative (loss) 32 Venous invasion 0.007 Tumor size (>20 mm) 0.02
Recurrence 0.044
Figur e 1
Log-rank 0.011ATRX (‐),
ATRX 0.20.40.60.8
1.0 012243648607284 RFSmonth
AT R X p o si ti ve (in tact) A AT R X n eg at B C D Relapse‐Free Survival (probability)
Over all Surviv
al (pro bability)
Log-rank 0.0550.2
0.4
0.6
0.8
1.0 01224364860728496108120 OS monthsATRX (‐), n=41
ATRX (+), n=58
Figur e 2
0.20.40.60.81.0 012243648607284 RFSmonthTSC2 (+), TSC2 (‐), Log‐rank 0.009
TS C 2 p o si ti ve (in tact) A TS C 2 n eg B C D
Over all Surviv
al (pro bability)
Rela pse
‐Free Surviv al (pro
babilit y)
Log‐rank 0.007 0.2
0.4
0.6
0.8
1.0 01224364860728496108120
TSC2 (+), n=41 TSC2 (‐), n=58 OS months
Figur e 3 PTEN positiv e (in tact) A PTEN neg B C D
Over all Surviv
al (pro bability)
Rela pse
‐Free Surviv al (pro
babilit y)
Log‐rank 0.04 Log‐rank 0.07 OS months
0.2
0.4
0.6
0.8
1.0 01224364860728496108120
0.2
0.4
0.6
0.8
1.0 012243648607284
PTEN (+), PTEN (‐),
PTEN (+), n=61 PTEN (‐), n=37 RFS month
Figur e 4
0.20.40.60.81.0 012243648607284 RFSmonthsTSC2 (+) and ATR TSC2 (‐) and ATRX (‐), n=31
TSC2 or ATRX (‐),
B
Relapse-Free Survival (probability)A
Overall Survival (probability) 0.20.40.60.81.001224364860728496108120 OS months
TSC2 (+) and ATRX (+), n=31 TSC2 (‐) and ATRX (‐), n=31
TSC2 or ATRX (‐), n=37 TSC2 (+) and ATRX (+) TSC2 or ATRX (‐) TSC2 (‐) and ATRX (‐)P=0.11P=0.14 P=0.008 Log‐rank test
TSC2 (+) and ATRX (+) TSC2 or ATRX (‐) TSC2 (‐) and ATRX (‐)P=0.005P=0.73 Log‐ran