National Burden and Economic Inequality:
Micro-Simulation Analysis
*1, 2Masumi Kawade
College of Economics, Nihon University
Abstract
In order to regain the soundness of the fiscal position, which has been damaged by the population aging and a series of economic stimulus measures, it is inevitable to increase tax revenues and impose a heavier burden of social insurance payment. On the other hand, there are concerns that the increase in such national burdens will impose excessive loads on low- income households, so it may be an obstacle to implement the fiscal restoration. Therefore, this paper conducts micro-simulation analysis that is able to compute the burdens of income and consumption tax payments and social insurance payments using the Keio Household Panel Survey (KHPS). First, using the individual household’s data of the KHPS for 2009 to 2012, we recalculated the amounts of tax payments and social insurance premium payments by applying the tax and social security systems of relevant years to income between 2008 to 2011. Then, we obtained the equivalent gross income of each household by adding the public transfer amount and conducted evaluation based on the decile division of income.
Next, we estimated the hypothetical national burden by applying the tax and social insurance systems of FY2015 to income between 2008 and 2011. As a result, it was found that the increases in the burden of social insurance payments and the consumption tax hike are imposing a relatively large burden on low-income households. And the structure of national burden among income classes is flattening because the increase of national burden of high-income households was limited in percentage terms compared with the increase for low-income households. Due to a possible increase in social insurance payments and the consumption tax hike in the future, a further flattening will go on.
And we implemented four modifiable policy simulation scenarios ̶(i) reduction of the salary income deduction, (ii) reduction of the upper limit on the public pension, etc. deduction, (iii) introduction of an upper limit on the social insurance deduction and (iv) gradual reduction of the spouse deduction in accordance with the income level̶with respect to the estimated figures for 2008 to 2011, which were obtained by applying the tax and social insurance systems of FY2015, and conducted impact evaluation concerning a case of small reduction (standard case) and a case of large reduction (reform case). As a result, it was found that gradual reduction of the spouse deduction in accordance with the income level, reduction of the salary income deduction/introduction of the upper limit on the social insurance deduction,
*1 This paper is supported by Grant-in-Aid for Scientific Research (C), MEXT KAKENHI Grant Number JP26380376, The Ministry of Education, Culture, Sports, Science and Technology (MEXT).
*2 This paper is conducted by provision of Keio Household Panel Survey (KHPS) by Keio University.
and reduction of the upper limit on the public pension, etc. deduction (in a magnitude order) will impose progressively larger burdens on low-income households in that order, compared with high-income households. However, in both cases, the effect of each individual measure alone in expanding the taxation base is limited. As a result, in the standard case in particular, the increase in the burden will be limited in both absolute and percentage terms, and in the reform case, the increase in the burden in percentage terms will not be sufficient.
Moreover, we calculated how much the national burden on lower income households can be mitigated through the use of the additional tax revenues estimated above. We found that if all the measures are implemented, the national burden in percentage terms can be reduced by up to 2% for households in the first decile bracket, the lowest income bracket in the standard case and by around 7.5% in the reform case.
These findings indicate that reducing income deductions, which benefit especially high- income households, will be an effective tax measure from the viewpoint of correction of the structure of the national burden among income classes, which is getting flat under the recent increase of national burden. However, not only will reducing income deductions have only a limited effect in increasing the burden on high-income households, but also around half of such households will not be affected by the measure. Therefore, reducing some income deductions alone will have only a limited effect in correcting the flattening of the burden due to future increases in tax and social insurance payments. So, it is necessary to consider the preferable national burden, by reviewing the relationship between income deductions in general and social insurance payments.
Keywords: individual taxation, social security burden, income inequality JEL Classification: H23, H55, C23
I. Introduction
The fiscal condition of Japan is getting worse under the aging economy, several counter cyclical measures and huge natural disasters like the Great East Japan Earthquake. In fact, the measures for raising taxes had been implemented by the raise of the consumption tax rate in 2014 and various revision of the income deductions. And the national burden for the economy, which is defined by the tax burden plus social insurance premium, is also an important issue because the aging population also increases the social insurance premium.
On the other hand, the improvement of household income levels does not seem to be equal because there is a mixed picture of the people who receive the benefit by Abenomics and who do not receive it enough by progress of part-time employment or population aging.
Kitamura and Miyazaki (2012) indicate that economic inequality is getting wider and Abe (2008) indicates the increase of low income households.
In Japan, the taxation and social security systems are usually discussed separately, but the total burden is most important for households. There are many examples of wide-ranging
research which focus on the relationship between the taxation and social security systems while integrating both systems; Doi (2010), Tanaka et al. (2013), Ohno et al. (2014), Matsuda et al. (2014), Yashio and Hachisuka (2014). But it is also valuable to investigate the impacts of the recent transition of the national burden on economic inequality because existing research is focused on the specific topics between both systems.
Therefore, this paper conducts a micro-simulation analysis that is able to compute the burdens of income and consumption tax payments and social insurance payments using the Keio Household Panel Survey (KHPS). First, by using the individual household’s data from 2009 to 2012 in KHPS, we recalculate the amount of tax payments and amounts of the social insurance premium payments by applying the taxation and social security systems of relevant years to income between 2008 to 2011. Then, we obtained the equivalent gross income of each household by adding the public transfer amount and evaluated them by summarizing the decile division of income. The amount and percentage of the national burden of each equivalent gross income is evaluated by summarizing in the decile brackets.
Next, we estimated the hypothetical national burden by applying the taxation and social insurance systems of FY2015 to the incomes from 2008 to 2011. By comparing with the actual and hypothetical burden, we can find which class of the household income increases the national burden relatively. And we can also evaluate the effects of economic fluctuation, particularly during the financial crisis in 2008, which began in September, as income decreased soon after.
Based on the standard comparative analysis above, we implemented four policy simulation scenarios ̶(i) reduction of the salary income deduction, (ii) reduction of the upper limit on the public pension, etc. deduction, (iii) introduction of an upper limit on the social insurance deduction and (iv) gradual reduction of the spouse deduction in accordance with the income level̶with respect to the estimated figures for 2008 to 2011, which were obtained by applying the tax and social insurance systems of FY2015, and conducted impact evaluation concerning a case of small reduction (standard case) and a case of large reduction (reform case). In each simulation scenarios, we calculated the gap of the national burden of each household from the FY2015 cases on an absolute and a percentage basis.
Moreover, we calculated how much the national burden on lower income households can be mitigated through the use of the additional tax revenues estimated above. The increases in tax revenue in each scenario reduce the national burden for lower-income classes by simple calculation. It will be important for the future reforms to evaluate the magnitude of the reduction of lower income households’ tax burden by the contraction of income deduction.
The paper is organized as follows: Section 2 describes the data and calculation methods, Section 3 shows basic results of an actual national burden from 2008 to 2011 by using panel data from 2009 to 2012, Section 4 calculates the hypothetical national burden by applying the tax and social insurance systems of FY2015 to income between 2008 and 2011, Section 5 examines policy simulation by reducing income tax deductions, Section 6 evaluates the magnitude of the national burden reduction for lower income households by the tax revenue increases of the previous simulation, and Section 7 concludes.
II. Data and Calculation Method
This paper uses the Keio Household Panel Survey (KHPS) in order to assess the gross income of each household and the tax and social insurance payment. KHPS is long-term panel data, which has collected the individual data of 4,000 households and 7,000 people since 2004. It covers detailed individual information in each household; family relations, individual income, employment status etc.1
Though KHPS has been available since 2004, we use the individual household data from 2009 to 2012 because we need detailed information on individual income and expenditure etc. KHPS collects the information in January of each year and the income information is answered by 10,000 yen units. And we have to care about the different timing of the answered information; income information is answered on the previous year’s basis, but the expenditure items are asked only about January, and that is on a one month basis.
And income tax is taxed on the individual income on a current year basis and inhabitant tax is on a previous year basis. Although we can apply the information by using the characteristics of the panel data, we apply the inhabitant tax on the income of the current year to keep the sample size. And some individual social security payments are obtained in the questionnaire, but we calculate it by the income information to keep a consistent relationship between income and social insurance premiums.
II-1 Calculation of Income
Income information is asked as “Income of the Last Year” and its detailed information is answered such as “Annual employment income,” “Self-employment, business, home work income,” “Rent & land rent income,” “Interest & dividends,” “Remittances & gifts,” “Public pension,” “Corporate & personal pensions,” “Unemployment benefits & child-care leave benefits,” “Child allowances and childcare allowances,” “Welfare benefits” and “Other income.” Especially, “Annual employment income” is used as the supplemental information for the monthly employment and bonus income which is needed to calculate the social insurance payment2. We calculate the total payment of tax and social insurance premiums after assessing their payment of each person of a household. However, the information of income is obtained only in three categories; respondent, its spouse and other family total (the total of the other members of the family). We here denote the year of the surveyed information by the timing of the obtained income, which is the previous year of the survey year of KHPS.
1 To recover sample size by reduction of the respondents, KHPS adds new sample; about 1,400 people in 2004 and about 1,000 people in 2012. In 2015, KHPS was integrated with Japan Household Panel Survey (JHPS), which started in 2009, and renamed as JHPS.
2 Severance income is asked for, but years of continuous employment is not in KHPS. We exclude the severance income in the household’s income, because we don’t have the information on the years of continuous employment to calculate tax on severance income.
Monthly employment income is obtained by dividing “Annual employment income”
minus “Bonuses of Last Year” by 12 months. We define an alternative annual employment income, if the question of “Annual employment income” was not answered but “Monthly Salary” and “Bonuses of Last Year” were done. And we divide “Bonuses of Last Year” by 2, because they usually are given twice a year in Japan. The other members’ income is calculated by dividing “Other Family Total” by the number of working member and 12 months.
We define “Public pension,” “Corporate & personal pensions,” “Unemployment benefits
& child-care leave benefits,” “Child allowances and childcare allowances,” and “Welfare benefits” as public transfer. If gross annual income of the household is less than 120,000 yen, we eliminate the sample from our analysis in terms of the validity of the answer.
II-2 Calculations of Social Insurance Premiums
Social insurance premiums are calculated on the public pension, the health insurance, the care insurance, and the unemployment insurance3. A full-time worker, whose company employs more than 5 employees, is assumed to join the employees’ pension plan, Japan health insurance association and unemployment insurance, but not in the employees’ pension fund. Each premium is calculated by standard monthly remuneration and standard bonus remuneration in each year, which is applied by the insurance premiums of the Tokyo metropolitan area.
If “Contract employee”, “Part-time worker”, “Subcontracted worker” and “Specialized contract employee” earn an income of more than 1.3 million yen, we treat them the same as a full-time worker. In other cases, they join in the national pension plan, national health insurance and care insurance. For simplicity, civil-service workers are assumed to join the national public service mutual aid association, Ministry of Finance, which is one of the largest associations.
In the national pension system, a premium reduction or exemption is applied for lower income households. For simplicity, the premiums of the national health insurance and the care insurance is assumed to be the insurance premium of Nakano-ku, Tokyo, because they are decided by each municipal level and are complicated. In the national health insurance and care insurance, we also apply premium reduction or exemption for lower income households.
For persons who decide not to join the social insurance plan and not to be a full-time worker are treated as uninsured.
II-3 Calculations of Tax Payment
We calculate the amounts of the tax burden, such as the income tax, the inhabitant tax and
3 KHPS asks about some actual social insurance premiums. But most of them are underreported, compared with legal premiums, as indicated in Ohno et al. (2015), which investigated it in the National Survey of Family Income and Expenditure and Family Income and Expenditure Survey.
the consumption tax. Amounts of income tax and inhabitant tax are taxed on the basis of
“Annual employment income,” “Self-employment, business, home work income,” “Rent &
land rent income,” “Interest & dividends,” “Public pension,” “Corporate & personal pensions”
and “Other income.” “Annual employment income,” “Public pension,” and “Corporate &
personal pensions” are applied to some income allowances; the salary income deduction and the public pension, etc. deduction. “Interest & dividends” is also applied to the tax credit for dividends when the reported income is at least more than 10,000 yen. After summing up all incomes, we calculate the taxable income, which applies the basic deduction, social insurance deduction, spouse deduction, spouse special deduction, dependents deduction and widow deduction4. The tax rate of income tax is progressive (5 – 40%), and the inhabitant tax is 10%. If the respondent provides the amount of a housing loan tax credit, it is also reduced from the tax amount.
The amount of consumption tax in each household is obtained by multiplying the total consumption by the consumption tax rate. In KHPS, the questionnaire for total spending is only on the January of the surveyed year. We assume that the total expense represents the typical expenditure all year around, and regards the annual expense as the answered expense which is multiplied by 12.
The items, which the consumption tax levied is on, are “Food,” “Eating out & school lunches,” “Multi-family housing common charges,” “Electricity, gas, water,” “Furniture, electric appliances, household supplies,” “Digital consumer electronics purchases,” “Clothing
& shoes,” “Healthcare,” “Transportation,” “Communications,” “Internet communications,”
“Education,” “Culture & amusement,” “Entertaining & pocket money” and “Other expenditures.” The other items, “Rent, land rent, home repairs” and “Remittances”, are assumed not to be taxed because “Rent, land rent, home repairs” is mainly covered by rents which are not taxed by the consumption tax and “Remittances” is unclear as to whether it is spent on taxable items.
III. Basic Results
We calculate amounts of the tax burden, such as the income tax, the inhabitant tax and the consumption tax. The amounts of income tax and inhabitant tax are levied on the basis of
“Annual employment income,” “Self-employment, business, home work income,” “Rent &
land rent income,” “Interest & dividends,” “Public pension,” “Corporate & personal pensions”
and “Other income.” “Annual employment income,” “Public pension,” and “Corporate &
personal pensions” are applied on some income allowances; the salary income deduction and the public pension, etc. deduction. “Interest & dividends” is also applied to the tax credit for dividends when the reported income is at least more than 10,000 yen.
After summing up all incomes, we calculate the taxable income, which is applied to the
4 For the lack of information, life insurance premiums deduction, earthquake insurance deduction and exemption for handicapped persons are applied.
basic deduction, the social insurance deduction, spouse deduction, spouse special deduction, dependents deduction and widow deduction. As described in Section 2, we calculate the national burden and transfer in each household and their averages in each decile of the equivalent gross income.
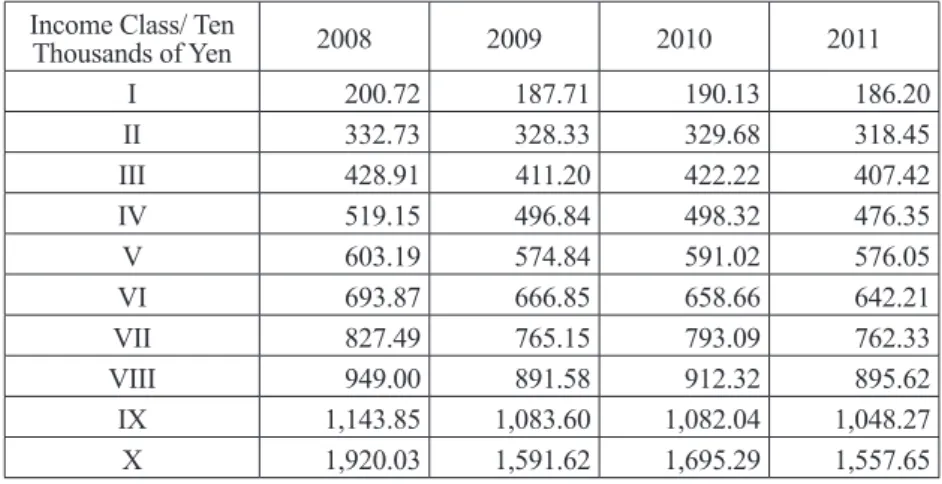
In table 1 and table 2, we summarize the averages of the equivalent gross income and gross income in each decile of the equivalent gross income. Table 1 shows that the households of the equivalent gross income are dense around 4 million yen. The income of households is relatively higher in 2008 than in the other years.
Table 2 indicates it clearly because the number of household members are not adjusted.
Especially in 2011, their incomes were the lowest from 2008 to 2011 because the Great East Japan Earthquake did serious damage to the Japanese economy. Even though there were some fluctuations in income, the average of each households’ income in KHPS were almost stable.
Table 1. Averages of Equivalent Gross Income in Each Decile Income Class/ Ten
Thousands of Yen 2008 2009 2010 2011
I 123.21 115.88 119.81 118.79
II 203.88 195.99 201.84 198.25
III 253.17 244.03 249.72 245.41
IV 303.03 288.38 293.97 287.23
V 352.06 337.07 342.01 331.64
VI 412.44 390.09 393.31 380.67
VII 490.52 459.83 462.32 446.89
VIII 581.69 548.32 555.16 531.24
IX 732.97 673.74 688.27 654.37
X 1,316.61 1,129.61 1,165.53 1,069.63
Table 2. Averages of Gross Income in Each Decile Income Class/ Ten
Thousands of Yen 2008 2009 2010 2011
I 200.72 187.71 190.13 186.20
II 332.73 328.33 329.68 318.45
III 428.91 411.20 422.22 407.42
IV 519.15 496.84 498.32 476.35
V 603.19 574.84 591.02 576.05
VI 693.87 666.85 658.66 642.21
VII 827.49 765.15 793.09 762.33
VIII 949.00 891.58 912.32 895.62
IX 1,143.85 1,083.60 1,082.04 1,048.27
X 1,920.03 1,591.62 1,695.29 1,557.65
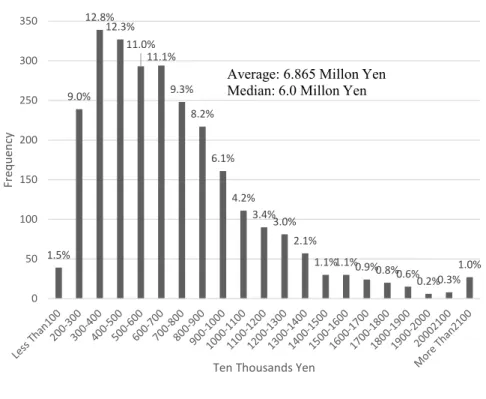
Figure 1 indicates the histogram of the households’ income. Compared with the existing survey of household income in Japan, such as the Comprehensive Survey of Living Conditions, gross income of sample households in KHPS is higher by about 1.5 million yen.
In figure 2, their gaps between our calculation and existing surveys are reduced by about 1 million yen in terms of the after tax income.
Figure 3 shows the rate of national burdens to gross income in 2011, such as income tax, inhabitant tax, consumption tax, public pension, health insurance, care insurance and unemployment insurance. In figure 3, income tax, inhabitant tax and public pension are progressive over the households’ income, and health insurance and unemployment insurance are neutral, and consumption tax and care insurance are regressive. And the burden rates in public pension and health insurance clearly drop in the lowest and highest income class.
Figure 4 indicates that the largest shares of national burden in the first decile (denoted by the I-bracket), which are the lowest income households, are consumption tax and health insurance premiums, and the share of consumption tax is decreasing according to income increases, and the share of income tax and inhabitant tax increases on the contrary.
The national burden rate of the X-bracket (the tenth decile) is the highest in all income classes. However, the share is 20% at most. Regardless of each income level, the rate of national burden, such as tax and social insurance premium, represents the sense of the national burden. Especially, low income households recognize the heavy burden for the consumption tax and health insurance but high income households do it for income tax and inhabitant tax.
Table 3 shows average amounts of national burden in each decile in 2011. Low-income households (I-bracket) are levied by income tax and inhabitant tax, but they are less than 10,000 yen. On the other hand, high-income households (X-bracket) are taxed by 2.05 million yen. The I-bracket bears a consumption tax of 100,000 yen and social insurance premium of about 150,000 yen. The X-bracket bears a consumption tax of 273,000 yen and social insurance premium of about 1.4 million yen.
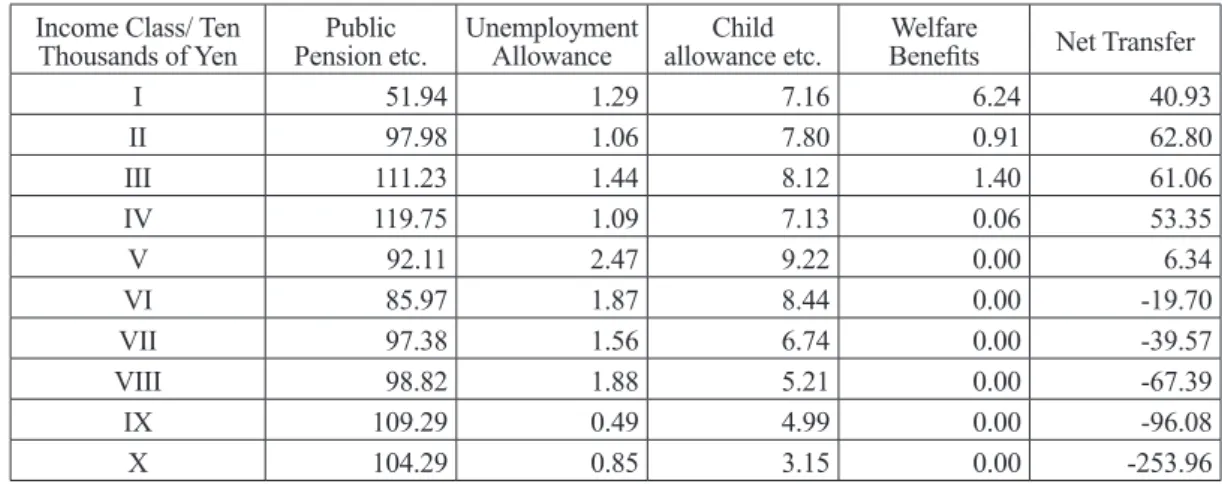
Table 4 shows components of public transfer and net public transfers per household in income class. In Table 4, the public transfer mainly comes from public pension income not only for low-income, but also high-income households. And the amount of public pension income for the I-bracket is about half of the other classes. So net public transfer in the I-bracket is less than in the II-bracket.
The national burden system by income tax, inhabitant tax and national burden is progressive among income classes, but the burden levels of consumption tax, health insurance and public pension are high in low-income households. The consumption tax rate rose in 2014 and legally systematic increases of social insurance premium continued after 2011. This trend will continue more obviously in the future. Therefore, it is beneficial to consider the reform of the national burden for a relief of the excess burden for low-income households. In Section 4, we recalculate the amount of tax payments and the amount of social insurance premium payments by applying the tax and social insurance systems in 2015 (fiscal year;
denoted by FY2015) to income between 2008 to 2011.
Figure 1. Histogram of Households’ Income
1.5%
9.0%
12.8%
12.3%
11.0%
11.1%
9.3%
8.2%
6.1%
4.2%
3.4%3.0%
2.1%
1.1%1.1%0.9%0.8%0.6%0.2%0.3%1.0%
0 50 100 150 200 250 300 350
Frequency
Ten Thousands Yen
Average: 6.865 Millon Yen Median: 6.0 Millon Yen
Figure 2. Histogram of Households’ After Tax Income
1.7%
12.2%
15.8%
15.3%
13.4%
11.7%
9.3%
6.2%
4.4%
3.1%
1.9%1.8%
1.0%0.6%0.3%0.4%0.1% 0.1%0.1%0.5%
-30 20 70 120 170 220 270 320 370 420
Frequency
Ten Thousands Yen
Average: 5.739 Millon Yen Median: 5.134 Millon Yen
Figure 3. Rates of Each National Burden in Gross Income in 2011
0%
1%
2%
3%
4%
5%
6%
7%
I I I I I I I V V V I V I I V I I I I X X
Income Tax Inhabitant Tax Consumption Tax Public Pension Health Insurance Care Insurance Unemployment Insurance
National Burden Rate
Income Class
Figure 4. Details of National Burden in Each Decile in 2011
0%
5%
10%
15%
20%
25%
I II III IV V VI VII VIII IX X
Income Tax Inhabitant Tax
Consumption Tax Public Pension Health Insurance Care Insurance Unemployment Insurance
National Burden Rate
Income Class
Table 3. Averages of National Burden in 2011
Income Class/
Ten Thousands
of Yen Income Tax Inhabitant Tax Consumption
Tax Public Pension Health
Insurance Care Insurance Unemployment Insurance
I 0.21 0.57 10.38 5.01 7.35 2.07 0.12
II 0.98 2.56 13.05 11.53 11.69 3.82 0.45
III 1.96 4.96 15.32 18.30 15.29 4.22 0.85
IV 2.73 7.01 16.74 22.27 19.94 4.40 1.09
V 5.29 11.74 17.19 31.38 25.42 4.31 1.58
VI 7.29 15.60 20.14 37.96 27.77 4.62 1.87
VII 13.83 22.89 20.41 43.97 35.71 4.92 2.22
VIII 18.09 28.45 23.77 52.84 41.02 5.79 2.74
IX 31.15 38.67 24.11 58.86 46.88 6.22 2.85
X 123.50 81.97 27.32 71.43 58.03 7.06 4.17
IV. The hypothetical national burden by applying the tax and social insurance systems of FY2015
We calculate the amount of hypothetical national burden by applying the tax and social insurance systems of FY2015 to income between 2008 to 2011. The major reforms of the national burden system are as follows. In income tax, the maximum tax rate for the household, who earns more than the taxable income of 40 million yen, was raised from 40% to 45% in 2015. In 2013, the upper limit of employment income deduction was set by 2.45 million yen.
In 2014, a reconstruction special income tax was introduced by 2.1% of the gross income tax and consumption tax rate was raised from 5% to 8%.
The social insurance premiums in FY2015 apply to relevant incomes from 2008 to 2011.
And a reform of estimation method for household income in the health insurance in Nakano- ku, Tokyo, was changed from an inhabitant tax basis to an approximated income basis. We do not change public transfers in each relevant year because we focus on the national burden5.
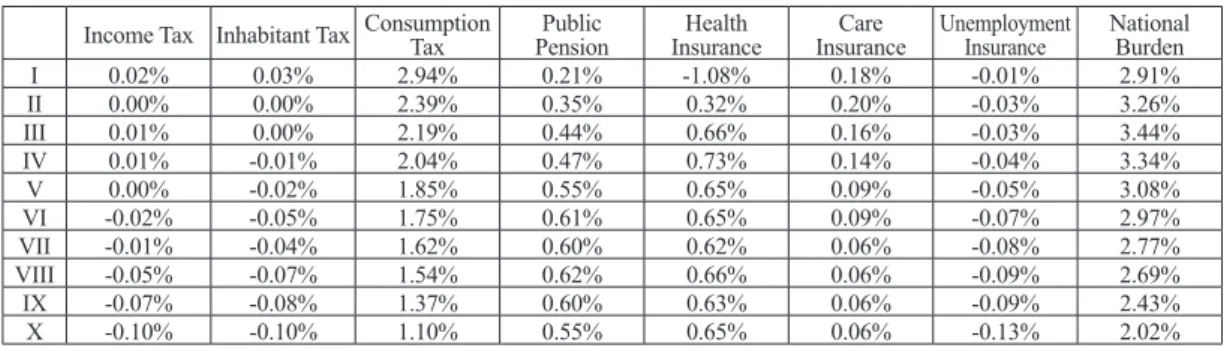
In Table 5 and Table 6, the results are shown in 2008, when the income level is the highest and the national burden is relatively low, and in 2011, when the income level is the lowest and the national burden is high. In 2008 and 2011, it is common to decrease the tax burden of income tax and inhabitant tax for high-income households, despite the introduction of an upper limit of employment income deduction, a raise of the maximum income tax rate and the introduction of the reconstruction special income tax.
This result is caused by an expansion of deduction for social insurance premium with an increase of social insurance premium. The problems of deduction for social insurance
5 Special benefits in 2015, such as extraordinary welfare benefits for pension recipients, extraordinary welfare benefits and extraordinary welfare benefits for families with small children are not applied. We do not strictly calculate hypothetical redistributed income in 2015.
Table 4. Components of Public Transfer and Net Public Transfer in 2011 Income Class/ Ten
Thousands of Yen Public
Pension etc. Unemployment
Allowance Child
allowance etc. Welfare
Benefits Net Transfer
I 51.94 1.29 7.16 6.24 40.93
II 97.98 1.06 7.80 0.91 62.80
III 111.23 1.44 8.12 1.40 61.06
IV 119.75 1.09 7.13 0.06 53.35
V 92.11 2.47 9.22 0.00 6.34
VI 85.97 1.87 8.44 0.00 -19.70
VII 97.38 1.56 6.74 0.00 -39.57
VIII 98.82 1.88 5.21 0.00 -67.39
IX 109.29 0.49 4.99 0.00 -96.08
X 104.29 0.85 3.15 0.00 -253.96
premium and contraction of income tax base are indicated by Tajika and Yashio (2008) and Matsuda et al. (2014).
Table 7 indicates the share of the changes of the income tax and the inhabitant tax between actual and hypothetical national burden, from the I-bracket to the III-bracket and from the VIII-bracket to the X-bracket. In both taxes, the tax burden of more than 80% of household decreased. Social insurance premium increased by 2% in 2008 and by 1% in 2011. In Table 6, we can find the compensation of social insurance premiums by income and inhabitant tax.
The number of households which earn taxable income of more than 40 million yen is very small; 3 households out of 3,335 in 2008, 0 households out of 3,117 in 2009, 1 household
Table 5. Relative Changes of National Burden in 2008 under Public System in FY2015
Income Tax Inhabitant Tax Consumption Tax Public
Pension Health
Insurance Care
Insurance Unemployment
Insurance National Burden
I 0.06% 0.14% 2.88% 0.46% 0.75% 0.24% -0.01% 4.88%
II 0.10% 0.23% 2.43% 0.70% 1.36% 0.26% -0.03% 5.09%
III 0.14% 0.28% 2.19% 0.77% 1.27% 0.22% -0.03% 4.84%
IV 0.18% 0.31% 1.98% 0.90% 1.16% 0.18% -0.04% 4.67%
V 0.22% 0.25% 1.76% 0.92% 1.06% 0.16% -0.05% 4.34%
VI 0.17% 0.10% 1.65% 0.99% 1.04% 0.17% -0.08% 4.05%
VII 0.14% 0.02% 1.55% 1.00% 1.05% 0.14% -0.09% 3.83%
VIII 0.04% -0.04% 1.48% 1.00% 1.01% 0.14% -0.11% 3.53%
IX -0.08% -0.12% 1.32% 1.01% 1.12% 0.16% -0.11% 3.31%
X -0.19% -0.14% 1.05% 0.83% 1.14% 0.12% -0.16% 2.65%
Table 6. Relative Changes of National Burden in 2011 under Public System in FY2015
Income Tax Inhabitant Tax Consumption Tax Public
Pension Health
Insurance Care
Insurance Unemployment
Insurance National Burden
I 0.02% 0.03% 2.94% 0.21% -1.08% 0.18% -0.01% 2.91%
II 0.00% 0.00% 2.39% 0.35% 0.32% 0.20% -0.03% 3.26%
III 0.01% 0.00% 2.19% 0.44% 0.66% 0.16% -0.03% 3.44%
IV 0.01% -0.01% 2.04% 0.47% 0.73% 0.14% -0.04% 3.34%
V 0.00% -0.02% 1.85% 0.55% 0.65% 0.09% -0.05% 3.08%
VI -0.02% -0.05% 1.75% 0.61% 0.65% 0.09% -0.07% 2.97%
VII -0.01% -0.04% 1.62% 0.60% 0.62% 0.06% -0.08% 2.77%
VIII -0.05% -0.07% 1.54% 0.62% 0.66% 0.06% -0.09% 2.69%
IX -0.07% -0.08% 1.37% 0.60% 0.63% 0.06% -0.09% 2.43%
X -0.10% -0.10% 1.10% 0.55% 0.65% 0.06% -0.13% 2.02%
Table 7. Distribution of Income Tax and Inhabitant Tax Changes
Share in Total Households I-III Total XIII-X Total
2008 2011 2008 2011
Increase more than 100 Thousand Yen 3.90% 0.12% 8.73% 1.19%
Increase less than 100 Thousand Yen 24.08% 10.53% 12.34% 10.39%
Constant 0.00% 0.00% 1.50% 2.99%
Decrease less than 100 Thousand Yen 53.95% 59.29% 77.43% 85.42%
Decrease more than 100 Thousand Yen 18.08% 30.06% 0.00% 0.00%
out of 2,959 in 2010, and 2 households out of 2,796 in 2011. As indicated by Doi and Park (2011), the effect of a raise in the maximum tax rate is very limited.
In 2008, the tax burden of income tax, below the VIII-bracket in 2008 and below the V-bracket in 2011, increases. This is caused by the abolishment of the deduction for specific dependents and junior dependents and the introduction of the reconstruction special income tax. However, the tax burden of high income households decreases income tax by the excess compensation of social insurance premiums. On the other hand, the effect of an increase of the consumption tax rate has been decreasing from 2.9% in the I-bracket to 1.1% in the X-bracket, as indicated in Yashio and Hasegawa (2009).
By increase of national burden, for high income households, the rate of income tax is decreasing and the rate of consumption tax is smaller than lower income households.
Meanwhile, for low income households, the national burden increases uniformly. That is why consumption tax and social insurance premiums are almost equally paid, irrelevant for the level of income. Of course, in FY2015, several welfare benefits were introduced such as the improvement of child-care allowance and special welfare benefits for consumption tax rate increases, in accordance with the tax raises, which we do not incorporate in this evaluation. However, the function of income gap adjustments by the national burden system is weakening under the increase of current social insurance. Figure 5 compares the adjusted average of the actual national burden rate from 2008 to 2011, which shifts by +2.4% to fit the average of the hypothetical national burden in the X-bracket, with hypothetical national burden rate applied with the national burden in FY2015. The slope of actual national burden among income classes is progressive, but that of the hypothetical national burden system in FY2015 was eased.
As a result, it was found that the increases in the burden of social insurance payments and the consumption tax hike are imposing a relatively large burden on low-income households.
And the structure of national burden among income classes is flattening because the increase Figure 5. National Burden Rate in Each Decile from 2008 to 2011
14%
16%
18%
20%
22%
24%
26%
National Burden of XBracket
National Burden of Ibracket
The burden rate increases according to lower income
I II III IV V VI VII VIII IX X
2008 2009 2010 2011 Average Actual Burden +2.4%
Income Class
National Burden Rate
of national burden of high-income households was limited in percentage terms compared with the increase for low-income households. Due to a possible increase in social insurance payments and the consumption tax hike in the future, a further flattening will go on6.
These results suggest that the widening income gap of recent concern is promoted by defects in the national burden system. Especially for low income households, overall reform will be needed, separately from the individual reform of tax and social insurance.
In section 6, we examine a policy simulation of the tax system except for a raise of the maximum tax rate for the highest income, which had little effect in FY2015, in order to levy more tax burden on the high income households.
V. Policy Simulation
In this section, we prepare the alternative policy simulation scenarios to levy more tax burden on high income households, because recent increases of the national burden were imposed mainly on lower-income households in terms of a national burden rate basis, not on higher-income households. Tajika and Yashio (2006) conduct the simulation abolishing all income deductions, but we consider the policy simulation to increase the national burden only for higher-income households.
Then we mainly focus on the increase of the tax base by contraction of tax deductions, not on the rise of income and inhabitant tax rate. We estimate the change of the national burden of each household income from 2008 to 2011 which is applied to the national burden system of FY2015. The policy simulation scenarios are as follows; (i) reduction of the salary income deduction, (ii) reduction of the upper limit on the public pension, etc. deduction, (iii) introduction of an upper limit on the social insurance deduction, and (iv) gradual reduction of the spouse deduction in accordance with the income level. And we conduct impact evaluations concerning a case of small reductions (standard case) and a case of large reductions (reform case).
Table 8 indicates the list of policy simulation scenarios. The current upper limit of the salary income deduction is set to 2.4 million yen, and in the scenario (i) of the standard case [denoted as SA-A], the upper limit is decreased to 2.2 million yen, which will be applied from 2017, and in that of the reform case [denoted as SA-B], the upper limit is decreased to 1.8 million yen. There is no upper limit for the current deduction for Public Pension etc. In the scenario (ii) of the standard case [denoted as PN-A], we introduce the upper limit of 1.2 million yen, which is the minimum amount of the deduction and in the scenario (ii) of the reform case [denoted as PN-B], to 800,000 yen. There is no upper limit for the current deduction for the social insurance premium. In the scenario (iii) of the standard case [denoted as SI-A], we introduce the upper limit of 1.5 million yen and in the scenario (iii) of the
6 As indicated in Tajika and Furutani (2005) and Yashio and Hachisuka (2014), the erosion of the tax base will continue by the public pension, etc. deduction. And we have to consider the unexpected various erosions of the tax base.
reform case [denoted as SI-B], 1 million yen. In the current spouse deduction, a gradual reduction is introduced only for the spouse special deduction. We consider a gradual reduction for both deductions. In the scenario (iv) of the standard case [denoted as SP-A], the deduction reduces 16,500 yen for every 10,000 yen increase of taxable income from 8 million yen to 10 million yen and the deduction becomes zero at a taxable income of 10 million yen. In the scenario (iv) of the reform case [denoted as SP-B], the reduction is implemented from 4 million yen to 8 million yen. In both cases, the spouse special deduction is also linearly reduced to keep the current amount of deduction at the initial taxable income and to make zero at each maximum taxable income.
As a result, it was found that a gradual reduction of the spouse deduction in accordance with the income level, reduction of the salary income deduction/introduction of the upper limit on the social insurance deduction, and reduction of the upper limit on the public pension, etc. deduction (in a magnitude order) will impose progressively larger burdens on low- income households in that order, compared with high-income households. However, in both cases, the effect of each individual measure alone in expanding the taxation base is limited.
As a result, in the standard case in particular, the increase in the burden will be limited in both absolute and percentage terms, and in the reform case, the increase in the burden in percentage terms will not be sufficient.
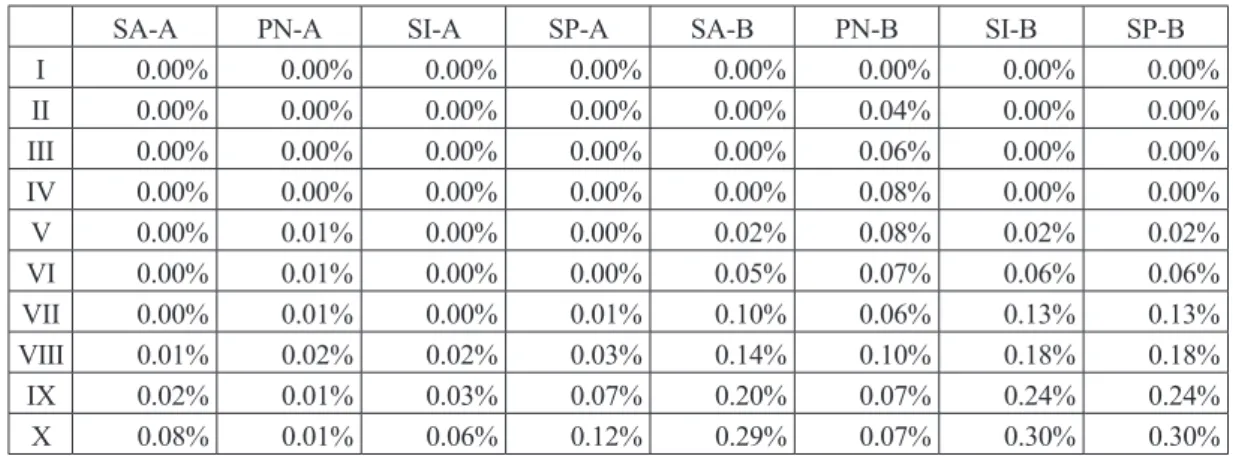
Table 9 shows the average change of the tax burden rate combined with the income and inhabitant tax in each household, and Table 10 shows the averaged change of the amount of tax burden in each household. In both tables, there is little effect on low income households, but the tax burden increases in higher income households in all policy simulation scenarios.
However, there is little impact of PN-A on national burden in higher income households. In terms of the national burden rate, the magnitude order of the impact is SP-A, SA-A, SI-A and PN-A. In terms of an averaged amount of the national burden, the magnitude order of the impact is SA-A, SP-A, SI-A and PN-A. An amount of the national burden is vulnerable to the change in the tax amount of the highest income households, though the national burden rate is stable over the tax increase of the highest income households, because the rate converts large changes of tax burden to a small value by division of large income.
On the reform cases, the national burden increases twice as much as on the standard cases. In terms of the national burden rate, the magnitude order of the impact is SP-B, SI-B, SA-B and PN-B. In terms of an averaged amount of the national burden, the magnitude order of the impact is SA-B, SI-B, SP-B and PN-B. SP-B is higher in the national burden
Table 8. List of Policy Simulation Scenarios
Employment Income
Deduction Deduction for Public
Pension etc. Deduction for Social
Insurance Premium Spouse Deduction A Maximum 2.2 Million Yen Maximum 1.2 Million Yen Maximum 1.5 Million Yen Linearly Decreasing from 8
million Yen to 10 million Yen B Maximum 1.8 Million Yen Maximum 0.8 Million Yen Maximum 1.0 Million Yen Linearly Decreasing from 4 million Yen to 6 million Yen
rate, but not in an amount of national burden. This is why a wide household increases the tax burden but the highest households do not increase their tax burden through the reduction of the spouse deduction. Finally, even in the reform cases, the increases of the national burden rate remain at most in 0.1% scale.
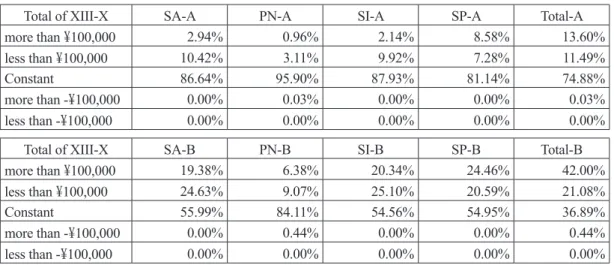
As the reason of the small scale, it is considered that the reduction of income deduction expands the tax base only for some parts of households. Table 11 shows the share of households from the VIII-bracket to the X-bracket which increases the tax burden. If all reductions of tax deductions in the standard case are applied, 75% of higher-income households have no effect of tax burden increases. Even in the reform case, it remains about 50%. That means there is a scale limit by a gradual reduction of income deduction and that does not lead to a substantial resolution of the increase of tax burden for higher income households.
Table 9. Averaged Changes of Tax Burden Rate in Each Scenario
SA-A PN-A SI-A SP-A SA-B PN-B SI-B SP-B
I 0.00% 0.00% 0.00% 0.00% 0.00% 0.00% 0.00% 0.00%
II 0.00% 0.00% 0.00% 0.00% 0.00% 0.04% 0.00% 0.00%
III 0.00% 0.00% 0.00% 0.00% 0.00% 0.06% 0.00% 0.00%
IV 0.00% 0.00% 0.00% 0.00% 0.00% 0.08% 0.00% 0.00%
V 0.00% 0.01% 0.00% 0.00% 0.02% 0.08% 0.02% 0.02%
VI 0.00% 0.01% 0.00% 0.00% 0.05% 0.07% 0.06% 0.06%
VII 0.00% 0.01% 0.00% 0.01% 0.10% 0.06% 0.13% 0.13%
VIII 0.01% 0.02% 0.02% 0.03% 0.14% 0.10% 0.18% 0.18%
IX 0.02% 0.01% 0.03% 0.07% 0.20% 0.07% 0.24% 0.24%
X 0.08% 0.01% 0.06% 0.12% 0.29% 0.07% 0.30% 0.30%
Table 10. Averaged Changes of National Amount of Tax Burden in Each Scenario
SA-A PN-A SI-A SP-A SA-B PN-B SI-B SP-B
I 0.00 0.00 0.00 0.00 0.00 0.01 0.00 0.00
II 0.00 0.00 0.00 0.00 0.00 0.13 0.00 0.00
III 0.00 0.00 0.00 0.00 0.00 0.23 0.00 0.01
IV 0.00 0.01 0.00 0.00 0.02 0.35 0.03 0.14
V 0.00 0.03 0.00 0.00 0.16 0.41 0.17 0.49
VI 0.00 0.07 0.01 0.00 0.46 0.46 0.54 1.03
VII 0.02 0.06 0.05 0.07 1.04 0.47 1.35 1.82
VIII 0.09 0.19 0.22 0.43 1.66 0.83 2.09 2.34
IX 0.35 0.13 0.52 1.04 2.73 0.72 3.33 2.86
X 3.56 1.11 3.01 3.28 8.06 2.20 7.88 4.40
VI. Redistributive Simulation and Policy Implication
In Section 5, the policy simulation indicates that a reduction of tax deduction gains tax from higher income households, although the absolute amount is limited. In the reform case, the averaged tax gain from higher income households becomes more than 10,000 yen. It is useful to redistribute their gain to lower income households for the correction of the flattening tendency of the structure of national burden among income classes. This calculation holds neutrality in tax revenues.
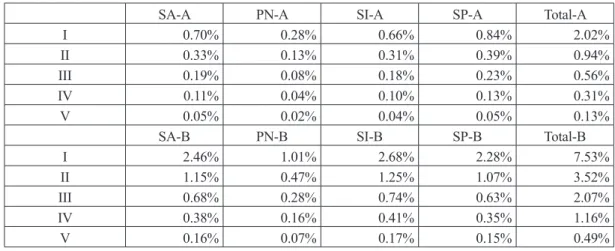
Therefore, we conduct a redistributive simulation to provide additional tax revenue in the simulation of Section 5 to lower income households proportionally; the redistributive proportions of each bracket are I : II : III : IV : V=5 : 4 : 3 : 2 : 17. Table 12 shows that mitigated scale of the national burden rate for the I-bracket is at most 0.84% in SP-A in standard cases. And if all reductions of the tax deductions are implemented (denote by Total-A), the mitigated scale for the I-bracket becomes 2.02%. On the other hand, in the reform case, the mitigated scale of SP-B domains that of Total-A. The largest effect in the reform case is SP-B, which reduces 2.68% of the national burden in percentage terms for households in the first decile bracket. If all the measures are implemented (denoted by Total-B), the national burden rate of the lowest income bracket reduces by around 7.53% in the reform case. As illustrated in Figure 6, Total-A recovers the past exacerbation of the flattening structure of national burden among income classes and Total-B improves the slope of it dramatically.
7 Tajika and Yashio (2006), Shiraishi (2009), Tajika and Yashio (2010) and Takayama and Shiraishi (2010) focus on the impact of the tax credit. But this paper considers simple welfare benefits for the lower-income households.
Table 11. Distribution of After-Tax Incomes’ Changes in Each Scenario
Total of XIII-X SA-A PN-A SI-A SP-A Total-A
more than ¥100,000 2.94% 0.96% 2.14% 8.58% 13.60%
less than ¥100,000 10.42% 3.11% 9.92% 7.28% 11.49%
Constant 86.64% 95.90% 87.93% 81.14% 74.88%
more than -¥100,000 0.00% 0.03% 0.00% 0.00% 0.03%
less than -¥100,000 0.00% 0.00% 0.00% 0.00% 0.00%
Total of XIII-X SA-B PN-B SI-B SP-B Total-B
more than ¥100,000 19.38% 6.38% 20.34% 24.46% 42.00%
less than ¥100,000 24.63% 9.07% 25.10% 20.59% 21.08%
Constant 55.99% 84.11% 54.56% 54.95% 36.89%
more than -¥100,000 0.00% 0.44% 0.00% 0.00% 0.44%
less than -¥100,000 0.00% 0.00% 0.00% 0.00% 0.00%
VII. Conclusion
This paper conducted a micro-simulation analysis that was able to compute the burdens of the income tax and the consumption tax payments and the social insurance payments using the Keio Household Panel Survey (KHPS). First, using the individual household’s data of the KHPS for 2009 to 2012, we recalculated the amounts of tax payments and social insurance premium payments by applying the tax and social insurance systems of relevant years to income between 2008 to 2011. Then, we obtained the equivalent gross income of each household by adding the public transfer amount and conducted evaluation based on the decile
Table 12. Averaged Changes of National Burden Rate in Each Scenario
SA-A PN-A SI-A SP-A Total-A
I 0.70% 0.28% 0.66% 0.84% 2.02%
II 0.33% 0.13% 0.31% 0.39% 0.94%
III 0.19% 0.08% 0.18% 0.23% 0.56%
IV 0.11% 0.04% 0.10% 0.13% 0.31%
V 0.05% 0.02% 0.04% 0.05% 0.13%
SA-B PN-B SI-B SP-B Total-B
I 2.46% 1.01% 2.68% 2.28% 7.53%
II 1.15% 0.47% 1.25% 1.07% 3.52%
III 0.68% 0.28% 0.74% 0.63% 2.07%
IV 0.38% 0.16% 0.41% 0.35% 1.16%
V 0.16% 0.07% 0.17% 0.15% 0.49%
Figure 6. Mitigated Scale of National Burden Rate under Total A and Total B
7%
10%
13%
16%
19%
22%
25%
I I I I I I I V V V I V I I V I I I I X X
2015 Baseline Total A
Total B Average Actuar Burden +2%
Policy Simulations increase public buden ratio of high income household and decrease that of lower income household (Total A and Total B)
Total A Total B
Income Class
National Burden Rate
division of income. The results showed that the share of the consumption tax and health insurance to the total income in low-income households was high and decreased according to the increase of its income. And alternatively the share of income tax, inhabitant tax and public pension premium increased.
Next, we estimated the hypothetical national burden by applying the tax and social insurance systems of FY2015 to income between 2008 and 2011. As a result, it was found that the increases in the burden of social insurance payments and the consumption tax hike were imposing a relatively large burden on low-income households. For high income households, the increase of social insurance was large, but the increase also led to the excessive compensation by social insurance deduction. As a result, in spite of the abolishment of small income deductions and introduction of reconstruction special income tax, income and inhabitant tax in high income households decreased by the increase of social insurance premiums. And the raise of the maximum income tax rate had a very limited impact on the tax revenue because the corresponding households were very limited. Due to a possible increase in social insurance payments and the consumption tax hike in the future, a further flattening will go on.
To recover the flatting of the national burden structure, we examined policy simulations with an increasing national burden mainly for high income households by reduction of various income deductions. We conducted an impact evaluation concerning a case of small reductions (standard case) and a case of large reductions (reform case). As a result, in the standard case in particular, the increase in the burden was limited in both absolute and percentage terms, and in the reform case, the increase in the burden in percentage terms was not sufficient.
Moreover, we calculated how much the national burden on lower income households can be mitigated through the use of the additional tax revenues estimated above. We found that if all the measures are implemented, the standard case recovers the past exacerbation of the flattening structure of national burden among income classes and the reform case improves the slope of it dramatically, although their additional tax revenue is limited.
These findings indicate that reducing income deductions, which benefit especially high- income households, will be an effective tax measure from the viewpoint of a correction in the structure of the national burden among income classes, which is getting flat under the recent increase of national burden. However, not only will reducing income deductions have only a limited effect in increasing the burden on high-income households, but also around half of such households will not be affected by the measure. Therefore, reducing some income deductions alone will have only a limited effect in correcting the flattening of the burden due to future increases in tax and social insurance payments. So, it is necessary to consider the preferable national burden, by reviewing the relationship between income deductions in general and social insurance payments.
As discussed in Nakazawa et al. (2014), we can evaluate the intertemporal income fluctuation of individual data by the KHPS data set, because the KHPS is panel data. This paper investigates only the analysis of 4 year averages. We need to expand our analysis
utilizing the characteristics of panel data in the future.
References
Abe, A. (2008) “Inequality, Poverty and Public Health Insurance: Microsimulation for the new premium decision,” The quarterly of social security research, Vol. 44 (3), pp. 332- 347 (In Japanese).
Ohno, T., M. Nakazawa, K. Miyoshi, K. Matsuo, K. Matsuda, T. Kataoka, Y. Takamizawa, K.
Hachisuka, T. Masuda (2013) “Burden of Tax and Social Insurance on Households:
Comparison of Family Income and Expenditure Survey, National Survey of Family Income and Expenditure and Comprehensive Survey of Living Conditions,” PRI Discussion Paper Series No. 13A-07, Policy Research Institute, Ministry of Finance (In Japanese).
Ohno T., M. Nakazawa, K. Matsuda, K. Kikuta and T. Masuda (2014) “Tax and Social Insurance Burden on Households: Estimate Using National Survey of Family Income and Expenditure,” Financial Review, vol. 118, pp. 77-94, Policy Research Institute, Ministry of Finance (In Japanese).
Ohno T., M. Nakazawa, K. Kikuta and M. Yamamoto (2015) “Comparison of Taxes and Social Insurance Payments by Households,” Financial Review, vol. 122, pp. 40-58, Policy Research Institute, Ministry of Finance (In Japanese).
Kitamura, Y. and T. Miyazaki (2012) “Income Gap and the Redistributive Function of Income: From 1984 to 2004,” Hitotsubashi University Global COE Hi-Stat Discussion Paper Series 230 (In Japanese).
Shiraishi K. (2009) “Social Security via Tax Credit,” PIE/CIS Discussion Paper; No. 456, Hitotsubashi University (In Japanese).
Takayama H. and K. Shiraishi (2010) “The impact of introduction of U.S. Style EITC to Japan,” Economic Research, vol. 61 (2). pp. 97-116, Hitotsubashi University (In Japanese).
Tajika E. and I. Furutani (2005) “Microsimulation Analysis on actual pension taxation and reform,” Economic Research, vol.56 (4), pp. 304-316, Hitotsubashi University (In Japanese).
Tajika E. and H. Yashio (2006) “Income Redistribution thorough the Taxation System: From Income Deduction to Tax Credit,” Oshio T., Tajika E. and T. Fukawa eds. Income Redistribution in Japan: Policy Measure for Widening Income Gap, University of Tokyo Press, Section 4 (In Japanese).
Tajika E. and H. Yashio (2008) “Income Tax Reform: Integrated Adjustment of Taxation and Social Insurance Premium through Tax Credit,” The quarterly of social security research,vol. 44 (3), pp. 291-306 (In Japanese).
Tajika E. and H. Yashio (2010) “Fiscal Stability and Adjustment of Economic Gap:
Introduction of Tax Credit,” Doi T. ed. How to revise the tax system in Japan, Nihon Keizai Shinbun Press, Section 2 (In Japanese).
Tanaka S., M. Shikata and K. Komamura (2013) “Analysis of Tax and Social Security Burdens on Elderly People Using Micro-Data of the National Survey of Family Income and Expenditure,” Financial Review, vol. 115, pp. 117-133, Policy Research Institute, Ministry of Finance (In Japanese).
Doi, T. (2010) “The Impact Analysis of the introduction of Child Arrowance: Microsimulation using JHPS,” Economic Research, vol. 61 (2), pp. 137-153 (In Japanese).
Doi, T. and B. Park (2011) “The impact of the reform of income tax on household:
Microsimulation on annual tax revision plan of 2011,” KEIO/KYOTO GLOBAL COE DISCUSSION PAPER SERIES DP2011-001 (In Japanese).
Nakazawa M., K. Matsuda, Y. Yoneta and K. Kikuta (2014) “The Quantitative Analysis of Variable Factors of Individual Income Tax Revenue Using Micro Data from the Comprehensive Survey of Living Conditions,” Financial Review, vol. 117, pp. 78-95, Policy Research Institute, Ministry of Finance (In Japanese).
Matsuda, K., Y. Ozeki, K. Kikuta, J. Ueda (2014) “The Impact of Demographic Changes on Social Security Payments and Personal Income Tax Base–Long-term Micro-simulation Approach”, Financial Review, vol. 118, pp. 95-119, Policy Research Institute, Ministry of Finance (In Japanese).
Yashio H. (2012) “On the tax reform of the expansion of tax base in the individual inhabitant tax,” No. 67, 79-101, Japan Economic Research, Japan Center for Economic Research (In Japanese).
Yashio H. and Y. Hasegawa (2009) “The Household Consumption Tax Burden in Japan,”
Economic Analysis, vol. 182, pp. 25-47 (In Japanese).
Yashio H. and K. Hachisuka (2014) “Impact of Population Aging on the Personal Income Tax Base–Simulation Analysis of Taxation on Pension Benefits Using Micro Data,”
Financial Review, vol. 118, pp. 120-140, Policy Research Institute, Ministry of Finance (In Japanese).