ASTE 望遠鏡による星 / 惑星系形成過程 の研究と南極望遠鏡への発展
塚越 崇 ( 茨城大 )
内容
• ASTE 望遠鏡による観測結果を基にした南極望遠鏡でのサイエンス
• T タウリ型星 , 原始惑星系円盤の観点から
• AzTEC サブミリ波広域イメージングによる原始惑星系円盤観測の結
果、および他望遠鏡へのサイエンスの発展
• 南極望遠鏡によるサイエンス
• カメレオン分子雲に対する連続波イメージング観測
• [CI] 輝線で探る円盤表層物理
惑星系形成と原始惑星系円盤
• 原始惑星系円盤 : 惑星系形成の土台
• 観測におけるキーパラメータ
• 円盤内のダスト・ガス分布
• 円盤の散逸時間
• ALMA における詳細構造解明 近年のホットトピックの一つ
ཎጞᝨᫍ⣔┙
䝎䝇䝖 䜺䝇
୰ᚰᫍ
✰ᵓ㐀䜢ᣢ䛴┙
㻔 㑄⛣ẁ㝵┙ 㻕 䝎䝇䝖䛾ᡂ㛗䛸ỿẊ
ᚤᝨᫍᡂ㛗 䜺䝇ὶධ䛸ᩓ㐓
ᝨᫍ⣔ᙧᡂ ᚤᝨᫍᙧᡂ 䜺䝇䛾ᩓ㐓
Fukagawa, TT, et al.(2013)
HD142527
ALMA Observations of HL Tau 5
FIG. 2.— Panels (a), (b), and (c) show 2.9, 1.3, and 0.87 mm ALMA continuum images of HL Tau. Panel (d) shows the 1.3 mm psf for the same FOV as the other panels, as well as an inset with an enlarged view of the inner 300 mas centered on the psf’s peak (the other bands show similar patterns). Panels (e) and (f) show the image and spectral index maps resulting from the combination of the 1.3 and 0.87 mm data. The spectral index (α) map has been masked where α/αerror <4. The synthesized beams are shown in the lower left of each panel, also see Table 1. The range of the colorbar shown for panel (b), at 1.3 mm, corresponds to−2×rms to 0.9×the image peak, using the values in Table 1. The colorscales for panels (a), (c) and (e) are the same except using the values of rms and image peak corresponding to each respective wavelength in Table 1.
reconcile with a simple disk/outflow scenario, suggesting that the blue-shifted outflow has broken out of the parental core (Monin et al. 1996), or that there is another – as yet unidenti- fied – driving source. Unfortunately, the
12CO (1-0) data are missing significant flux (due to a lack of short spacings), and have insufficient sensitivity in the outer portions of the field of view to warrant deeper analysis of its properties. Figs. 1b, and c show zoomed in views of our serendipitous detections of XZ Tau (A and B), and LkHα358; no other continuum sources above the local 4σ level were detected.
3.1.
HL Tau3.1.1.
Position and Proper MotionThe fitted position for HL Tau in each of the ALMA images is given in Table 1. The phase calibrator posi- tions are accurate to
<1 mas and the positions are consis- tent between the three observed bands to better than 2 mas (consistent with dedicated LBC astrometry experiments, see ALMA partnership et al. 2015); thus, we assume 2 mas as the absolute ALMA position uncertainty. The position reported by Kwon et al. (2011) from 1.3 mm CARMA observations is 04
h31
m38
s.418 +18◦13
′57.
′′37 (J2000, epoch 2009.08). The phase calibrator for CARMA observations (J0510+1800) had a position accurate to better than 1 mas, and we assume an
HLTau
ALMA partnership (2015)
T タウリ型星
これまでの観測 :AzTEC/ASTE K1 Project
• 高感度広領域の ( 南天 ) 近傍星形成領域 1.1mm 連続波マッピング観測
• 原始惑星系円盤の均一かつ大サンプルのサーベイ
• 南天のダスト円盤探査 (-> 干渉計観測、 ALMA へ )
• ダスト円盤の進化と散逸
• コア探査と Core Mass Function
• 外領域の星形成過程への影響
ASTE 望遠鏡 /AzTEC カメラ
• ASTE: 10m サブミリ波望遠鏡
• 受信機 : AzTEC (developed at UMASS)
• 144 素子ボロメータアレイ
• 中心周波数 : 270GHz (λ=1.1mm)
• 視野 : 7.8arcmin
• 分解能 : 28” (4200-5600AU)
• Jun. 2007 - Dec. 2008
• ラスター & リサージュスキャン
ASTE
AzTEC
観測領域
• 南天近傍星形成領域 (~16 deg 2 )
• 性質の異なる sub-cloud を保有
Cha I Cha II
Cha III
Av map (Dobashi+2005)
Lup I
Lup II Lup III
Lup IV L1688
L1709
core3 B59 core5
core10
Chamaeleon (d=160-180pc)
Lupus
(d=150-200pc) Ophiuchus
(d=130pc)
Pipe Nebula
(d=130pc)
連続波カメラのデータ解析手法
• Principle Component Analysis (PCA) method
• 素子間で相関性の良い信号を大気由来成分として除去
• 点源天体に対して高い感度
• source extraction に使用
• 低空間周波数を落とすことにより negative signal が生成
• Iterative procedure for extended emissions
• FRUIT
• PCA のパラメータを変化させ、 iterative に広がった放射を回復させる
• CLEAN deconvolution
• 得られた PCA イメージを PSF で deconvolution
• 電波干渉計でよく用いられる
観測結果例 : Chamaeleon
0.15 0.10
0.05 0.00
-0.05 0.20
Jy beam-1
Cha. I
Cha. II
part of Cha. III
観測結果例 : Lupus
Lup. II Lup. III
Lup. IV
Lup. I
field 1 field 2
field 3
field 4
field 5
field 6 0.2
mJy beam-1
0.1
0.0
• 多くの原始惑星系円盤 ( 分子雲から孤立したもの含む ) を検出
• 高感度・広域サーベイの利点
• 干渉計 (ALMA,SMA) 観測へ
10 -3 10 -2
10 -1 10 0 10 1
3 σ Mass Sensitivity per beam [M sun ]
Mapping Area [deg 2 ]
PipeLup OphCha
AzTEC/ASTE の観測領域と感度
• アタカマでも Chamaeleon 領域の観測条件は厳しい
wide
deep
COMPLETE(Oph) Young(Cha2)
Young(Oph) Enoch(Per)
COMPLETE(Per)
Stanke(Oph)
Johnstone(Oph) Motte(Oph)
Chini(RCrA)
single point obs.
Nurnberger+1997 [email protected] Henning+1993
Andre+1994 [email protected]
#κ
v=0.1 (v/[1THz]) cm
2g
-1YSO の検出率と進化傾向
• 進化に伴うフラックス減少
• “Outlier” 天体の詳細観測へ
0.01 0.1 1 10
-3 -2 -1 0 1 2 3
F(1.1mm) [Jy beam-1]
Spectral index
Class III Class II FS Class 0/I
ChaLup
PipeOph no index
(2-25µm) [Tsukagoshi+, in prep.]
ダスト沈殿円盤 [Tsukagoshi+2011]
• V1094Sco (Lupus III)
• 弱輝線 T タウリ型星 , 0.8M ⦿
• F(1mm)=221mJy
• Lupus で最も大きい
• F(1mm)/F(MIR)~1
• 冷たく重い円盤であり不安定
• T
R~99 [K] (R
1au)
-0.7で SED を再現
• M
disk~0.02-0.10M ⦿
• 回転 CO ガス円盤
(ASTE,SMA のフォローアップ )
10-1310-12 10-11 10-10 10-9 10-8
1 10 100 1000
1012 1013
1014
Wavelength [µm]
Frequency [Hz]
ß=0.0 ß=1.0
p=1.5
AzTEC
Late Stage of Transitional Disk [Tsukagoshi+2014]
• Sz91 (Lupus III)
• Class III T タウリ型星 , 0.5M
⦿• SMA+ すばる望遠鏡での高分解能観測
• R in =65au の inner hole
• M disk =2.4x10 -3 M ⦿ (g/d=100)
• class III としては最も massive
• 内側に ~170K の成分が存在
• 局所的な放射源
• 中心星に照らされるリング
– 15 –
(a) Ks -band PI + 345 GHz
100AU
(b) Ks -band PI + pol. angle
Fig. 4.— (a) Polarized intensity (PI) image with the Subaru telescope in the K
sband (color) superposed on the 345 GHz continuum emission (contour) shown in Figure 1(b). The stellar position is shown by the red cross. The best-fit ellipse is written by the yellow dashed line. The inner are of 0.
′′2 diameter (filled circle) is photometrically unreliable through PSF subtraction process and is masked. (b) Polarization vector angle map superposed on the PI image in the left panel.
Table 1. Parameters of the best-fit ellipses in Figure 4
Parameter Best-fit value Error
∆R.A.
1(
′′) 0.03 0.04
∆Dec.
1(
′′) 0.03 0.02 Major axis (
′′) 0.33 0.02 Minor axis (
′′) 0.25 0.08 Position angle (
◦) 17.5 17.7
1
Offset from the stellar position.
1 10 100 1000
λ ( μ m) 10
-1410
-1310
-1210
-1110
-1010
-9λ F
λ(erg sec
-1cm
-2)
disk+hot component
optically thin optically thick
ASTE による円盤ガス輝線観測
• 345GHz 帯多分子輝線観測
• 近傍 24 天体
• 円盤 ( ダスト ) 進化に伴う輝線強度減少
• 円盤 [CI] 輝線の初検出
[Tsukagoshi+2015]
• Band8QM/ASTE
• 円盤表層物理 ( 円盤風散逸など ) [CI] (
3P
1-
3P
0)
-0.05 0 0.1 0.15 0.2
0 2 4 6 8 10 12
V
LSR[km s
-1] T
A*[K ]
DM Tau
0.05
・ 492GHz 帯観測の大気条件
・単一準位での物理量導出
問題点
et al. 1993; SEST
による1.3 mm
の36
天体ポインティング観測)
、初めての高感度・大規模マッピングとなる。Target: Chamaeleon Dark Cloud Complex
α∼
10
��–14
��,
δ∼−75
◦–
−85
◦ に存在している、近傍星形成領域の一つであり(d
∼150 pc)
、南天における典型的 な低質量星形成領域として考えられている。クラウドは3
つのサブクラウド(Cham I, Cham II, Cham III)
から 成り、それぞれで星の形成環境が異なる事が示唆されている。図1
を見ても分かる様に、Cham I
とCham II
に はYSO
が集中して存在し、活発的な星形成が生じている。一方Cham III
にはYSO
が存在しない、無活動な領 域となっている。同complex
内のクラウド間においてこのような多様性が生じる要因を調べる上でも大変興味深 い領域である。既存の望遠鏡ではほとんど観測ができず、電波観測はNANTEN
やSEST
によってミリ波長帯で 行われてきた(Mizuno et al. 1998, 1999, Henning et al. 1993
など)
。近年はAPEX
による分子輝線観測の結果(Cham I
のMMS1)
がpublish
されている(Belloche et al. 2006)
。図
1
はカメレオン領域全体の様子と、T
タウリ型星の分布の様子を示している。カメレオン領域には200
近いT
タウリ型星が存在している(Alcal´a et al. 1997)
。CTTS
はサブクラウドCham I
、Cham II
に集中して存在し ており、WTTS
はカメレオン領域全域に渡ってほぼ均一に分布している。Cham I
には5
つの原始星と116
のT
タウリ型星が存在しており(CTTS
が42
個、WTTS
が74
個; Lawson et al. 1996, Mizuno et al. 1999)
、Cham II
には3
つの原始星と34
のT
タウリ型星が存在する(CTTS
が30
個、WTTS
が4
個; Young et al. 2005, Alcal´a et al. 2000, Hughes et al. 1992)
。図
1:
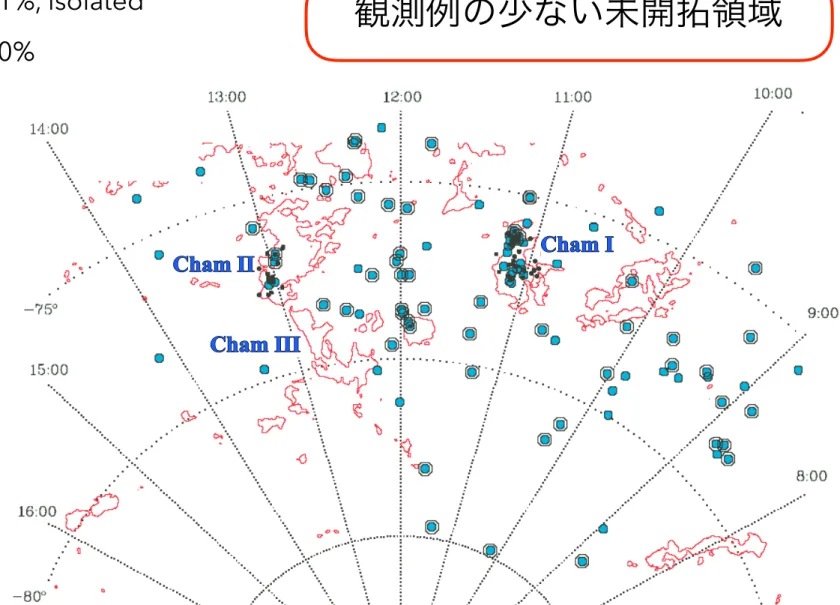
カメレオン領域におけるT タウリ型星の分布。黒点はCTTS、青い円はWTTSの分布を示す。赤コントアはIRAS100µm の分布 を示す(Alcal´a et al. 1997)。星形成領域での高感度コンプリートマッピングでも重要な意義を持つが、観測自体が非常に少ない事からも、
カメレオン領域のコンプリートマッピングの意義は非常に大きい。ただし、カメレオン領域が観測可能な干渉計 は存在せず、高分解能観測は
ALMA
の完成を待つ必要がある。Astro-F
でもカメレオン領域に存在するT
タウリ 型星の高感度サーベイを行う為、フォローアップが可能である。Astro-F
では領域に存在するほぼ全てのWTTS
の円盤検出と、円盤詳細構造(
ディスクギャップ等)
の情報を得る事ができる。AzTEC
で得られるデータと組み 合わせれば、詳細なSED
解析から、円盤の質量や構造についてより正確な評価が可能であり、またWTTS
以降 での円盤進化を同時に議論する事ができる。2
南極望遠鏡による Chamaeleon 分子雲の観測
• Chamaeleon 分子雲 : 性質の異なる sub-cloud を持つ
• Cha1: SFE~10%, cluster
• Cha2: SFE~1%, isolated
• Cha3: SFE=0%
[Alcala+1997]
観測例の少ない未開拓領域
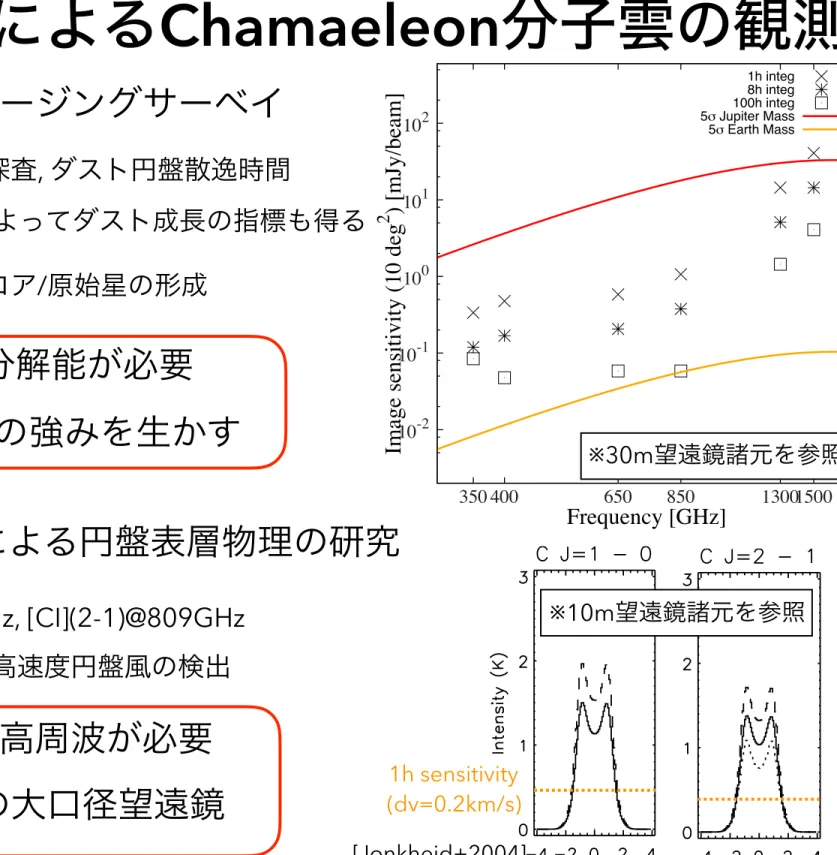
南極望遠鏡による Chamaeleon 分子雲の観測
• 観測サイト間の Elevation の違い
南極
ASTE
Chamaeleon
Chamaeleon
南極望遠鏡による Chamaeleon 分子雲の観測
• 連続波広域イメージングサーベイ
• 原始惑星系円盤探査 , ダスト円盤散逸時間
=> 多周波観測によってダスト成長の指標も得る
• 母体分子雲からコア / 原始星の形成
• 2 準位 [CI] 観測による円盤表層物理の研究
• [CI](1-0)@492GHz, [CI](2-1)@809GHz
• [CI] の探査観測 + 高速度円盤風の検出
視野 + 分解能が必要
=> 単一鏡の強みを生かす
10-210-1 100 101 102
350 400 650 850 13001500
Im ag e s en sit iv ity (1 0 d eg
2) [ m Jy /b ea m ]
Frequency [GHz]
1h integ 8h integ 100h integ 5σ Jupiter Mass 5σ Earth Mass
※ 30m 望遠鏡諸元を参照
分解能 + 高周波が必要
=> 南極の大口径望遠鏡
520 B. Jonkheid et al.: The gas temperature in flaring disks
Fig. 9. The emission lines of C, O, C+ and CO for three scenarios: Tgas = Tdust (dotted line), and Tgas calculated explicitly in the well-mixed (solid line) and settled (dashed line) model. Units are in Kelvins, assuming that the disk fills the beam precisely; this corresponds to a beam size of 5′′ when the disk is at 150 pc.
Fig. 10.Vertical distribution of gas and dust temperatures in the disk at a radius of 105 AU. The solid line gives the gas temperature when gas- dust collisions are ignored, the dashed line gives the gas temperature when these collisions are included in the thermal balance. The dotted line gives the dust temperature. The inset shows the region around Tgas =20 K.
steeply than in well mixed disks. Due to the lower temper- atures, the intensities of higher-lying lines are lower than in well mixed disks.
– Dust settling does not greatly affect the disk’s chemistry.
This is because PAHs are assumed to stay well-mixed with the gas when large grains are settling. As a result much of UV radiation important for chemistry is still absorbed in the surface layers of the disk in the settled model. The C
+/C/CO and the O/O
2transitions thus occur only slightly lower in the disk.
– Dust settling increases the intensity of atomic and molecu- lar lines, and has a subtle influence on the line shapes due to the smaller amount of hot gas, especially at small radii.
Acknowledgements. The authors are grateful to Inga Kamp for many discussions on the thermal balance, and for jointly carrying out a detailed comparison of codes. They thank Michiel Hogerheijde and Floris van der Tak for the use of their 2-D radiative trans- fer code. This work was supported by a Spinoza grant from the Netherlands Organization of Scientific Research (NWO) and by the European Community’s Human Potential Programme under con- tract HPRN-CT-2002-00308, PLANETS.
References
Aikawa, Y., Umebayashi, T., Nakano, T., & Miyama, S. M. 1997, ApJ, 486, L51
Aikawa, Y., van Zadelhoff, G. J., van Dishoeck, E. F., & Herbst, E.
2002, A&A, 386, 622
Bakes, E. L. O., & Tielens, A. G. G. M. 1994, ApJ, 427, 822
520 B. Jonkheid et al.: The gas temperature in flaring disks
Fig. 9. The emission lines of C, O, C+ and CO for three scenarios: Tgas = Tdust (dotted line), and Tgas calculated explicitly in the well-mixed (solid line) and settled (dashed line) model. Units are in Kelvins, assuming that the disk fills the beam precisely; this corresponds to a beam size of 5′′when the disk is at 150 pc.
Fig. 10.Vertical distribution of gas and dust temperatures in the disk at a radius of 105 AU. The solid line gives the gas temperature when gas- dust collisions are ignored, the dashed line gives the gas temperature when these collisions are included in the thermal balance. The dotted line gives the dust temperature. The inset shows the region around Tgas =20 K.
steeply than in well mixed disks. Due to the lower temper- atures, the intensities of higher-lying lines are lower than in well mixed disks.
– Dust settling does not greatly affect the disk’s chemistry.
This is because PAHs are assumed to stay well-mixed with the gas when large grains are settling. As a result much of UV radiation important for chemistry is still absorbed in the surface layers of the disk in the settled model. The C
+/C/CO and the O/O
2transitions thus occur only slightly lower in the disk.
– Dust settling increases the intensity of atomic and molecu- lar lines, and has a subtle influence on the line shapes due to the smaller amount of hot gas, especially at small radii.
Acknowledgements. The authors are grateful to Inga Kamp for many discussions on the thermal balance, and for jointly carrying out a detailed comparison of codes. They thank Michiel Hogerheijde and Floris van der Tak for the use of their 2-D radiative trans- fer code. This work was supported by a Spinoza grant from the Netherlands Organization of Scientific Research (NWO) and by the European Community’s Human Potential Programme under con- tract HPRN-CT-2002-00308, PLANETS.
References
Aikawa, Y., Umebayashi, T., Nakano, T., & Miyama, S. M. 1997, ApJ, 486, L51
Aikawa, Y., van Zadelhoff, G. J., van Dishoeck, E. F., & Herbst, E.
2002, A&A, 386, 622
Bakes, E. L. O., & Tielens, A. G. G. M. 1994, ApJ, 427, 822