Originals〜〜〜〜〜〜〜〜〜〜〜〜〜〜〜〜〜〜〜〜〜〜〜〜〜〜〜〜〜〜〜
Equivalent Drop Test Modification for Determination of Cushioning Performance
Chen ZHONG* and Katsuhiko SAITO**
There are two main testing methods for cushioning performance of the transport packaging: One is the dynamic compression test which uses simple shapes of material and the other is the equivalent drop test---the shock test, which is based on the traditional equivalent drop theory. Because of limitations of the traditional theory, the traditional equivalent drop test causes errors in many cases. For this reason, by introducing the concept of the velocity correction coefficient that can be expressed by a parameter of the damping ratio, a new attenuation equivalent drop theory (modified theory in this paper) based on the traditional theory is proposed in this paper. Subsequently, two different correcting methods that are based on the modified theory are proposed. In order to verify the viability of the new theory, expanded polyethylene is used as a test material, and the dynamic compression test and the shock test based on the traditional theory and the modified theory respectively are performed. Finally, the results of two tests are compared. Verification experiments show that the modified theory can improve the equivalent precision of the two tests, and one of the two correcting methods is superior to the other.
Keywords:equivalent drop test, equivalent free-fall height, dynamic compression test, shock test, correction coefficient
1. INTRODUCTION
Peak acceleration is an important indicator when evaluating the shock fragility of packaged products, and the dynamic compression test and the shock test are often performed to evaluate cushioning performance of transport packaging.
In general, the impact acceleration can be detected by the dynamic compression test for materials of simple shapes; however, the dynamic compression test is not suitable for cushioning materials such as molded pulp because of the materials' complex shape. In such cases, the shock test should be conducted.
For the drop test, there is a recommendation in JIS-Z-0240-2002[1][Structural Cushioning Materials for Packaging---Determination of Cushioning Performance] (this standard corresponds with ASTM-D4168-95[2] [Standard Test Methods for Transmitted Shock Characteristics of Foam-in-Place Cushioning Materials]): When the velocity of the free-fall test is equal to the velocity change occurring on the shock table of the shock test that uses the half-sine wave, the height of the free-fall test is called the equivalent free-fall height. This recommendation is based on the assumption that the cushioning materials can be modeled as a one-dimensional non-attenuated spring-quality model (traditional model in this paper). On the basis of this assumption, we can conclude that the dynamic compression test and the shock test are equivalent. In other words, if the drop heights applied in the dynamic compression test and the
* Graduate School of Kobe University, Fukaeminami, Higashinada, Kobe 658-0022, JAPAN
** corresponding auther; Professor, Kobe University, Transport Packaging Laboratory,
5-1-1, Fukaeminami, Higashinada, Kobe 658-0022, JAPAN. E-mail: [email protected]
shock test are equal, the peak accelerations of those two tests should yield the same theoretical result.
However, experimental data shows that for such tests with equal drop heights, the peak accelerations are certainly not equal. The prime reason is that the ubiquitous phenomenon of friction in the real environment is not considered under the assumption mentioned above.
2. MATERIALS AND METHODS 2.1 Traditional equivalent drop theory
Fig. 1. Traditional Model
The structural cushioning materials are assumed to follow a linear spring-mass model under the traditional equivalent drop theory (traditional theory in this paper) (Fig. 1). In this assumption, the peak acceleration occurring on a weight dummy of the dynamic compression test is shown as follows:
(1)
where is the natural angular frequency with no attenuation, is the mass, is the spring constant, is the drop height, and is the velocity of the weight dummy.
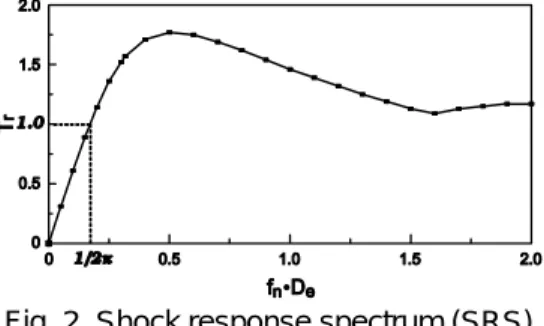
Fig. 2. Shock response spectrum (SRS)
For the shock test, when an extremely short half-sine shock pulse is applied to the system, the shock response spectrum (SRS) of the system is recorded, as shown in Fig. 2. When (where is the natural frequency with no attenuation, and is the effective impact duration) is smaller than , the model is regarded as a "soft spring" and the SRS curve can be expressed as linear with slope . Hence, the shock transmissibility is equal to , and can be represented as follows [3]:
(2) (3)
where is the peak acceleration, is the input acceleration, is the velocity change on the shock table, and is the impact duration.
Comparing Eqs.(1) and (3), if we let when we perform the dynamic compression test and the shock test, the peak accelerations of those two tests should be the same theoretically. In other words, we can draw the conclusion that the two tests are equivalent.
2.2 Tests based on the traditional theory
First of all, the dynamic compression test and the shock test, which are based on the traditional equivalent drop theory, are performed.
2.2.1 Decision of equivalent free-fall height
According to JIS-Z-0240-2002, equivalent free-fall height should be set at , which is adopted as described in Section. 2.1.
2.2.2 Low-pass filtering
In order to remove noise from the target pulse and the inherent vibration of the weight dummy, low-pass filtering must be correctly set up. According to JIS-Z-0240-2002, or low-pass filtering can often be employed in a test. With respect to structural cushioning materials, the acceleration may become very complicated due to their different shape. Thus, low-pass filtering is recommended for the test of structural cushioning materials.
2.2.3 Test equipment and materials
The test equipment and materials used in this paper are shown as follows:
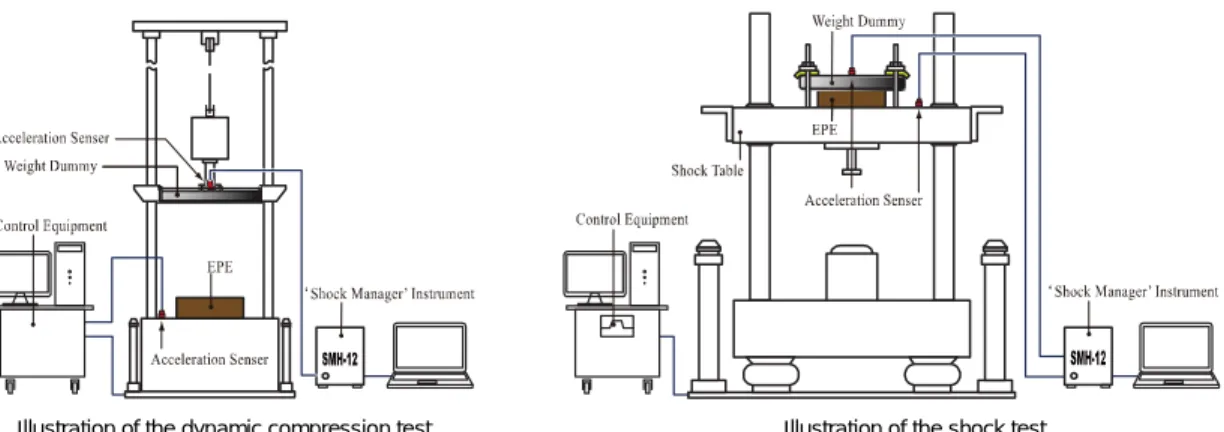
Illustration of the dynamic compression test Illustration of the shock test
Fig. 3. Illustration of the dynamic compression test and the shock test
1) Equipment (Fig. 3):
Dynamic compression tester
Shock machine
"Shock manager" measuring and test instrument.
2) Test materials:
Weight dummy (Fig. 3) [Mass: 4kg]
Expanded polyethylene from Asahi Kasei Chemicals Corporation (Fig. 4)
[Expansion rate: , Size: ]
30
100 Unit: mm
100
Deceleration(×9.8m/s2)
Static Stress (KPa) Drop height: 60cm
(Average of 2~5 times dropping)
2 100
50
0
5 10 20 40
T=2cm
3.9 KPa T=3cm
T=4cm T=5cm
Expanded Polyethylene (EPE-25) Static Stress-acceleration Curve of EPE-25
Fig. 4. Expanded polyethylene (EPE-25)
The weight dummy is selected using the following procedure: As shown in Fig. 4, according to the thickness of the test material and the official static stress-peak acceleration curve, when the drop height is , we draw a line from the lowest point of the curve described as to the axis. Then we find the static stress acting on the material to be . It is easy to calculate that the mass of the weight dummy is with the formula , where is the static stress, is the load, and is the compression area.
2.2.4 Setup of the test condition
The test materials should be placed in a controlled atmospheric condition where the temperature is 23℃ and the relative humidity is for hours before the dynamic compression test and the shock test.
Fig. 5. Parameter setting in the dynamic compression test
Fig. 6. Parameter setting in the shock test
The mass of the weight dummies used in both tests is the same ( ), and an acceleration sensor used for measuring the peak acceleration is fixed in the center above the weight dummy.
Because the equivalent free-fall height is , we can calculate that the theoretical velocity is according to the formula . The parameter of the dynamic compression test and the shock test are set by the test control software separately, as shown in Figs. 5 and 6.
When the dynamic compression test is performed, the set-up drop height is not the same as the equivalent free-fall height ( ), but is equal to the corresponding drop height for the real velocity of the weight dummy to the same as the theoretical velocity ( ). Therefore, the test has to be adjusted repeatedly until the velocity of the weight dummy becomes .
On the other hand, when the shock test is performed, in order to adjust the velocity change of the shock waveform occurring on the shock table to , an adjusting function in the controlling software (Fig. 6) needs to be used by repetition, too.
For two tests, the results are effective only when or .
2.2.5 Result of two tests
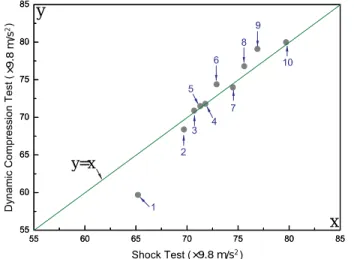
For both tests, the effective results are shown in Fig. 7.
y=x
x y
×9.8m/s2
×9.8 m/s2
Fig. 7. Result of two tests based on the traditional theory
As the expanded polyethylene's cushioning performance decreases as the test proceeds, the peak accelerations of the two tests gradually increase and there is a linear relationship between the accelerations observed under the two tests. the result shown in Fig. 7 is not the same as a theoretical result that all the equivalent points of the two tests should be exactly on the line under the traditional theory, but a majority of them are scattered around the line. This establishes the limitation of the traditional equivalent drop theory.
2.3 Modified equivalent drop theory[3]
Fig. 8. Attenuation Model
First, the structural cushioning material is assumed to obey a one-dimensional attenuation model (Fig.
8), and the peak acceleration occurring on the weight dummy of the dynamic compression test is shown as follows:
(4) (5) where is the correction coefficient of the dynamic compression test, and is the damping ratio.
For the shock test, the response acceleration of the attenuation model in which input acceleration is the half-sine wave can be obtained theoretically. Subsequently, can be calculated using the input and response acceleration. If we define as the ratio between and the approximation of the shock transmissibility based on traditional theory , we can obtain
(6) then the peak acceleration of the shock test can be as follows:
(7) where is the correction coefficient of the shock test, and is the velocity change on the shock
table.
With respect to the preceding information, a condition---correction coefficient---must be considered if we want the dynamic compression test and the shock test to be equivalent under the attenuation model, and the expression of the specific condition is
(8)
γ
Acceleration(×9.8m/s2)
Time (ms)
0 5 10 15 20 25
80 70 60 50 40 30 20 10 0 -10
Affmax
Fig. 9. Illustration of parameter
It must be pointed out that the attenuation model's and must be known in order to be able to calculate the velocity change correction coefficient. These two parameters can be obtained from the time-acceleration curve that contains the peak acceleration and the half-duration from to of the shock pulse (Fig. 9). The method mentioned above is the correct shock test procedure for deriving the velocity change correction coefficient based on the cushioning materials' dynamic compression test.
2.4 Correction of the velocity change
FunctionValue
cs
Time (s)
Accelaration(G)
Tr Ain
= Acsmax
The dynamic compression test basing on the traditional theory
The shock test basing on the traditional theory
nff
V n n V
c ff cs
=
ncs
V
Fig. 10. Flowchart for correcting the velocity change
Under the new equivalent drop theory, a correction of the velocity change follows the flowchart in Fig. 10.
We can get the response acceleration-time curve after the dynamic compression test is performed (Fig. 9), and can be expressed with and as:
(9)
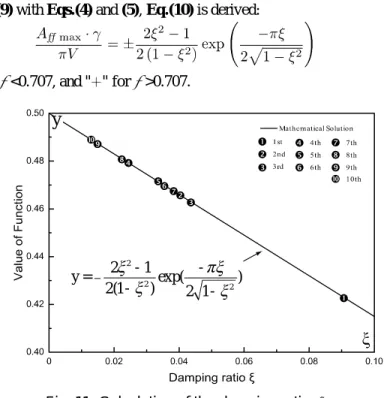
then, we combine Eq.(9) with Eqs.(4) and (5), Eq.(10) is derived:
(10) where " " is valid for ξ <0.707, and " " for ξ >0.707.
y
y = -
-
- -
2 1
2 1 2 1
2
2 2
( )exp( )
Fig. 11. Calculation of the damping ratio
For the right-hand side of Eq.(10), a curve that relates to can be plotted (Fig. 11). Furthermore, a specific value can be calculated if the metadata of the dynamic compression test is imported into the left-hand side of Eq.(10). Next we match these specific values with the curve graphics; the corresponding damping ratio is available when both of them match. At last, can be calculated after is imported into Eq.(5).
On the other hand, the response acceleration of the shock test can be expressed as follows:
where is the initial impact duration. The maximum value of the response acceleration can be determined by means of the shock response analysis (SR analysis) [4] (Fig. 12), and then can be calculated using Eq.(2). The corrected velocity change can eventually be calculated according to Eq.(8).
(11)
Fig. 12. SR analysis
Using the corrected velocity change , the shock test is re-performed, and the new test data are obtained. The comparison of the result based on the traditional theory and the result after being corrected by the correcting method-1 (The method in which the input velocity change of the shock test is determined after solving the model's and according to the dynamic compression test is called the correcting method-1 in this paper.) is shown in Fig. 13.
y=x
x y ( , , …):
( , , …):
The result basing on the traditional theory The result basing on the correcting method-1
×9.8m/s2
×9.8 m/s2
Fig. 13. Comparison of results of the tests based on the traditional method and the correcting method-1
2.5 Equivalent drop height
The equivalent drop height can also be determined according to the shock test. First, the frequency is calculated using the response acceleration waveform of the weight dummy during the shock test. Second, SR analysis is performed and the desired damping ratio is obtained. can be determined after is calculated using the input and response acceleration. Next, is obtained using Eq.(5). Finally, the equivalent drop height corresponding with the free-fall test can be calculated according to the following equation:
(11) (12)
2.6 Correction of the velocity
The shock test basing on
the traditional theory Acsmax
nff
ncs
2
cs c ff
V gh
n V n
=
=
SR Analysis Calculation of
Fig. 14. Flowchart for correcting the velocity
Fig. 14 shows the flowchart for correcting the velocity. First, the shock test based on the traditional theory is performed, and the input and response accelerations are measured. The reciprocal number of 2 times the period of a half cycle in the response acceleration is the model's natural frequency . Subsequently, SR analysis is performed using the data of the input acceleration to compute the desired damping ratio. can be calculated using the input acceleration and the response acceleration, and is determined after is imported into Eq.(6), subsequently, is obtained when we use Eq.(5).
Finally, the corrected velocity can be calculated according to Eq.(12).
Using the corrected velocity , the dynamic compression test is re-performed, and the new test data are obtained. The comparison of the result based on the traditional theory and the result after being corrected by the correcting method-2 (the method in which the drop height of the dynamic compression test is determined after solving the model's and according to the shock test is called the correcting method-2 in this paper.) is shown in Fig. 15.
y=x
x y
4 5
6 7
8 9
1 2
3
( ):
(1 2 3 ):
The result basing on the traditional theory The result basing on the correcting method-2
×9.8m/s2
×9.8 m/s2
Fig. 15. Comparison of results of the tests based on the traditional method and the correcting method-2
3. RESULTS AND DISCUSSION 3.1 Correlation Coefficient
In statistics, correlation and dependence are two of a broad class of statistical relationships between two or more random variables or observed data values. Correlations are useful to indicate a predictive relationship that can be exploited in practice. There are several correlation coefficients, but the sample correlation coefficient, denoted , which is mainly sensitive to a linear relationship between two variables, is in common use. The sample correlation coefficient between two random variables and
with expected values and and standard deviations and is defined as
where is the expected value operator.
The value of the correlation coefficient must satisfy the inequality , indicating the degree of linear dependence between the variables. The closer the coefficient is to either or , the stronger the correlation between the variables.[5]
3.2 Discussion of results
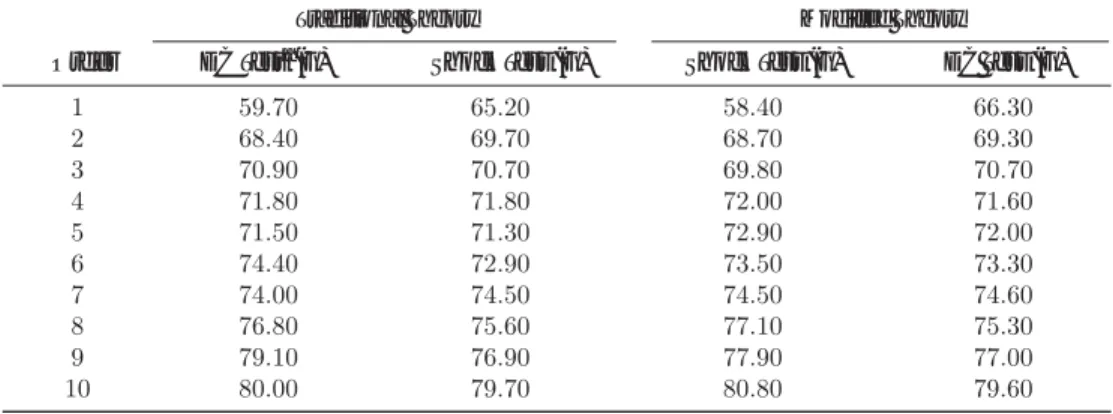
Table 1. Comparison of the cushioning material evaluation in the peak acceleration (G-factor)
Order DC Testa
a The dynamic compression test.
Shock Test (G) Shock Test (G) DC Test (G) (G)
Traditional Theory Modified Theory
The values in Table 1 are the peak accelerations (G-factor) of the weight dummy. The values from the left to the right are: the result of the dynamic compression test when the weight dummy's velocity is equal to the velocity in which the corresponding drop height is , the result of the shock test that uses the half-sine wave based on the traditional theory (the velocity change determined by the half-sine wave equals the velocity of the weight dummy), the result of the shock test after being corrected by the correcting method-1, and the result of the dynamic compression test after being corrected by the correcting method-2.
(13)
Fig. 16. Comparison of the correlation coefficient
Between the above data, three comparisons (Fig. 16) are performed to calculate the correlation coefficient, and the result is shown in Fig. 16. It is easy to see that the correlation relationship between the results becomes gradually stronger from the traditional method to the correcting method-1 to the correcting method-2. Therefore, the equivalent precision of the tests based on the modified theory is increased over those based on the traditional theory, and we can see that the correcting method-2 is superior to the correcting method-1. The reason is considered to be as follows: For the spring-mass model, the peak acceleration of the weight dummy[4] is
(12) where and denote time. For the correcting method-1, the input acceleration is assumed as the
half-sine wave when the dynamic compression test is performed, whereas real pulse is applied as the input acceleration when the correcting method-2 is adopted; therefore, the response acceleration based on the actual waveform, according to Eq.(14), is more accurate.
4. CONCLUSIONS
Based on the preceding analysis, the traditional theory is limited because it does not consider an effect of attenuation phenomenon. Consequently, the result of the equivalent drop test based on the traditional theory has errors. In this paper, the concept of velocity correction coefficient is introduced, and the new equivalent model considering the attenuation is established. The experiment shows that the equivalence accuracy of two tests is further improved after correction; thus, it can be seen that the velocity correction is the key to reducing the error in the equivalent drop test.
References
[1] JIS-Z-0240-2002, Structural Cushioning Materials for Packaging---Determination of Cushioning Performance.
[2] ASTM-D4168-95, Standard Test Methods for Transmitted Shock Characteristics of Foam-in-Place Cushioning Materials.
[3] Katsuhiko SAITO and Kazuaki KAWAGUCHI, 23rd International Association of Packaging (14)
Research Institutes Symposium, 3-5 September 2007.
[4] Cyril M. Harris and Allan G. Piersol, Harris' Shock and Vibration Handbook (Fifth Edition), 23.1-23.26.
[5] Robert V. Hogg, Joseph W. McKean and Allen T. Craig, Introduction to Mathematical Statistics (Sixth Edition), 101-107.
(原稿受付 2010年1月26日)
(審査受理 2010年3月8日)
緩衝性能確認等価落下試験の革新
仲 晨*、斎藤 勝彦**
落下衝撃から包装内容品を保護するための緩衝材の性能は、動圧縮試験によって評価されるが、
複雑な形状の構造体緩衝材では、動圧縮試験ができないため、衝撃試験装置を用いた等価落下試 験で評価される。等価落下試験では、発生させる衝撃台の正弦半波パルスの速度変化と等しい衝 突速度となる落下高さが等価自由落下高さであると規定されており、緩衝系が減衰のない線形バ ネ-質量1自由度系とみなせる場合には実用上問題ないが、実際の緩衝系は減衰の影響が無視で きない。本論文では、緩衝材性能評価としての動圧縮試験と等価落下試験の結果が必ずしも等価 とみなせるほどではないことを実験的に明らかにするとともに、減衰の影響を考慮した理論に基 づいた等価落下試験の方法を提案する。さらに、減衰等価落下モデルによる等価落下試験を行い、
両試験の等価度を実験的に確認する。
キーワード: 等価落下試験、等価自由落下高さ、動圧縮試験、衝撃試験、修正係数