無容器法により合成した 無容器法により合成した
超高屈折率ガラスの物性と構造
東京大学生産技術研究所 増野敦信
増野敦信
Collaborators
H. Inoue, K. Yoshimoto, Y. Kikuchi, T. Mizoguchi, Y. Watanabe Institute of Industrial Science, The University of Tokyof y f y J, Yu, Y. Arai, M. Kaneko
Japan Aerospace Exploration Agency (JAXA) S K h
S. Kohara
Japan Synchrotron Radiation Research Institute Y Kuroiwa C Moriyoshi
Y. Kuroiwa, C. Moriyoshi Hiroshima University K. Okajimaj
Saga-LS A. C. Hannon
ISIS F ili R h f d A l L b
ISIS Facility, Rutherford Appleton Laboratory E. Bychkov
Université du Littoral Université du Littoral
Introduction
Containerless processing
with container without container
melt melt
crystallization
9suppress heterogeneous nucleation from the container wall
9promote deeper undercooling in molten
crystallization
from the container wall materials
No crystallization
rature
Tm
rature
No crystallization
temper
ΔT~ small tempe
r
t0
time t0
time
Containerless processing on the ground
Various types of levitation furnace
Electrostatic levitation furnace Aerodynamic levitation furnace Electrostatic levitation furnace Aerodynamic levitation furnace
Electromagnetic levitation furnace Acoustic wave levitation furnace
Aerodynamic levitation furnace
CCD camera
pyrometer monitor
sample nozzle sample
PC
Beam splitter
Mass flow controller
Gas: air, oxygen, nitrogen, argon Pressure: 1 ~ 3 atm
S l i φ 1 5
CO2laser Mass flow controller Sample size: φ = 1 ~ 5 mm
Sample weight: 10 ~ 200 mg
Ferroelectric BaTi
2O
5Monoclinic, a = 1.6914 nm, b = 0.3935 nm, c= 0.9412 nm b = 103.11º
Y. Akishigeet al., Jpn. J. Appl. Phys. 42, (2003) L946.
T. Akashi, et al., Mater. Trans. 44, (2003) 1644.
stable region
~10 ºC
~10 C
9High ferroelectric transition temperatureg p 9Large dielectric constant
9Colorless and transparent
N. Zhu and A. R. West, J. Am. Ceram. Soc. 93, (2010) 295.
Glass formation of ferroelectric BaTi
2O
5XRD, ND XANES
1.5 mm
J.Yu et al., Chem. Mater. 18, (2006) 2169.
The first time glass formation of ferroelectric titanate without any network former oxides.
RMC simulation
, , ( )
9Glass structure
Distorted TiO5 polyhedra Edge shared polyhedra 9Crystallization process
Metastable phase formation
J.Yu et al., Chem. Mater. 21, (2009) 259.
Giant dielectric response
Metastable phase formation from BaTi
2O
5glass
λ= 0.4977 Å TP3
sity
γ phase
β phase
Tg
Intens β phase
Tx1 Tx2
5 10 15 20 25
α phase
2θ(λ=04977A)
Before crystallization at 1150 K of the
bl f l i h
stable ferroelectric γ phase, two
metastable phases α (at Tx1) and β (at Tx2)
appeared in sequence. Paraelectric β phase Ferroelectric γ phase
J.Yu et al., Chem. Mater. 21, (2009) 259.
Paraelectric β phase Ferroelectric γ phase
Giant dielectric response at T
x1100 Hz
Tp31150 K Tp1
1001 K
Tp2 1038 K Tg
960 K
1038 K
Tcry1994 K
Tcry2 1018 K
cry1 0 8
J.Yu et al., Chem. Mater. 18, (2006) 2169.
Next step
9Optical properties Transmission Transmission Refractive index
Luminescence properties 9Glass forming region
binar (La O TiO ) binary (La2O3-TiO2)
ternary (BaO-TiO2-MOx, La2O3-TiO2-MOx) 9Unusual crystallization process
Optical properties
Optical properties of BaTi
2O
5glass
100
60 80 100
ance (%)
Transmittance region of oxide glasses
Bi2O3
20 40 60
transmitta
Optical bandgap:3.48 eV
TeO2 Al2O3 Ge2O3
300 400 500 600 700 800
0 20
wavelength (nm)
p g p 2 3
P2O5 B2O3 SiO
5000 4000 3000 2000 1000
100
wavenumber (cm-1)
100 1000 10000
W l h ( )
SiO2 BaTi2O5
60 80
ance (%)
B Ti O l f
Wavelength (nm)
20 40
transmitta
BaTi2O5 glass: transparent from 350 nm to 7.7 μm
2 3 4 5 6 7 8 9 10
0
wavelength (μm) A. Masuno et al., J. Appl. Phys. 108, (2010) 063520.
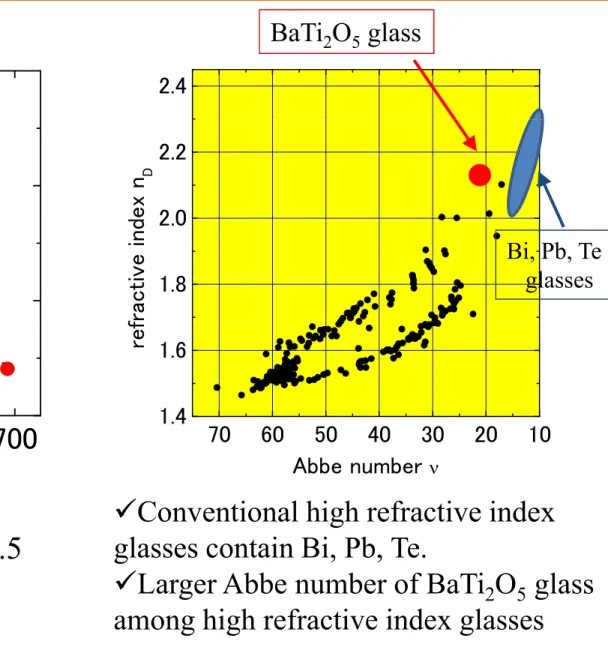
Refractive index of BaTi
2O
5glass
2.25 2.4
BaTi2O5 glass
ndex 2.20 2 0
2.2
dex n D
ractive i 2.15
1.8 2.0
fractive ind
Bi, Pb, Te glasses
2.10
refr
1.4
ref 1.6
400 500 600 700
2.10
wavelength (nm)
70 60 50 40 30 20 10 1.4
Abbe number ν
9Conventional high refractive index
1 n
nF:H F (487 nm)
Abbe number
g
glasses contain Bi, Pb, Te.
9Larger Abbe number of BaTi2O5 glass among high refractive index glasses
5 . 1 20
c F
d =
−
= −
n n
ν n
nF:H F (487 nm) nd:He d (587.6 nm)
nc:H c (656.3 nm) A. Masuno et al., J. Appl. Phys. 108, (2010) 063520.
among high refractive index glasses
Large oxygen polarizability
NA: Avogadro’s number
(
n2 1)
4πα N9Lorentz-Lorenz equation αO2-
20B2O3-80SiO2 1.434
A g
αm: molar polarizability Vm: molar volume
( )
(
nn2 +−12)
= 4πα3VmmNA 20Na25ZnO-75P2O-80B2O3 1.3742O5 1.502
B Ti O 2 57
3/ l BaTi2O5 2.57
Silicate:30 ~ 60 cm3/mol Borate: 25 45 cm3/mol
Vm = 22.8 cm3/mol
Quite large αO2-
•High ionicity of oxygen
•Large contribution of electrons
9Oxygen polarizability
Borate: 25 ~ 45 cm3/mol Phosphate: 27 ~ 60 cm3/mol
(
m) ( )O 1
O2 2
−
−
− = α −
∑
αi Nα around oxygen to the high
refractive index.
9Oxygen polarizability
NO2-:number of oxygen αBa2+ = 1.595 (Å3) αTi4+ = 0 184 (Å3)
These features are different from conventional oxide glasses.
A. Masuno et al., J. Appl. Phys. 108, (2010) 063520.
αTi4+ 0.184 (Å )
∴Σαi = 0.654 (Å3)
g
Origin of high refractive index
Elements in BaTi2O5 glass are highly ionic.
Weaken covalent bond between cations and oxygen
Larger packing density Larger packing density
Higher refractive index
Functionalization by rare-earth doping
Ba0.7Ln0.3Ti2O5.15
nit) M i
Raman scattering
nsity (arb. un Maximum
Phonon Energy 829 cm-1
Raman inten 829 cm 1
0 200 400 600 800 1000 1200
R
Raman shift (cm-1)
SiO t 1100 1
High concentration of Ln
SiO2 system 1100 cm-1 B2O3 system 1265
P2O5 system 1360
High concentration of Ln 2 5 y
GeO2 system 880 TeO2 system 800
BaTi2O5 829
Upconversion of Er
3+doped BaTi
2O
5glass
980 nm B E Ti O
20 4F
7/22H11/2
4S3/2 980 nm ~ 550 nm
x = 0.50
4S3/2 4F9/2
Ba1-xErxTi2O5+x/2
10 15
3/2 11/2 4F9/2
4I9/2
4I
03 cm-1 ) y (a. u.)
0.20 0.30 0.40
2H11/2,4S3/2 green
5
10 I11/2
4I13/2
Energy (10 intensity
0.05 0.10 0.20
2H11/2
4F9/2 red
0
E
4I15/2
400 500 600 700 800
wavelength (nm)
0.01
Energy diagram of Er3+
ity (a. u.)
2H11/2
4S3/2
4F
Different composition
dependence Energy diagram of Er
mission intensi F9/2
Different Strong upconversion luminescence 0.0 0.1 0.2 0.3 0.4 0.5
em
x
process
Luminescent process of Er
3+doped BaTi
2O
5glass
9Green
ET: 2 4I11/2 → 4I15/2 + 4F7/2 ESA: 4I11/2 +hν → 4F7/2
and then
4F7/27/2 → 2H11/211/2 → 4S3/23/2 strong luminescence in low concentration
→main process is ESA.main process is ESA.
9Red
Green process + 4S → 4F Green process + S3/2 → F9/2 ET: 4I13/2 + 4I11/2 → 4I15/2 + 4F9/2 ESA: 4I13/2 + hν → 4F9/2
t l i i hi h
strong luminescence in high concentration
→main: 4S3/2 → 4F9/2 and ET
ET: Energy Transfer ET: Energy Transfer
ESA: Excited State Absorption
Glass forming region
Glass forming region of Ba
1-xA
xTi
2O
5Mg A = Mg,Sr: x ≤ 0.05
A = Ca: x ≤ 0.90
Ca Exceptionally large glass-forming region
of Ba1-xCaxTi2O5.
0 0 0 2 0 4 0 6 0 8 1 0
Sr
0.0 0.2 0.4 0.6 0.8 1.0
x
xAO-(1-x)B2O3 xAO-(1-x)P2O5
M xAO (1 x)B2O3 M xAO (1 x)P2O5
Almost the same regardless of the
Gl f i i
Mg
Ca Ca
Mg
Sr Sr
0.1 0.2 0.3 0.4 0.5 0.0 0.2 0.4 0.6
regardless of the alkali-earth ion substituted
Glass forming region: Mg < Ca < Sr < Ba
Sr Sr
Ba Ba
x x
O. V. Mazurin, M. V. Streltsina, T. P. Shvaiko-Shvaikovskaya (Eds.), Handbook of Glass Data, Physical Science Data 15, Part B (single-component and binary non-silicate oxide glasses), Elsevier, Amsterdam, 1985.
Thermal properties of Ba
1-xCa
xTi
2O
5glasses
0.80 x =
b. unit) 0.70
0.60 0.50
TA (arb 0.40
0.30 0.200 15
DT
0.10 0.15 0.12
T and T increased with x
600 800 1000
0.050.03
0.01
Tg and Tx1 increased with x.
ΔT = Tx1 –Tg increased with x.
600 800 1000
Temperature (°C) A. Masuno et al., J. Mater. Chem. 21, 17441 (2011).
Refractive index of Ba
1-xCa
xTi
2O
5glasses
nd:587.6 nm nF:486.1 nm nC:656.3 nm C
F d
d n n
n
−
= −1 ν
Refractive index
increases with increase increases with increase of Ca content.
νdd decreases.
Unexpected result Unexpected result
A. Masuno et al., J. Mater. Chem. 21, 17441 (2011).
Transmittance of Ba
1-xCa
xTi
2O
5glasses
Optical bandgap E
(
h Eopt)
2A
hν = ν − α
Optical bandgap Eopt
α: the absorption coefficient h: the Planck constant
ν: the frequency of light
A: an energy independent constant A: an energy-independent constant
Eopt decreases with
C l l d
increase of Ca content.p
Colorless and transparent
The absorption edge shifted to longer wavelength
Unexpected result wavelength.
A. Masuno et al., J. Mater. Chem. 21, 17441 (2011).
Refractive index dispersion and optical bandgap
Ca substitution
? ?
i d
E d d
? ?
○
Smaller Eopt leads to larger nd.
nd increased Eopt decreased
The problem:
Why does Ca substitution decrease Eopt?
Raman scattering spectra of Ba
1-xCa
xTi
2O
5glasses
The bands at 636 cm-1 and 829 cm-1:
one long Ti O bond and four short Ti O bonds one long Ti–O bond and four short Ti–O bonds The band at 636 cm-1 does not shift.
l Ti O b d i
→one long Ti–O bond remains.
The peak intensity of the band at 829 cm-1 decreases and that of the band at 780 cm-1 increases.
→the lengths of some of the four short bonds g increase
→a narrow distribution of the Ti–O bond length and relaxing the distorted Ti–O polyhedra.
and relaxing the distorted Ti O polyhedra.
A. Masuno et al., J. Mater. Chem. 21, 17441 (2011).
Bandgap decrease by local structure change
Ti 3d
Ti–O bonding state strongly affects the b d
O 2p
band gap.
a narrow distribution of the Ti–O bond length and relaxing the di t t dTi O l h d b l th i h t Ti O b d
→the degree of hybridization of O 2p and Ti 3d orbitals decreases distortedTi–O polyhedra by lengthening some short Ti-O bonds
g y p
→the difference between the bond and anti-bond levels becomes smaller
→bandgap decreases f ti i d i
→refractive index increases
Structural-relaxation-induced high refractive indexg
A. Masuno et al., J. Mater. Chem. 21, 17441 (2011).
The impact of Ca substitution
2 0 2.2
ex nd
Gl th ll t bili d
as the Ca2+ content increases,…
1.8 2.0
ctive ind
•Glass are thermally stabilized.
•Optical band gap decreases.
•The refractive index increases
1 4 1.6
Refrac The refractive index increases.
•The Abbe number decreases.
100 80 60 40 20
1.4
Abbe number νd
The changes in the physical properties caused by Ca2+
substitution are mainly due to the local structure relaxation caused by their different ionic radii.
Structural relaxation induced high refractive index Structural-relaxation-induced high refractive index
A. Masuno et al., J. Mater. Chem. 21, 17441 (2011).
Future work for Ba
1-xA
xTi
2O
5glasses
Ca Mg
Sr Ca
0.0 0.2 0.4 0.6 0.8 1.0
x
12
Aerodynamic levitation furnace at SPring-8 BL04B2 for in-situ XRD
Sr is the neighboring element of Ba
8
10 Tm-100℃
g g
in the periodic table, and Ca is the second neighbor of Ba. Why glass
f i i i i
4 6
BaTi2O5 Ba Sr Ti O
T(r)
forming region is narrow in Sr substitution but wide in Ca
0 2
Ba0.5Sr0.5Ti2O5 Ba0.5Ca0.5Ti2O5 SrTi2O5 CaTi2O5
Structural analysis of undercooling
0 2 4 6 8 10
r (Å)
melt is necessary.
La
2O
3-TiO
2-MO
xsystem
ZrO
La2O3-TiO2 La2O3-TiO2-ZrO2
ZrO2
TiO2 LaO3/2
H. Inoue et al., Opt. Mater. 33, (2011) 1853.
Y. Arai et al., J. Appl. Phys. 103, (2008) 094905.
M. Kaneko et al., J. Am. Ceram. Soc. 95, (2011) 79.
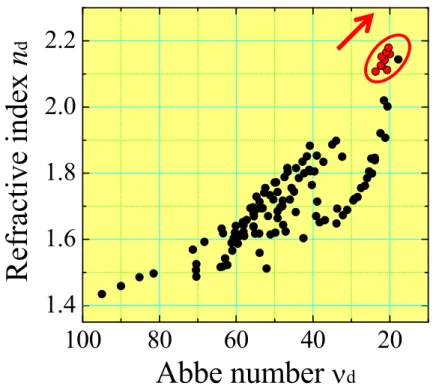
Abbe diagram
2.4 La2O3-TiO2-MOx
2.2
dex n
d 2 3 2 xBa1-xCaxTi2O5 2.0
ve in d
1 6 1.8
fracti v
1.4
Re f
1.6100 80 60 40 20
1.4
Abbe number ν
dAbbe number ν
dBaTi
2O
5glass
Unusual crystallization process
Metastable phase formation from BaTi
2O
5glass
λ= 0.4977 Å TP3
sity
γ phase
β phase
Tg
Intens β phase
Tx1 Tx2
5 10 15 20 25
α phase
2θ(λ=04977A)
Before crystallization at 1150 K of the
bl f l i h
stable ferroelectric γ phase, two
metastable phases α (at Tx1) and β (at Tx2)
appeared in sequence. Paraelectric β phase Ferroelectric γ phase
J.Yu et al., Chem. Mater. 21, (2009) 259.
Paraelectric β phase Ferroelectric γ phase
Giant dielectric response at T
x1100 Hz
Tp31150 K Tp1
1001 K
Tp2 1038 K Tg
960 K
1038 K
Tcry1994 K
Tcry2 1018 K
cry1 0 8
Measurement of Second harmonic generation
Nd/YAG Laser
IR filter
mirror Nd/YAG Laser
1064 nm
lens harmonic
separator
Monochro meter
Digital PM
oscillometer 532 nm
PC Thermometer
TC
temperature controller heater
Giant Second harmonic generation at T
x1SHG appeared at Tx1 and disappeared at Tx2.
increasing temp and disappeared at Tx2.
Thi b h i t t ll
SH intensity is 5 times larger
increasing temp.
decreasing temp.
Tc
This behavior totally corresponds to that of dielectric constant.
y g
than g phase
Direct evidence of l i b
correlation between α phase crystal structure and giant dielectric
glass α β γ
a d g a d e ec c response
γ (paraelectric) γ (ferroelectric)
A. Masuno et al., Appl. Phys. Express 4, (2011) 042601.
Mechanism of giant response at T
x110 glass
100 kHz
5 10
×10-6
glass
α phase crystallization
0
ε' 5
Grain boundary y
Polar nanocrystals are ordered by an electric field.
9600 980 1000 1020 1040 temperature (K)
Grain boundary
(Maxwell-Wagner effect)
9Giant SHG response at Tx1: α-BaTi2O5 has non-centrosymmetric (polar) structure.
9The instant dielectric jump at Tx1 was caused by the alignment of polar nanocrystals of α phase.
9Th l di l t i t t f T t T l i d b th M ll W
9The large dielectric constant from Tx1 to Tx2 was explained by the Maxwell–Wagner effect at the grain boundaries between the glass and the partially crystallized α phase.
By in-situ SHG observation during crystallization process, we obtained the first direct
A. Masuno et al., Appl. Phys. Express 4, (2011) 042601.
evidence that the alignment of polar nanocrystals caused the giant dielectric response.
Ba
1-xCa
xTi
2O
5glass
Crystallization of ferroelectric phase
Single phase crystallization from BaTi
2O
5glass
We found that crystallization from the glass was useful for single phase
preparation of BaTi2O5. preparation of BaTi2O5. stable
region
~10 ºC
Control of ferroelectric properties by
substitution for Ba as well as BaTiO3 system.
S B S Ti O ( 0 12) Previous reports;
N. Zhu and A. R. West, J. Am. Ceram. Soc. 93, (2010) 295.
Sr:Ba1-xSrxTi2O5 (x < 0.12)
→ arc-melt method
X. Yan et al., J. Ceram. Soc. Jpn. 115, (2007) 648.
, , ( )
b c
a I l 0 54 /Å3
KF:Ba1-xKxTi2O5-xFx (x < 0.05)
→ sol-gel + SPS
J. Xu and Y. Akishige, Appl. Phys. Lett. 92, (2008) 052902.
a Iso value = 0.54e/Å3
C. Moriyoshiet al., Jpn. J. Appl. Phys.48, (2009) 09KF06 .
Results: heat treatment condition
1000 ºC 1000 ºC 1100 ºC 1200 ºC
Ba1-xCaxTi2O5
○:single phase 1000 C
10 min.
1000 C 12h.
1100 C 10 min.
1200 C 12 h.
0 ○
○:single phase
△:slight impurity of BaTiO3
×:almost no BaTi2O5 phase
0.05 ○
0.07 ○
0 10 ○ ○ ○ ×
0 < x < 0.07
as stable as BaTi2O5
0.10 ○ ○ ○ ×
0.12 ○ △ ○
0.15 ○ △
0.10 < x < 0.12 2 5
decreasing stability 0 15 < x < 0 30
0.15 ○ △
0.20 ○ △
0.30 ○ △
0.15 < x < 0.30 metastable phase 0.40 < x
no Ba Ca Ti O phase
0.40 ×
Heating rate: 20 ºC/min.
(5 ºC/ i f 1200 ºC )
no Ba1-xCaxTi2O5 phase
(5 ºC/min. for 1200 ºC )
Results: dielectric constant
3000
x = 0
tant ε'
1 MHz Ferroelectric transition temperatures were
observed in all Ba1-xCaxTi2O5 phases (x ≤ 0.30)
1000
2000 0.01 0.05 0.07
ectric const
500
The peaks were broaden with increase of x.
0 200 400 600
0 1000
diele 500
temperature (℃)
2500 0.10 0.12
ε'
400
(℃)
2000
0.15 0.20 0.30
c constant
T P 300
dielectric 1500
0.0 0.1 0.2 0.3 200
0 100 200 300 400 500 600 temperature (℃)
x
TP dropped 250 ºC.
Results: lattice constants
16 90
)
Change ratio of lattice constants
( )
Ba1-xCaxTi2O5
16.853.95 16.90
a (Å)
0 0
( )
0 0
0 l
l l
ll = − x
Δ l0:lattice constant at x = 0 lx:lattice constant at x
9 45
b (Å) 3.90
-0.4 -0.2 0.0
(%)
9.40 9.45
c (Å)
1 0 -0.8 -0.6
a b
Δl/l 0 (
102.5 103.0
β (°) 0.0 0.1 0.2 0.3 0.4
-1.2
-1.0 b
c
x
605 610
V (Å3 )
Decrease ratio of b axis is larger than other x
axes.
→affect ferroelectric properties
0.0 0.1 0.2 0.3 0.4
V 600
x
→affect ferroelectric properties effectively
Results: Correlation between T
Pand b axis length
500 Ti2O6 Ti1O6 Ti3O6
400
℃)
T (℃ P 300 Ba1
Ba2
3.94 3.92 3.90 200
Ba1-O12 Ba2-O12
3.94 3.92 3.90 b-axis length (Å)
Strong correlation between TP and Strong correlation between TP and b axis length
Ba-O bond length distribution in BaO12 polyhedra
Site selectivity of Ca in Ba
0.95Ca
0.05Ti
2O
5Atom g x y z U [10-2Å2]
Ba0.95Ca0.05Ti2O5
Ba1 0.944(1) 0.36858(3) -0.002(1) 0.01753(6) 0.647(7) Ca1 0.056(1) 0.36858(3) -0.002(1) 0.01753(6) 0.647(7)
Ba2 1 0 0.5 0.5 0.67(2)
Ti1 1 0 0390(1) 0 024(1) 0 2096(2) 0 83(6)
Ti1 1 0.0390(1) -0.024(1) 0.2096(2) 0.83(6)
Ti2 1 0.2073(1) 0.003(3) 0.3724(2) 0.70(4)
Ti3 1 0.3337(1) 0.504(3) 0.3044(2) 0.77(5)
O1 1 0.0356(3) 0.529(3) 0.2102(5) 0.3(2)
O2 1 0.1108(3) 0.028(3) 0.4271(5) 0.2(2)
O3 1 0.1510(3) 0.025(4) 0.1836(5) 0.2(2)
O4 1 0.1749(3) 0.510(8) 0.6608(5) 0.2(2)
O5 1 0.2344(3) 0.518(5) 0.3953(5) 0.2(2)
O6 1 0.2892(3) 0.518(6) 0.1249(6) 0.6(2)
O7 1 0.4424(3) 0.508(8) 0.2884(5) 0.3(2)
O8 1 0 0.01545 0 0.3(2)
RWP = 0.0290, RI = 0.0173, RF = 0.0104.
( )
b a c
C2, a = 16.9036(1) Å, b = 3.93030(2) Å, c = 9.40715(6) Å, β = 102.9640(4)°.
Ba/Ca Ba WP 0.0 90, I 0.0 73,
F 0.0 0 .
Ca ions occupy only the distorted Ba1 site.
Ba/Ca
C. Moriyoshi et al., J. Phys. Soc. Jpn. 81, (2011) 014706.
XANES spectra of Ca in Ba
1-xCa
xTi
2O
5Ba1-xCaxTi2O5 calculation
CaTiO3 x = 0.40 unit)
2c
b. unit)
0.30
0.20 ensity (arb. 4c
nsity (arb
0.10
4050 4060 4070 4080 4090
Int
Inten 0.05 Energy (eV)
Ca site selectivity is realized only at
4020 4040 4060 4080
E ( V)
0.01 Ca site selectivity is realized only at low Ca concentration.
In metastable ferroelectric phase, Ca occupies both 2c and 4c sites
Energy (eV)
Fluorescence method at SAGA-LS
occupies both 2c and 4c sites.
Crystallization of ferroelectric phase
Ferroelectric phase crystallized from Ba1 xCaxTi2O5 glass.
Ferroelectric phase crystallized from Ba1-xCaxTi2O5 glass.
Ferroelectric properties depend on b-axis bond length.
0 ≤ x ≤ 0.07: stable phase
site selective Ca doping site selective Ca doping 0.10 ≤≤ x ≤≤ 0.30: metastable phasep
random site doping of Ca
Ba1-x1 xCaxxTi22 5O5 glass is useful as a precursor of ferroelectric phase.g p p
Summary: TiO
2glass system
9Optical properties
Colorless and transparent in visible and near IR region Colorless and transparent in visible and near IR region
High refractive index > 2.1 and low wavelength dispersion Strong upconversion luminescence due to low phonon energyg p p gy 9Glass forming region
bi ( i ) d ( i i
binary (La2O3-TiO2) and ternary (BaO-TiO2-MOx, La2O3-TiO2- MOx) systems were determined.
Ca doping caused characteristic changes in physical and Ca doping caused characteristic changes in physical and structural properties.
9Unusual crystallization process
Giant SHG response at a phase crystallization temperature.
M bl f l i h lli d f C d d l
Metastable ferroelectric phase crystallized from Ca doped glasses.
Nb
2O
5system
dex 2.6
2.4
active ind
1
Refra 2.2
0 30L O 0 70Nb O
1 mm 400 600 800 1000
Wavelength (nm)
C l l d t t
0.30La2O3-0.70Nb2O5
spherical glass was prepared by containerless processing
Colorless and transparent
High refractive index over 2.2 by containerless processing.
φ = 2 ~ 3 mm suitable for small optics used in visible and infrared region
A. Masuno and H. Inoue,
Appl. Phys. Express 3, 10261 (2010). e.g. lens, endoscope, fiber collimator
New glass system ~ frontier in glass science ~
9Without networkformer
TiO2, Nb2O5 glasses prepared by containerless processing 9Large oxygen packing density
9Large oxygen polarizability
Deviation from the classic glass forming rules
Through investigating physical and structural properties, new and extended glass forming rules should be made.
l i i / i i b f i i d di i i l i d
Refferences
1. Glass Formation in LaO3/2–TiO2 Binary System by Containerless Processing
M. Kaneko, J. Yu, A. Masuno, H. Inoue, M. S. V. Kumar, O.
Odawara, S. Yoda
J Am Ceram Soc 95(2012) 79
8. Refractive index dispersion, optical transmittance, and Raman scattering of BaTi2O5 glass
A. Masuno, H. inoue, J. Yu, Y. Arai J. Appl. Phys. 108, (2010) 063520.
9 Charge Density Study of Metastable State in BaTi O with J. Am. Ceram. Soc. 95(2012) 79.
2. Site-selective Calcium Substitution in BaTi2O5: Effect on the Crystal Structure and the Ferroelectric Phase Transition
C. Moriyoshi, Y. Kuroiwa, A. Masuno, H. Inoue J. Phys. Soc. Jpn. 81, (2011) 014706.
9. Charge Density Study of Metastable State in BaTi2O5with Fivefold Coordinated Ti
C. Moriyoshi, S. Miyoshi, Y. Kuroiwa, J. Yu, Y. Arai, A.
Masuno
Jpn. J. Appl. Phys. 49, (2010) 09ME10.
y p , ( )
3. Structural-relaxation-induced high refractive indices of Ba1-
xCaxTi2O5glasses
A. Masuno, H. Inoue, Y. Arai, J. Yu, Y. Watanabe J. Mater. Chem. 21, (2011) 17441.
p pp y , ( )
10. Charge Density Study on Phase Transition in BaTi2O5 Ferroelectric
C. Moriyoshi, N. Okizaki, Y. Kuroiwa, J. Yu, Y. Arai, A.
Masuno 4. Effect of substituting Al2O3and ZrO2on thermal and optical
properties of high refractive index La2O3-TiO2glass system prepared by containerless processing
H. Inoue, Y. Watanabe, A. Masuno, M. Kaneko, J. Yu Opt Mater 33 (2011) 1853
Jpn. J. Appl. Phys. 48, (2009) 09KF06
11. Comprehensive Structural Study of Glassy and Metastable Crystalline BaTi2O5
J. Yu, S. Kohara, K. Itoh, S. Nozawa, S. Miyoshi, Y. Arai, A.
Masuno H Taniguchi M Itoh M Takata T Fukunaga S Opt. Mater. 33, (2011) 1853.
5. Giant second harmonic generation from metastable BaTi2O5 A. Masuno, Y. Kikuchi, H. Inoue, J. Yu, Y. Arai
Appl. Phys. Express 4, (2011) 042601.
6. Structure of Glassy and Metastable Crystalline BaTi2O5
Masuno, H. Taniguchi, M. Itoh, M. Takata, T. Fukunaga, S.
Koshihara, Y. Kuroiwa, S. Yoda
Chemistry of Materials 21, (2009) 259.
12. Thermal stability and optical properties of Er3+doped BaTi2O5 glasses
y y
Fabricated using Containerless Processing
J. Yu, S. Yoda, A. Masuno, H. Natsui, M. Kaneko Ferroelectrics 402, (2010) 130.
7. High Refractive Index of 0.30La2O3-0.70Nb2O5Glass
g
A. Masuno, H. Inoue, J. Yu, Y. Arai, F. Otsubo Adv. Mater. Res. 39-40(2008) 243.
Prepared by Containerless Processing A. Masunoand H. Inoue
Appl. Phys. Express 3, (2010) 102601.