PAPER Special Section on Image Media Quality
Development of a Novel Accurate Analysis System Regarding Information Processing within the Gazing Point
Tsuyoshi KUSHIMA†,††a),Student Member, Miyuki SUGANUMA†,†††b),Member, Shinya MOCHIDUKI††††c),Student Member,andMitsuho YAMADA††††d),Senior Member
SUMMARY Over the last 10 years, tablets have spread to the point where we can now read electronic books (e-books) like paper books. There is a long history of studies of eye movement during reading. Remarkable results have been reported for reading experiments in which displayed letters are changed in conjunction with eye movement during reading. However, these studies were conducted in the 1970s, and it is difficult to judge the detailed descriptions of the experimental techniques and whether the display time was correctly controlled when changing letters. Here, we propose an experimental system to control the display information exactly, as well as the display time, and inspect the results of past reading research, with the aim of being at the forefront of reading research in the e-book era.
key words: electronic book, eye movement, reading, saccade, gazing point
1. Introduction
An exclusive terminal used to be necessary to read elec- tronic documents or books, but tablets and smartphones now support the global spread of electronic books (e-books).
We have studied differences in eye movement, com- paring the movement that occurs when reading a conven- tional paper book to that which occurs when reading an e-book. Differences in page-turning behavior when reading an e-book vs. a paper book correspond to differences in eye movement. It was shown that the eyes of the subjects moved in a straight line while reading an e-book, but depended on the reader’s page-turning behavior with a paper book[1].
By developing such eye-movement studies, we expect to be able to propose a new display method that reflects the human receiving characteristics of visual information, not only for e-books, but for all devices that display visual information.
The history of eye-movement studies during reading is long and respected, and many reports have already been performed not only on eye-movement characteristics during reading, but also on the perception range (effective visual field), the recognition of letters during reading, etc. Such
Manuscript received January 4, 2019.
Manuscript revised April 4, 2019.
†The authors were with Tokai University, Tokyo, 108-8619 Japan.
††The author is with The University of Electro-Communications, Chofu-shi, 182-8285 Japan.
†††The author is with Dai Nippon Printing Co., Tokyo, 162-8001 Japan.
††††The authors are with Tokai University, Tokyo, 108-8619 Japan.
a) E-mail: [email protected] b) E-mail: [email protected] c) E-mail: [email protected] d) E-mail: [email protected]
DOI: 10.1587/transfun.E102.A.1205
studies were carried out intensively for approximately 10 years, starting in about 1970 when it first became possible to control the information displayed on a computer display and measure the progress of eye movement across the screen. In particular, the study of the perception range (effective visual field) and the results of research regarding letter recognition at the gazing point have good affinity with e-books, which are characterized by the ability to change the display information in real time.
We therefore began to examine whether we could make use of these results to propose a new display method for e- books, or to suggest methods for the evaluation of e-books.
Advances in TV technologies have greatly contributed to the progress of these studies, which began to make use of switchers and television cameras. One method of studying the perception range makes use of a window within which information can be changed according to eye movement, and this method has produced remarkable results[2]. The de- tails of this method, which involves the detection of saccades during reading, is summarized below[3],[4]. While it is be- lieved that these previous studies were performed with what was then the best technique, there is not really a detailed description of how information was displayed. This is partly due to the technology that was available at the time, which was all analog. Researchers did not have high-speed cam- eras that could easily acquire content continually, and it was difficult to acquire an eye-movement sequence by controlling the window exactly at that time.
We thought that it was necessary to first consider the literature on the recognition of letters in the effective visual field and on the gazing point to determine what might be applicable to a study of the display method of e-books and tablets, which can control displayed images in real time.
In recent years, some studies have used a window method of assessing second language reading [5] in addi- tion to a multiresolution display[6]. Chi et al. investigated the size of the perceptual span when reading English among Japanese university students who learned English as a for- eign language. Also, Lester and George investigated the re- lationship between user performance and a multiresolution display.
Chi et al. investigated the perceptual span in second language reading. They did not conduct any experiments related to the time characteristics of human visual informa- tion processing. Lester and George, using a Gaze Contin- gent Multi-Resolution Display, investigated the time during Copyright © 2019 The Institute of Electronics, Information and Communication Engineers
which a blur or flicker caused by an image changing went unnoticed rather than the time required for humans to obtain visual information.
To solve these problems, we developed an experimen- tal device that can control the display information around the gazing point by acquiring eye movement. The timing of the displayed image around the gazing point was accu- rately controlled by the vertical synchronizing signal of the display unit. Furthermore, using a high-speed camera, we showed that the display changed according to the researcher’s intention. We believe the device made it possible to per- form an accurate experiment that clarified the information- processing mechanism at the gazing point within the gazing duration of one gazing point, said to be 200∼500 ms. In ad- dition, the analysis of visual-information acquisition, visual- information analysis, and the decision regarding the position of the next gazing point were conducted using this system.
By clarifying the acquisition time of the visual information, the processing time of the visual information, the time re- quired to determine the next gazing point, the size of the window necessary for each process, etc., using this system, we believe that this study can provide new information, not only suggestions for new display methods that match the flow of eye movement and visual information processing, but also findings regarding the visual processing at the gazing point, in the parafovea, and in the peripheral visual field.
The rest of this paper is organized as follows. We summarize the results of previous reading studies in eye- movement research in Sect. 2, and describe the findings and the problems with the studies using the window in Sect. 3.
We introduce the developed measurement device in Sect. 4.
Section 5 examines the precision of the device and demon- strates why a proposed experiment cannot be performed with the liquid crystal display (LCD) usually used currently, and show how we performed the experiment using a cathode-ray tube (CRT) display that was preserved in our laboratory. We investigate the differences between our findings made un- der the same conditions used in previous studies in Sect. 6.
Section 7 contains a summary, and we discuss future devel- opments in Sect. 8.
2. Reading Studies Using Past Eye Movement Measure- ment Technique
Using a technique to record observations of eye movement reflected in a mirror, Javal was the first to report that eye movement during reading is not continuous, but rather a series of saccades and fixations. As he called this movement
“la serie de saccade,” “saccade” is the term currently used for jumping and intermittent eye movement[7].
An example of an ordinary person’s eye movement dur- ing reading is compared to a speed-reader’s in Fig. 1[8].
Eye movement in reading generally repeats gazing points and saccades along a sentence line. When a reader reaches the end of the line, a big saccade occurs to move to the next line. In the case of a speed reader, she finished reading two pages with only three gazing points in 0.53 s; that is, from
Fig. 1 Eye movement of an ordinary person and speed-reading master.
the gazing point to the right of the page’s center to two gaz- ing points to the left of the page’s center. It is expected that the throughput of visual information at one gazing point in a general reader is different from that of a speed-reader.
By “gazing point,” we refer to a fixation point of the eye movement that involves watching one point closely. Eye movement does not really cease at a fixation point, but in- stead the eye makes continuous miniature eye movements.
A saccade is a high-speed eye movement that reaches a max- imum speed of 300∼600 deg/s.
The purpose of this article is to clarify what kind of processing is performed at each gazing point by separating the gazing points from reading eye movements.
In the early 20th century, Huey had already drawn the following conclusions about eye movement in reading using a measuring method that involved an eyecup made of thin hardened gypsum powder and a kymograph[9]–[11].
(1) 4∼5 fixations per sentence line at a distance of 33∼42 cm when reading the American Journal of Psy- chology.
(2) The number of words read in one fixation is highest when the line length is 40∼60 mm and approximately 3∼4 words for a sentence about 2.1∼12.1 cm long.
(3) The number of fixations per line does not change, even if the reading distance is double.
(4) The number of fixations per sentence line does not change, even if the type is changed from 10 points to 8 points.
(5) The fixation duration is about 200 ms, but there is large variance.
3. Research of Effective Visual Field Which Used “Win- dow”
We now explain the technique used in previous studies and the problems inherent in the gazing point in experiments on the effective visual field using the window, and describe how we will solve these problems. It is thought that there are at least two domains with different functions in the effective visual field. They are the domain to read a letter and the
domain to decide on the next gazing point. This idea was first proposed in 1939 by Takemasa[12].
Hochberg proposed two ways of thinking of cognitive search guidance (CSG), which directs the eye to the next gazing point based on the meaning of the sentence, and pe- ripheral search guidance (PSG), which establishes the nature of the overall peripheral view[13].
Abrams and Zuber reported that the probability of a gazing point occurring in the space between words decreases when that space increases in size[14].On the other hand, Rayner found that the probability of a gazing point occurring on the center of a word or a little to the left of center is higher when the space between words increases in size[15].
O’Regan suggested that the probability of gazing at the word
“the” is less than that of other three-letter words[16]. These studies all support the concept of PSG. O’Regan[16]also reported research to support the concept of CSG.
Research on the effective visual field of the gazing point increased dramatically with the development of the experi- mental technique using the window.
Saida and Ikeda reported the processing range of a sin- gle gazing point to be approximately 13 characters[17]when reading Japanese text by the window method when the let- ters in the window area were masked. This technique was developed by Watanabe and Yoshida to clarify the kinds of processing carried out at a gazing point[18].
McConkie and Rayner in the United States conducted experiments similar to those of Saida and Ikeda during the same period[19]–[21]. They also found that the effective visual field was approximately 13 characters. In addition, it was estimated that readers proceed by overlapping the ef- fective visual field, which is wider than the approximately 3.2 characters of the mean saccade. Rayner reported that this overlap was similar for material printed in English[22].
Furthermore, Osaka studied the effective visual field while changing the width of the window, and reported that sen- tences mixed with kanji (Chinese characters) and hiragana (the Japanese cursive syllabary) could be read faster than sentences with only hiragana, and that the effective visual field for kanji and hiragana sentences was about 20 degrees, while the effective visual field for hiragana sentences was about 10 degrees[23].
The purpose of this study is to review the experimental method using the window and to suggest an experimental device that can perform such experiments more accurately and in more detail. Of course, those studies used the best apparatus available at that time, and we do not seek to critique their techniques or results.
Saida and Ikeda’s experimental method involved two television cameras. The eye movements of subjects were acquired by the limbus tracking method using photocells, and the X,Y positions of the eye movements were input to an X-Y oscilloscope to generate an oblong rectangular wave pattern on the oscilloscope display at the X,Y position of the eye movement. Television camera 2 was then used to photograph this oscilloscope. Camera 1 was used at the same time to film the board on which the sentences were
written. Part of the image recorded with television camera 1 was changed into a rectangular image taken by television camera 2 with an effect like the wipe effect of television switchers. In this way, the masking window moved along the eye movement.
When the size of the rectangular shape exceeded 13 characters, Saida and Ikeda showed that there were no dif- ference between the state with window and the state without window. In their experiment, the rectangle was directly dis- played on the oscilloscope based on the output of eye move- ment, and the area around the gazing point did not change, because the gazing point was not detected. Due to the tele- vision cameras and CRT display, we expect that there was a considerable afterimage and afterglow, but this was not de- scribed. Because the window moved in conjunction with the eye movement, it is thought that the window displayed time changes based on the gazing duration. Therefore, the display time of the window was not controlled. In addition, since their method did not insert an image for masking after the rectangular pattern to wipe the sentences filmed by Camera 1, the image of the sentences persisted by iconic memory which was visual short-term memory.
In contrast, McConkie and Rayner input the eye move- ment acquired by a limbus tracking method into a minicom- puter PDP-6 and controlled the indication of a DEC Model 340 display, which had small and capital letter characters built into the display. In addition, since this display uses a P-7 fluorescent substance with the blue ingredient of a short afterglow and the yellow ingredient of a long after- glow, they applied blue gel to the display surface and used only the blue ingredient. They also used a PDP-10 at the same time to record the data. This technique could be called epoch-making in that it was the first with complete com- puter control. Using the built-in display with characters, they performed various experiments, not only masking the gazing part, but changing letters into similar letters, short- ening the spaces between words, and burying the peripheral area outside the window with an X.
McConkie and Rayner fixed subjects’ heads using a byte board on a chin rest. There was no description of a byte board in the Saida and Ikeda experiment, but they used a rectangular image for masking not just a single line, but also the lines above and below, and so it can be inferred that some head movement was allowed. Therefore, their method did not compensate for head movement intentionally.
Chi et al.[5] conducted the same experiment as Mc- Conkie and Rayner [19]. They used LCD in their experi- ment. However, they did not discuss the display properties including the afterglow characteristics of the LCD. Lester and George used the window method in their experiment and controlled the display time. They changed the picture resolution according to the subject’s eye movement[6]. They focused on the perceptual span not in reading but in viewing images. Therefore, their experiment did not have the same purpose as ours.
Incidentally, a CRT with a short afterglow is better for such experiments than an LCD of the hold type. Although
a CRT display with a short afterglow that can display even 120-Hz time sequential 3D is available that is comparable to those used at that time, the production of CRT displays has ceased and they have become difficult to obtain.
Based on these facts, we decided to develop a system to clarify visual information processing at the gazing point that is appropriate for the e-book era.
4. A Newly Developed Analysis System of Visual Infor- mation Processing in the Gazing Point
4.1 Development Target
Based on the problems described in Sect. 3, we aimed to include the following in the analysis system.
(1) Speed is applied to detect saccades.
(2) The image at the gazing point can be changed to any image at any time.
(3) The display timing of the masking image is accurately controlled by matching the timing of the display and the drawing and by inserting a random dot image to mask
“the masking image”.
(4) Experiment can be conducted without a byte board.
(5) Confirmation that masking is accurately displayed is provided by a high-speed camera.
4.2 Configuration of the Experimental System
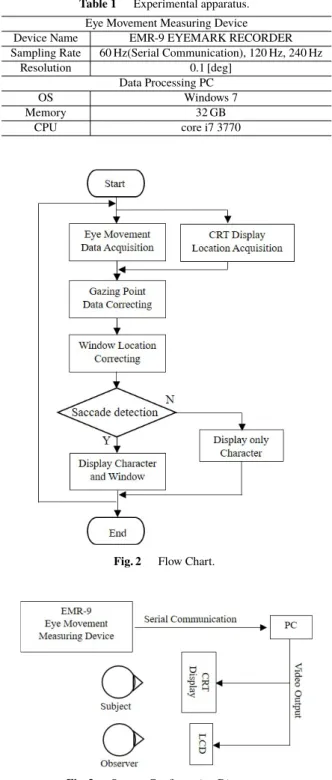
We built a system that is able to concretely clarify what kind of visual information processing is carried out in the effective visual field. Table 1 lists the apparatus used. Figures 2 and 3 show a flow chart of the developed system and a schematic configuration, respectively. We measured each subject’s eye movement using an EMR-9 (NAC Image Technology Inc.).
4.3 Operation of the Experimental System
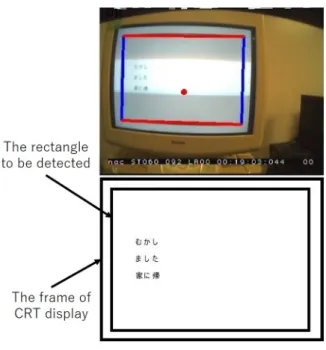
We use two displays an LCD for the observer and a CRT display for the subject shown in Fig. 3. Figure 4 contains samples of the images used in the experiment. The system comprises two screens, one for the observers on the upper image in Fig. 4 is displayed on the LCD and the other for the subjects on the bottom image in Fig. 4 is displayed on the CRT display. Gazing points, a document and a detected rect- angular(red and blue lines represent detected rectangular) are displayed on the observer’s screen, while the subject’s screen shows only the document. The same document is displayed on both screens. An interference image is displayed only on the subject’s screen at the time of a saccade distinction. The screen viewed by the subjects is displayed on a CRT dis- play because displayed image can be changed by high speed using a CRT display. And the screen for the observers is displayed on an LCD. The system carries out two threads in parallel. By doing image processing with OpenCV, one of the threads, which corresponds right side loop on Fig. 2, acquires a rectangular position displayed on a CRT display
Table 1 Experimental apparatus.
Eye Movement Measuring Device
Device Name EMR-9 EYEMARK RECORDER
Sampling Rate 60 Hz(Serial Communication), 120 Hz, 240 Hz
Resolution 0.1 [deg]
Data Processing PC
OS Windows 7
Memory 32 GB
CPU core i7 3770
Fig. 2 Flow Chart.
Fig. 3 System Configuration Diagram.
by a picture from EMR-9’s field of visual camera. The other thread, which corresponds left side loop on Fig. 2, acquires eye-movement data by serial communication from the EMR- 9 and subtracts the rectangular top left corner coordinate on the screen from the acquired eye movement data. Because the EMR-9 eye-movement data are given in terms of the coordinate systems, and the top left corner of the field of vision camera is the origin, we can set the top left corner of the rectangle on the screen as the origin by subtracting the coordinate of the top left corner of the rectangle taken by the
Fig. 4 Image of experiment.
field of vision camera of the EMR-9. With this procedure, we can cancel the displacement of the display location of the window caused by head movement at the same time we convert eye-movement data given in terms of the field of vi- sion camera coordinates into the rectangular coordinates on the display. We can thus do the experiment without a byte board.
As shown in the upper image on Fig. 4, there is distor- tion with the EMR-9’s field of vision camera. It is thought that the distortion may influence the correctness of the coor- dinates of the gazing point. Therefore, we investigated how the distortion influences the correctness of the coordinates of the gazing point. Because we only used horizontal values in the experiment, we show the results on the horizontal axis.
In the case in which the gazing point was located in the center of the rectangle on the CRT display, there was only a±1- pixel error. In the case in which the gazing point was located in the corner of the rectangle, which is the worst case, there was a±18-pixel error at the horizontal axis. Because the character size was 30 pixels, the distortion did not influence the correctness of the coordinates of the gazing point.
Figure 5 shows the time flow of the process of display- ing a window around the gazing point. It takes 52 ms to take in eye-movement data from the EMR-9, and although determining the gazing point requires 85 ms, it is within the duration of saccadic suppression, which is the phenomenon in visual perception in which the visual processing during the saccade decreases[24]. A window is displayed in the gazing part of the presentation image after∆t1, and it returns to the original image after∆t2.
An example of this process is shown in Fig. 6. The red point on the image is the gazing point. The blue rectangle on the image is the image displayed to the subject. The system displays only the first three letters of each line while saccadic
Fig. 5 Flow of processing at a gazing point.
Fig. 6 Image of the changing pictures.
eye movements are not detected as shown in the upper left figure. If the system detects saccadic eye movement when a gazing point moves to the next point as shown in the upper right figure (an open red circle represents a previous gazing point, a filled red circle represents the next gazing point, and a filled blue circle represents the gazing point at the second time point), the system displays the window image as shown in the bottom right figure at∆t1sec after the saccade detection. The window image is the letters cut and brought down from the presented sentences around the window area.
The window image is displayed for∆t2sec. After∆t2sec, a random dot image is displayed at the place where the window image was displayed during one frame. These processes are repeated at every saccade detection until the subject finishes reading the sentences. Parameters such as∆t1 and∆t2 are arbitrarily changed within the gazing point. In addition, the window image size is also changed.
It was necessary to control the image-substitute time of the gazing part using units of ms, considering that the duration of saccadic suppression is about 200 ms. Because the refresh rate of an LCD is 60 Hz, the drawing was carried out about every 16.7 ms. Therefore, a delay of about 16.7 ms was the maximum that occurred. In the case of the im- age substitution around a gazing point being processed after the drawing of the display was performed, the image sub-
Fig. 7 Image of the vertical synchronization.
stitution might not occur on the display. Therefore, vertical synchronization of the display was necessary to synchronize the period of the drawing of the display and the drawing of the graphic program to carry out the image substitution exactly.
Figure 7 is a time chart of the program’s vertical syn- chronization and drawing. The dashed line indicates the drawing on the display, and the solid line shows the drawing of the program. The drawing interval of the display is about 16.7 ms when the refresh rate of the display is 60 Hz. The drawing interval of the program is ∆t2 and the letters “A”
and “B” are drawn in turn. At the upper diagram of Fig. 7 is an example in which the graphics program has not detected vertical synchronization. In the left red rectangle in the up- per diagram of Fig. 7, after the graphics drawing of the letter
“A” is finished, the display output is letter “A,” and letter “A”
is displayed. On the other hand, in the right red rectangle in the upper diagram of Fig. 7, after the graphics drawing of the letter “B” is finished, the graphics drawing of the letter
“A” starts before the display output, the display output is the letter “A,” and the letter “B” is not displayed. Therefore, as shown in the lower diagram of Fig. 7, the graphics pro- gram starts drawing graphics when vertical synchronization is detected. As a result, the graphics are correctly drawn in accordance with the display synchronization. To implement the vertical synchronization, we used library SharpDX to make a program using DirectX in C#[25].
5. Development of the Experimental System
We first inspected the precision of high-speed drawing. We initially considered the LCDs that are becoming mainstream and describe the results of a precision inspection with a CRT display afterwards.
5.1 Inspection of the LCD
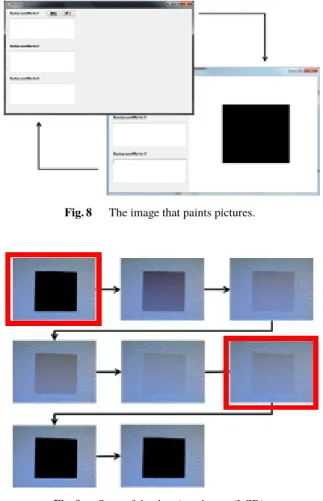
We used an AOC AG251FZ/11 LCD. By photographing the display, which showed pictures described below with a high-speed camera, the afterglow time was estimated. A high-speed camera using a CASIO EX-F1 took photos at a rate of 300 frames per second (fps). A black rectangle was displayed on and off at a rate of 60 Hz, the refresh rate of the LCD. Figure 8 shows an example of the images; photographs
Fig. 8 The image that paints pictures.
Fig. 9 State of the drawing change (LCD).
taken by the high-speed camera at the time of the drawing change are shown in Fig. 9.
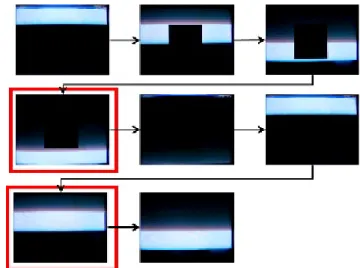
Figure 9 shows the photographs taken every 1/300,s when a drawing change occurs. It was considered that the rectangle was displayed at the first step red frame and was ex- tinguished at the second step red frame. However, a drawing change is carried out without the rectangle completely dis- appearing between the two red frames. Therefore, we pho- tographed the display which showed the picture described above with a high-speed camera to measure the time it took for a rectangle to completely disappear. Figure 10 shows an example of these photographs.
The rectangle begins to disappear in the red frame at the top left corner of Fig. 10, but it takes 5 frames to completely disappear. Because we photographed it at a rate of 300 fps, the interval of each picture is about 3.3 ms. Therefore, about 20 ms are required for a rectangle to completely disappear.
Even if the image were replaced at∆t2of Fig. 5, the afterglow of the previous image would persist for a while afterwards.
Therefore, a correct measurement cannot be performed. This means that∆t2should be more than 20 ms. Black dots on a white background are displayed relatively quickly, as shown in Fig. 9. However, since it takes about 20 ms to extinguish the black dots, this LCD display, which is one of the fastest available, cannot necessarily be adapted for the purpose of this experiment.
Fig. 10 Images of the transition to complete disappearance.
We should note that there are now 120 Hz and 240 Hz LCDs, which have a refresh rate greater than 60 Hz. How- ever, these LCDs cannot receive input at rates greater than 60 Hz, and they realize their high frequencies by inserting an image that interpolates movement between frames and/or by partially backlighting the display. Therefore, there are not many LCD displays corresponding to inputs of more than 60 Hz, and it would be difficult to apply them in this experiment. In addition, it has been reported that a motion blur occurs due to the high-frequency component of the im- age disappearing[26], because the light stimulation within 1/60 s is approximately integrated with the visual system by the resolving power in the time domain of the human vision system for the hold-type display represented by the LCD when lateral movement is displayed. It is therefore consid- ered that the LCD is not suitable for drawing in the short time needed by a system such as ours. Thus, it was necessary to use a display with a short afterglow to realize the system.
We therefore inspected our proposed system with a CRT of the impulse type with a short afterglow time.
5.2 Inspection of the CRT Display
The production of CRT displays with a short afterglow time has ceased, and they are not sold anymore, but we had a usable one in our lab. Therefore, we thought that this might be the last opportunity to use a CRT display with a short afterglow, and we inspected the CRT display to show CRT is suitable our system under the conditions shown in Fig. 8 using an iiyama, HM204DA with a short afterglow. Actual measurements showed an afterglow time of less than 1/600 s.
The rectangular drawing was carried out in the red frame shown in the middle section of Fig. 11 and was not performed in the red frame shown in the bottom section. Because they were photographed at a rate of 300 fps, the interval of each picture is about 3.3 ms. Therefore, a display change with a 16.5-ms interval was enabled by the CRT display used for the experiment.
6. Difference from Past Study
We consider the ways in which our study with the developed
Fig. 11 State of the drawing change (CRT display).
system differed from past studies. Table 2 lists the problems of the Saida and Ikeda and the McConkie and Rayner exper- iments using the window, and our results that solved these problems.
7. Consideration
7.1 Definition of Gazing Point
As mentioned in Sect. 2, it was reported that eye movement during reading is not smooth but rather is a repetition of gazing and saccades.
Thus, it is possible to classify the saccades and gaze that occur while reading by defining the gazing point. Various reports on the definition of the gazing point have been made.
Eyeballs are not completely stationary even when in the state of gazing, and a small involuntary movement called fixation fine movement occurs. According to their report, Yamada et al. defined gazing points to include the velocity component of fixation fine movement and follow-up motion below a cer- tain speed[27]. In addition, Fukuda et al. reconsidered the definition of gazing points when watching movies because gazing is hardly seen during the viewing of high-speed mov- ing subjects according to the definition of Yamada et al.[28].
In this way, it is reported that the definition of gazing points differs depending on the viewing target. For this reason, it is necessary to examine the definition of the gazing point depending on the experimental conditions, the experimental environment, and the viewing target. In our research, we conducted experiments to obtain definitions of gazing points under the same experimental conditions as in the experiment described in Sect. 7.2.
We conducted an experiment that involved gazing at moving white spots because the eye movements while read- ing are repetitions of gazing and saccades. Gaze movements were acquired by displaying a white spot on the CRT display.
As shown in Fig. 12, the white spot moves from the center of the screen to the left and right every 5 seconds. With a to-and-fro movement representing one set, the subjects
Table 2 Difference from past study.
Detect gazing point Description of afterglow Description of afterimage
Our study 3 3 3
Saida and Ikeda 7 7 7
McConkie and Rayner 7 3 7
Masking by Random dot image Control the indication time Byte board
Our study 3 3 7
Saida and Ikeda 7 7 7
McConkie and Rayner 7 7 3
Fig. 12 Image of experiment in Sect. 7.1.
watched a total of 10 sets. The viewing angle per character of the sentence used in the experiment in Sect. 7.2 was about 1.2 [deg], and the average interval of saccades is 3 to 5 letters in Japanese Kana·Kanji mixed sentences. Therefore, we set three types of viewing angles for the subject, 1, 2 and 3 [deg]
from the center of the screen.
In the analysis it was assumed that 150 ms was required for a person to capture information at a gazing point[27], [28], but this assumption is inappropriate for implementation in real time, so the analysis was carried out at a moving speed calculated from two data. In the two data comparisons, the movement speed was calculated over a period of 1/60 s because the frequency of the serial communication of the EMR-9 was 60 Hz. Therefore, a threshold value for the gazing point was set in units of 1/60 s. We performed the analysis by changing the threshold value from 0.5 to 1.5 [deg]
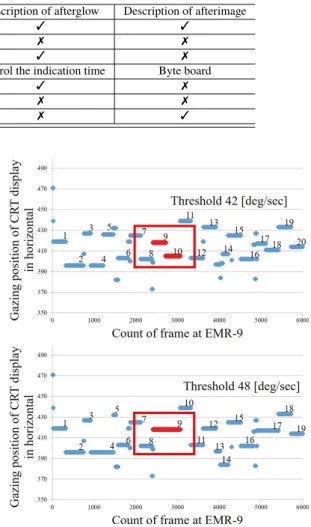
by 0.1 [deg] increments. Therefore, the threshold value of the gazing point was 30 to 90 [deg/s]. Only the results for thresholds of 42 and 48 [deg/s] are shown in Figs. 13 and 14 because the same tendency was observed at thresholds less than 42 [deg] and those above and at viewing angle 2 [deg] and 3[deg]. The subjects were three 21∼26-year-old students at our university with normal visual function. The experiment was conducted following the Tokai University Ethics Committee regulations concerning “research using humans”.
In Figs. 13 and 14, the vertical axis shows the coordinate axis in the horizontal direction, and the horizontal axis shows the time. The numbers in the figure indicate the gazing point detected by the proposed threshold. The theoretical number
Fig. 13 Gazing point distribution with viewing angle 1 [deg].
of gazing points was 20 because the subjects viewed 10 sets. Gazing points were not correctly detected in the red rectangle areas of Fig. 13 when the threshold value was 48 [deg/s]. Therefore, we considered that 42 [deg/s] was closer to the theoretical value in Fig. 13 when counting the number of gazing points, and we could also exclude the error data caused by the eye movement measuring equipment. The red points in Fig. 14 show the 20 gazing points. By comparing the two graphs, it can be seen that there was no difference in the number of gazing points due to the threshold values in Fig. 14.
Therefore, we defined the gazing point as 42 [deg/s] or less and detected saccades in the experiment in Sect. 7.2.
7.2 Reading Experiment by Window
We performed the window experiment with the device that we developed. The subjects were 5 students at our university who were 21∼26 years old. We used the “Elementary school student’s third language” [29]for reading. The size of the window was changed from 3 characters to 15 in increments of 2 characters in reference to reports by Ikeda and Saida, and the reading times were compared. The sentence that
Fig. 14 Gazing point distribution with viewing angle 2 [deg].
we used was 18 characters in length horizontally and 5 lines vertically. Because the average time for a saccade of 10 deg is less than 50 ms[30],[31], we displayed a window between
∆t1, which lasted longer than 50 ms after the occurrence of a saccade during reading, and∆t2around a gazing point. Since the field of vision camera of the eye-movement measuring equipment is operated at 60 Hz, and the CRT display is also displayed at 60 Hz asynchronously, a phase difference of the vertical sync signal between them may cause difficulty for the processing of the field of vision camera image.
Therefore we used 72 Hz (period 13.9 ms) as the refresh frequency of the CRT display. Considering that it takes ap- proximately 85 ms to communicate from the eye movement measuring equipment and to identify saccades, and that it takes about 100 ms to restore by approximately 75% from saccadic suppression[32], we determined∆t1 and∆t2to be 14 ms and 98 ms, respectively, for this experiment. Con- sequently, a window was displayed from 100 ms to 198 ms after saccade occurrence. As the duration of gazing at the gazing point at the time of reading has been described as between 200∼500 ms, and was around 200 ms according to Ikeda and Saida, we displayed a window for 98 ms. We set it at 198 ms not 200 ms, to display it in sync with the re- fresh rate of the CRT. Because Ikeda and Saida displayed a window in sync with eye movement, the window moved along with the eye movement, and the display duration of a window was sometimes longer than the duration in our ex- periment if the duration of the gazing time was longer than 200 ms. Therefore, the experimental conditions of this ex- periment, in which we could control the display time for the window exactly, did not necessarily agree with the condi- tions of Ikeda and Saida’s experiment. However, we thought
Fig. 15 Mean reading time.
that it deserved to be referred to as an experiment involving Japanese sentences.
The threshold of the saccade used 42 [deg/s], which we found in the experiment mentioned above. The viewing distance was 60 cm. The horizontal visual angle and vertical visual angle of the presented sentence from a subject were 21.6 degrees and 6.0 degrees, respectively. The sentence that we displayed this time was 18 letters per line. The mean length of a saccade when reading a Japanese kana and kanji mixture sentence is said to be 3∼5 letters, which is equivalent to 3.6∼6.0 degrees as the movement length of the saccade and 6∼20 ms as a saccade duration in our experimental conditions. Therefore, the saccade finished by passing 100 ms, which is the necessary time required to detect a saccade. After the saccade started under the conditions of this experiment in which it was assumed that
∆t1=14 ms, the window was displayed during the gazing point. In addition, the horizontal size and vertical size per character were both 1.2 degrees. Furthermore, the CRT display was photographed with a high-speed camera and it was determined whether the control of the window display was carried out exactly between∆t1and∆t2. We confirmed that the presentation of the window was carried out precisely in the photographs taken with the high-speed camera. The subjects were five 21∼26-year-old students at our university who could smoothly read Japanese sentences. The average reading time of the 5 subjects is shown in Fig. 15. When the size of the window became bigger than 13 letters, the reading time did not change from this figure.
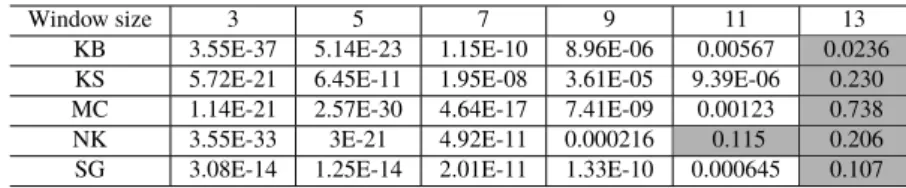
We conducted a t test with an effective level of 1%
on the average reading time of a window size of 15 letters and other window sizes. The result is shown in Table 3.
The gray cells in Table 3 show the condition under which no difference from the average reading time was seen for a window of 15 letters in size. It was shown that there was a difference in window sizes of 11 and 13 letters for subject NK and in a window size of 13 letters for the other subjects.
Table 3 The result of T test (the condition where no difference was seen for a window of 15 letters in size is a gray cell).
Window size 3 5 7 9 11 13
KB 3.55E-37 5.14E-23 1.15E-10 8.96E-06 0.00567 0.0236 KS 5.72E-21 6.45E-11 1.95E-08 3.61E-05 9.39E-06 0.230 MC 1.14E-21 2.57E-30 4.64E-17 7.41E-09 0.00123 0.738
NK 3.55E-33 3E-21 4.92E-11 0.000216 0.115 0.206
SG 3.08E-14 1.25E-14 2.01E-11 1.33E-10 0.000645 0.107
When the window size exceeded 13 letters in the Ikeda and Saida experiment, the reading time became the same as the reading time without the window. The window moved in conjunction with the eye movement in their experiment. As for our experiment, a window was displayed for only 98 ms at the gazing point. This suggests that 98 ms is sufficient for the visual information processing at the gazing point, since our result showed the same tendency. Although it could be argued that the display time of the window should be var- ied according to the gazing duration in order to compare our study with Ikeda and Saida’s results, saccades were not detected in their experiment at all, and we could not make the experimental conditions agree exactly with those of their experiment. We think that it is important to clarify the ac- quisition time of the visual information, the processing time of the visual information, the timing required to determine the next gazing point, the size of the window necessary for each processing, etc., by making use of the characteristics of the system that we developed, rather than by comparing our results with theirs directly.
8. Summary
The number of people using e-books displayed on an ex- clusive electronic book or tablet is increasing rapidly. We can display or remove information instantly with these elec- tronic terminals, unlike with a conventional paper book. We thought that we could suggest a method that would make it easy to understand what was appropriate for these elec- tronic terminals by studying the human visual information- processing mechanism at the gazing point.
However, the study of eye movement during reading was done widely all over the world in the 1970s after the de- velopment of the experimental technique in which a window moved along with eye movement and the displayed letters could be changed. In recent years, some studies were per- formed in which the information on the display was changed according to the subject’s eye movement[5],[6]. However, in these studies, the display time of the information was not controlled as accurately as in our experiment. One of the rea- sons for this lack of control of the display time was thought that the display type that was available changed from CRT to LCD. The production and sale of CRTs characterized by a short afterglow that is suitable for the display control that linked to eye movement has ended, and the LCDs of the hold-type displays that have replaced CRTs are not suitable for an experiment with a short time presentation.
Display studies linked to eye movement are indispens-
able for gathering the data that will be necessary to propose display methods appropriate for electronic terminals, which are good for changing displayed information in real-time.
We therefore conducted the kind of representative study that began this kind of research. As a result, it became clear that there were problems with the afterglow time for displays, the detection of saccades, and the accurate control of dis- play times because of the technological limitations at that time. This research made it clear, however, that to study the information processing mechanism at the gazing point, we needed to make use of electronic terminals that can correct the detection of saccades and correctly control the display time. We therefore decided to develop a new measuring system.
We first investigated displays and showed that the hold- type LCD display had a long afterglow time and was not suitable for our experiments, while the CRT with a short afterglow was indispensable.
Using a CRT, we then conducted experiments under conditions like those used by Ikeda and Saida using Japanese text and found that the size of the window for reading became the same as in the condition without the window, which was the same tendency shown in their results. The system we propose in this article can precisely control the display time for the window at the gazing point. We set a limit of the gazing point display time at 98 ms in our experiment and showed the same results as Ikeda and Saida found with a 98- ms display time. This result happened to be the same as the result of Ikeda and Saida, but their result did not accurately control the display time after detecting a gazing point while considering the afterglow of the CRT. Because they did not insert a masking image after the display, the influence of the afterimage and the iconic memory may continue. They did not measure the afterglow time of the display. We controlled the display time accurately by considering the afterglow time for the display, by detecting the gaze point, and by inserting a masking image after the display. We obtained almost the same result, namely that subjects could read with a window size of 13–15 characters as well as with no window, but the difference was that we controlled the display time accurately and showed that a display time of only 98 ms was sufficient for reading. The experiment that accurately controlled the display time of the window during gazing was not reported.
We think that important information was provided in clarify- ing the cognitive characteristics of the person at the time of reading. Our purpose is not to inspect all of the 1970 stud- ies on eye movement using the window method. We seek to propose a technique appropriate for the new electronic
terminals based on the products of the splendid results of past research on paper books. It is no longer possible to purchase CRTs with a short afterglow. Our study could end suddenly if a problem were to arise with the CRT we used here. A display using a CRT is indispensable for controlling the window displayed at the gazing point exactly and for clar- ifying the information-acquisition mechanism at the gazing point, the information-processing mechanism at the gazing point, the selection decision mechanism of the next gazing point, and the roles of the parafovea and peripheral vision around the gazing point. We hope to push forward quickly on a study addressing these items. For the study mentioned above, when we are not able to use a CRT, we will assess the LCD availability on the experiment.
Acknowledgments
We are grateful to all the laboratory members who cooper- ated with the subjects willingly.
References
[1] H. Takahira, R. Ishikawa, K. Kikuchi, T. Shinkawa, and M. Yamada,
“Analysis of gazing movement while reading E-Books,” IEICE Trans.
Fundamentals, vol.E97-A, no.2, pp.530–533, Feb. 2014.
[2] S. Saida, “Reading and eye movement,” Experimental Psychology of Eye Movement, R. Yosaka, Y. Nakatsuo, and K. Koga, eds., pp.167–
197, Nagoya University Press Conference, Nagoya, 1993.
[3] K. Rayner, “Eye movements in reading and information processing:
20 years of research,” Psychol. Bull., vol.123, no.3, pp.372–422, 1998.
[4] K. Rayner, L.C. Loschky, and E.M. Reingold, “Eye movements in visual cognition: The contributions of George W. McConkie,” Vis.
Cogn., vol.22, nos.3-4, pp.239–241, 2014.
[5] C.Y. Leung, M. Sugiura, D. Abe, and L. Yoshikawa, “The perceptual span in second language reading: An eye-tracking study using a gaze- contingent moving window paradigm,” Open Journal of Modern Linguistics, vol.4, no.5, pp.585–594, 2014.
[6] L.C. Loschky and G.A. McCnkie, “User performance with gaze contingent multiresolutional displays,” ETRA, pp.97–103, 2000.
[7] K.E. Javal, “Essai sur la physiologie de la lecture,” Annales d’Ocilistique, vol.80, pp.61–73, 1878.
[8] M. Yamada and T. Fukuda, “A new sight-line displacements analyser and its application to TV program production,” SMPTE Journal, vol.99, no.1, pp.16–26, 1990.
[9] E.B. Huey, “On the psychology and physiology of reading I,” The American Journal of Psychology, vol.11, no.3, pp.283–302, 1900.
[10] E.B. Huey, “On the psychology and physiology of reading II,” The American Journal of Psychology, vol.12, no.3, pp.292–312, 1901.
[11] E.B. Huey, The Psychology and Pedagogy of Reading, Macmillan, New York, 1908.
[12] T. Takemasa, ed., Psychology of Reading, Baifukan, Tokyo, 1939.
[13] J. Hochberg, “Components of literacy: Speculations and exploratory research,” Basic Studies on Reading, H. Levine and J.P. Williams, eds., pp.74–89, Basic Books, New York, 1970.
[14] S.G. Abrams and B.L. Zuber, “Some temporal characteristics of information processing during reading,” Read. Res. Quart., vol.8, no.1, pp.40–51, 1972.
[15] K. Rayner, “Eye guidance in reading: Fixation locations within words,” Perception, vol.8, no.1, pp.21–30, 1979.
[16] J.K. O’Regan, “Eye guidance in reading: Evidence for the linguistic control hypothesis,” Percept. Psychophys., vol.25, no.6, pp.501–509, 1979.
[17] S. Saida and M. Ikeda, “Text sentence reading with restricted view,”
Clinical Ophthalmology, vol.29, no.8, pp.923–925, 1975.
[18] A. Watanaba and T. Yoshida, “Roles of central and peripheral vision in pattern perception,” NHK Technical Monograph, no.21, 1973.
[19] G.W. McConkie and K. Rayner, “The span of the effective stimulus during a fixation in reading,” Percept. Psychophys., vol.17, no.6, pp.578–586, 1975.
[20] K. Rayner, “The perceptual span and peripheral cues in reading,”
Cogn. Psychol., vol.7, no.1, pp.65–81, 1975.
[21] K. Rayner, “Parafoveal identification during a fixation in reading,”
Acta Psychologica, vol.39, no.4, pp.271–282, 1975.
[22] K. Rayner, “Eye movements in reading,” Psychol. Bull., vol.85, pp.1–
50, 1978.
[23] N. Osaka, “Effect of peripheral visual field size upon eye move- ments during Japanese text processing,” in Eye Movements From physiology to Cognition, J.K. O’Regan and A. Levy-Schoen, eds., pp.421–429, North-Holland, Amsterdam, 1987.
[24] F.C. Volkmann, A.M. Shick, and L.A. Riggs, “Time course of visual inhibition during voluntary saccades,” J. Opt. Soc. Am., vol.58, no.4, pp.562–569, 1968.
[25] Y. Hoshino, “Short time presentation of images by Windows: Use of SharpDX and Direct3D9,” Ritsumeikan Literature, 641, pp.53–68, 2015.
[26] T. Kurihara, “Response time of display and movie display quality,”
VISION, vol.24, no.4, pp.154–163, 2012.
[27] M. Yamada and T. Fukuda, “Definition of gazing point in image and its application to image analysis,” Trans. Society of the Institute of Electronics, vol.J69-D, no.9, pp.1335–1342, 1986.
[28] R. Fukuda, M. Sakuma, E. Nakamura, and T. Fukuda, “An ex- perimental consideration on the definition of a fixation point,” Er- gonomics, vol.32, no.4, pp.197–204, 1996.
[29] M. Nakasu, N. Takagi, T. Kitagawa, Y. Aoki, H. Abe, T. Iwanabe, J.
Ookubo, J. Kawano, S. Sinoda, Y. Suzuki, N. Nagasaki, K. Horikiri, H. Matsumoto, Y. Miyazima, K. Anma, K. Miura, O. Hirata, S.
Adachi, J. Isaka, Y. Ushiro, M. Oosugi, K. Kishimoto, K. Shimizu, S. Takahashi, I. Natsui, A. Makido, S. Miura, K. Ogi, K. Ide, T.
Horita, T. Abe, S. Imamiya, S. Endou, I. Kawakami, Y. Kikkawa, M.
Shinnyo, N. Tanaka, T. Nishida, K. Matsumoto, and T. Miyakawa, eds., Elementary School Students’ Third Language, Sanseido, 2013.
[30] A.T. Bahill, A. Brockenbrogh, and B.T. Troost, “Variability and development of a normative data base for saccadic eye movement,”
Invest. Ophthalmol. Vis. Sci., vol.21, pp.116–125, 1981.
[31] R.W. Baloh, A.W. Sills, W.E. Kumley, and V. Honrubia, “Quanti- tative measurement of saccade amplitude, diration, and velocity,”
vol.25, no.11, pp.1065–1070, 1975.
[32] S. Shioiri and P. Cavanagh, “Saccadic suppression of low-level mo- tion,” Vision Res., vol.30, no.8, pp.915–928, 1989.
Tsuyoshi Kushima received the B.E from school of information and telecommunication engineeringof Tokai University 2018. He is currently a graduate student at Graduate School of Informatics and Engineering of University of Electro-Communications. He interested in eye movement of human and engaged in study on eye movements in reading.
Miyuki Suganuma received the M.E from Graduate school of information and telecommu- nication engineering of Tokai University in 2018.
She is currently working at Dai Nippon Printing Co., Ltd. She is interested in human interface and engaged in study on speech training and fa- tigue evaluation using lip movement.
Shinya Mochiduki received the M.E from Graduate school of information and telecom- munication engineering of Tokai University in 2017. He is currently a doctor student at Gradu- ate School of Science and Technology of Tokai University. He engaged in the study on visual science, especially, head and eye coordination and relation between accommodation and con- vergence eye movement.
Mitsuho Yamada received the Master de- gree in 1980 and the Doctor degree in 1989, both from Nagoya University. From 2003, he has been in Tokai University, where he is cur- rently Professor. His research is concerned with psychology on vision and image media quality evaluation using eye movements.