分子動力学シミュレーションによる荷電コロイド分 散系における秩序構造の安定性‑2
著者 片岡 洋右
出版者 法政大学情報メディア教育研究センター
雑誌名 法政大学情報メディア教育研究センター研究報告
巻 34
ページ 16‑21
発行年 2019‑07‑18
URL http://doi.org/10.15002/00022798
分子動力学シミュレーションによる荷電コロイド分散系における 秩序構造の安定性 -2
Stability of FCC Structure in the Charged Colloidal Dispersion by Molecular Dynamics Simulations -2
片岡 洋右1)2)
Yosuke Kataoka
1)法政大学情報メディア教育研究センター
2)法政大学生命科学部環境応用化学科
The stability of the FCC structure was compared with that of the liquid structure in the charged colloidal dispersion by molecular dynamics simulations. The effective potential of Sogami-Ise theory was assumed. In the case of the low volume fraction (1%), the FCC structure was more stable than the liquid structure for a typical charge distribution at room temperature. The melting point was estimated as about 676 K.
Keywords : Charged colloidal dispersion, Stability of FCC, Molecular dynamics simulations, Sogami-Ise theory
1. はじめに
荷電コロイド分散系は条件により秩序構造をとる
[1-6]。この現象はしばしばDLVO理論[7, 8]や曾
我見-伊勢理論[9-12]によって議論される。B.V.R.
Tataとその共著者はモンテカルロシミュレーション により組織的に研究している[13-16]。この系の分 子動力学シミュレーションは著者[17]によってな されている。
昨年度の体積分率3 %についての報告[18]に引 き続き本研究では体積分率1 %における秩序構造 の安定性を曾我見-伊勢理論を仮定し、代表的な表 面電荷密度の条件の下でFCC構造とランダムと液 体構造と安定性を比較する。
曾我見-伊勢理論は曾我見によって昨年熱力学と 完全に矛盾のない形に再構築されている[19]。これ により有効相互作用関数は若干の変更を受けるが、
ここで問題にするような低濃度の領域では、その違 いはわずかであるため[20]、曾我見-伊勢理論によ る旧来の表式を採用する。
2. 相互作用関数
本論文では、球形の粒子間に曾我見-伊勢理論を 仮定する。この理論では粒子間の有効ポテンシャル
関数 UG(R) は粒子間距離 R の関数として次の式のよ
うになる。
ここでは以下の記号を使用している、Debye遮蔽 定数 k, 温度 T, 体積 V, 単位電荷e, 真空の誘電率ε0, Boltzmann定数 kB, コロイド粒子の半径 a, コロイド 粒子の電荷数 Z, j 番目の小粒子の電荷数 zj, j 番目 の小粒子の個数 nj である。
曾我身-伊勢理論の有効ポテンシャルエネルギー
( )
*2 2
1 coth 1
( ) 2
G
Z e a a
RU R e
R
κ κ
κε κ +
−
= −
(1)*
sinh ( ) a Z Z
a κ
= κ
(2)2 2 2
j j B j
e z N
κ k TV
≡ ε ∑ (3)
法政大学情報メディア教育研究センター研究報告 Vol.34
は R の関数として最小値を持つ。これから粒子間 距離が小さければ斥力、中間的な領域では引力的な 相互作用を持つ。一例を図1に示した。ここで使用 したパラメータの値を表1に示す。図1における温度 T は 298 Kである。本論文では相互作用関数は温度 に依存しないと仮定する。仮定した相互作用の元で の固体構造の融解温度を求めるためである。
これに対しDLVO理論の有効ポテンシャルエネル
ギーUF(R)は次に示すように R の単調減少関数であ
るため、力としては斥力となる。
図1のように今回の体積分率1%で表面電荷がσ = μC/cm2の場合は、T = 298 KにおけるkBTと比べて 1.36倍の深さのポテンシャルエネルギーの深さとな るため、FCCの秩序構造は壊れやすい。
3. 分子動力学シミュレーション
コロイド粒子の秩序構造としてFCC格子を仮定 する。この構造とランダムな構造との熱力学的安定 性の比較を行うために、図2のような初期分子配置 を使用し、温度を指定した分子動力学シミュレー ション行った。図2では液体構造(L)をFCC格子(S)
で挟んだ構造になっている。アルゴンの場合は図2 のようなSLS構造から出発して温度を指定した分 子動力学シミュレーション行って、合理的な融解曲 線を得ている[21]。
分子動力学シミュレーションの条件は表2にまと めた。基本セルに含まれる粒子数 N = 3×864であ る。モル質量の値は単に使用する分子動力学法のソ
-10
-5 0 5 10
0 3000 6000 9000 1.2 10
41.5 10
4s=0.1e-6C/cm2 s=0.2e-6C/cm2 s=0.4e-6C/cm2
U
G(R )/ k
BT
R/A
図 1 有効ポテンシャル関数 Figure 1 Effective potential function
表 1 パラメータの値 Tab 1 Parameters values quantity synbol numerical
value unit
charge number of
colloidal particle Z 662.76 charge surface
density σ 0.2 µC/cm2
radius of colloidal
particle a 6.50E-08 m
volume fraction of
colloidal particle φ 0.01
*2 2
1 ( )
F
Z e
RU R e
R
κ
ε
−=
(4)図 2 初期原子配置, T = 300 K Figure 2 Initial configuration, T = 300 K
quantities notation value number of
molecules in basic cell
N 2592
total number of
MD steps 10000000
time increment dt/s 2.50E-14 molar mass M/(g/mol) 2.22E+02
ensemble NVT
initial
configuration Fig.2
boundary
condition periodic
cut off distance half of short cell length
software SCIGRESS-
ME[22]
表 2 MDシミュレーションの条件 Tab 2 MD conditions
フトウエアが通常の分子に対するものであるため、
便宜的に表に示した値を仮定した。分子動力学シ ミュレーションから得られた熱力学量はこの質量に は依存しない。
MDステップ数が大きく、比較的長いシミュレー ションを実行したのは、図2のような、2種類の構 造の安定性を判定するために、どのような構造に収 束するかを見極めるためである。
収束を確かめるためは次の節で述べるように、ポ テンシャルエネルギー Ep の値の収束性をまず見 た。同時にシミュレーションの経過に伴い、分子配 置がどのように変化しているかを分子配置の図によ り観察した。基本セルの全体がFCC構造あるいは ランダムな液体構造になると、その後構造は変わら ない。FCC構造とランダムな構造が共存している ばあいは、その後の構造変化を注意深く見守る必要 がある。
4. 結果
図3にポテンシャルエネルギー Ep の緩和の例 を示した。T = 300 K ではEpは安定な構造に落ち 着いていると見られる。一方T = 700 Kでは Ep の 高い構造が最終配置と見られる。これらに対して、
T = 672 Kではこれらの Ep の中間の状態が持続して
いる。
系の圧力の緩和過程を図4に示した。この圧力は 有効ポテンシャル関数を使用しているので、現実系 の浸透圧に対応する[23]。
また、これら3状態の2体相関関数を図5示した。
以上の3状態の最終配置を図6 ~図8に示した。
図6はg(r) と合わせて見ることによりFCC構造で あり秩序構造であると結論付けられる。図8はラ ンダムな構造でありg(r)も同じ構造を示している。
図7は一部にFCC構造が残っているが大部分はラ ンダムな構造であることが分かる。図5のg(r)も 同じ結論を支持する。また図3の Ep の緩和の様子 も以上の見方を支持する。
図9 に<Ep>の温度変化を示した。この図から 660 K以下ではFCC構造が安定である。T = 662 K からT = 674 KではFCCとランダム構造の2相の共 存構造となった。T = 676 K以上ではランダム構造 が安定である。図10には対応する圧力を温度の関 数としてプロットした。図10における変化は<Ep>
の変化に対応している。この圧力は現実系での浸透 圧に相当する[23]。このため非常に低い圧力となっ ている。
図9の結果はこのコロイド分散系は室温では、
FCCの秩序構造が安定であることを示している。
-4 10-17 -3 10-17 -2 10-17 -1 10-17 0 1 10
0 1 105 2 105 3 105 4 105 700K672K 300K
Ep/J
t/ps
図 3 ポテンシャルエネルギーEpの緩和の例 T = 300 K, 672 K, 700 K
Figure 3 Examples of potential energy Ep, T =300 K, 672 K, 700 K
図 4 圧力の緩和、T = 300 K, 672K, 700 K Figure 4 Relaxation of pressure, T = 300 K, 672 K, 700 K
0 1 2 3 4 5
0 5000 1 10
41.5 10
42 10
42.5 10
4g(r), T=700K g(r), T=672K g(r), T=300K
g(r )
r/A
図 5 2体相関関数 g(r), T = 300 K, 672 K, 700 K Figure 5 Pair correlation function g(r),
T = 300 K, 672 K, 700 K
法政大学情報メディア教育研究センター研究報告 Vol.34 図 6 最終配置, T = 300 K
Figure 6 Final configuration, T = 300 K
図 7 最終配置, T = 672 K Figure 7 Final configuration, T = 672 K
図 8 最終配置, T = 700 K Figure 8 Final configuration, T = 700 K
図 9 <Ep>の温度変化 Figure 9 <Ep> vs. T plot
図 10 圧力の温度変化 Figure 10 p vs. T plot
5. 体積分率 3% との比較
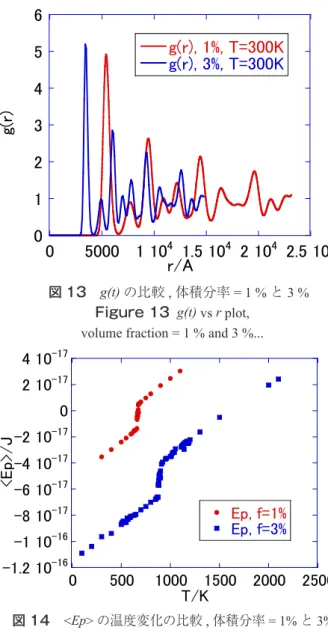
最後に前回報告した体積分率3 %の場合との比 較を行う。有効ポテンシャル関数の比較を図11に 示した。Epの緩和を図12に示した。2体相関関数 g(r)の比較は図13に示した。体積分率が3%では 1 %の場合と比較して有効ポテンシャル関数の最 小値の距離が短くなることが図11から分かる。
図12から3 %の場合は早く緩和し、Epの値は1%
の時と比べ代数的に低い値となることが分かる。図 13のg(r)の比較から3%の時は1%の時と比べ密度 の高い構造となることが確かめられた。表3におい て有効ポテンシャルの最少となる距離とg(R)の第1 ピークの距離を比較した。これらの距離の比を3(1/3)
=1.4と比較した。傾向はこの比で理解できる。
ポテンシャルエネルギーの平均値<Ep>を温度に
対しプロットし、体積分率~1%と3%の場合を比 較し、図14に示した。図11において示された有効 ポテンシャルの深さの違いに対応している。どちら の体積分率でもFCC秩序構造が室温で安定である ことが分かる。
-2 -1.5 -1 -0.5 0 0.5 1 1.5 2
0 5000 1 10
41.5 10
40.01 0.03
U
G(R)/( k
BT )
R/A
図 11 有効ポテンシャル関数の比較, 1% と3%
Figure 11 Effective potential function, volume fraction = 1% and 3%
-1 10
-16-8 10
-17-6 10
-17-4 10
-17-2 10
-170
0 5 10
41 10
51.5 10
52 10
52.5 10
53 10
51%
3%
Ep /J
t/ps
図 12 Epの緩和の比較, 体積分率 = 1% と3%
Figure 12 Ep vs.t plot, volume fraction = 1% and 3%
0 1 2 3 4 5 6
0 5000 1 10
41.5 10
42 10
42.5 10
4g(r), 1%, T=300K
g(r), 3%, T=300K
g(r )
r/A
図 13 g(t)の比較, 体積分率 = 1 %と3 % Figure 13 g(t) vs r plot,
volume fraction = 1 % and 3 %...
-1.2 10
-16-1 10
-16-8 10
-17-6 10
-17-4 10
-17-2 10
-170 2 10
-174 10
-170 500 1000 1500 2000 2500 Ep, f=1%
Ep, f=3%
<E p>/ J
T/K
図 14 <Ep>の温度変化の比較, 体積分率 = 1%と3%
Figure 14 <Ep> vs T plot, volume fraction = 1% and 3%...
volume %
R, UG(R) min/A
ratio of columnleft
r, max/Ag(r)
ratio of columnleft
1 6.90E+03 1.7 5.40E+03 1.6 3 4.20E+03 1.0 3.40E+04 1.0
表 3 UG(R)が最少となる距離と g(r)の第1ピークのr
Figure 3 Minimum position of UG(R) and r of first maximum of g(r)
法政大学情報メディア教育研究センター研究報告 Vol.34
6. まとめ
体積分率1%のコロイド分散系に曾我見-伊勢理 論による有効ポテンシャル関数を仮定して、FCC 構造とランダム構造を張り合わせた初期構造につい て分子動力学シミュレーションを行った。その結果、
室温ではFCCの秩序構造が安定であることが確か められた。
参考文献
[1] S. Hachisu, Y. Kobayashi, and A. Kose, “Phase Separation in Monodisperse Latexes”, J. Colloid Interface Sci., Vol.42, No.342, 1973.
[2] A. K. Arora and B. V. R. Tata, Ordering and Phase Transitions in Charged Colloids, VCH, New York, 1996.
[3] Y. Monovoukas and A. P. Gast, “The experimental phase diagram of charged colloidal suspensions”, J.
Colloid Interface Sci., Vol.128, No.553, 1989.
[4] T. Palberg, W. Mönch, F. Bitzer, R. Piazza, and T. Bellini, “Freezing Transition for Colloids with Adjustable Charge: A Test of Charge Renormalization”, Phys. Rev. Lett., Vol.74, No.4555, 1995.
[5] J. Yamanaka, T. Koga, N. Ise, and T. Hashimoto,
“Control of crystallization of ionic silica particles in aqueous dispersions by sodium hydroxide”, Phys. Rev., E 53, R4317, 1996.
[6] J. Yamanaka, H. Yoshida, T. Koga, N. Ise, and T.
Hashimoto, “Reentrant Solid-Liquid Transition in Ionic Colloidal Dispersions by Varying Particle Charge Density”, Phys. Rev. Lett., Vol.80, No.5806, 1998.
[7] V. Derjaguin and L. Landau, “Theory of the stability of strongly charged lyophobic sols and of the adhesion of strongly charged particles in solution of electrolytes”, Acta Physicochim. USSR, Vol.14, No.633, 1941.
[8] E. J. W. Verwey and Th. G. Overbeek, Theory of the Stability of Lyophobic Colloids, Elsevier, 1948.
[9] I. Sogami, “Effective potential between charged spherical particles in dilute suspension”, Phys. Lett., 96A 199, 1983.
[10] I. Sogami and N. Ise, “On the electrostatic interaction in macroionic solutions”, J. Chem. Phys., Vol.81, No.6320, 1984.
[11] N. Ise and I. S. Sogami, Structure Formation in Solution, Springer, 2005.
[12] 伊勢典夫, 曽我見郁夫, “ 高分子物理学 : 巨大イオ
ン系の構造形成 ”,朝倉書店, 2004年.
[13] B. V. R. Tata and N. Ise, “Homogeneous to inhomogeneous transition in charged colloid”,Phys.
Rev. B, Vol.54, No.6050, 1996.
[14] B. V. R. Tata, E. Yamahara, P. V. Rajamani, and N .
Ise, “Amorphous Clustering in Highly Charged Dilute Poly(chlorostyrene-styrene sulfonate) Colloids”, Phys.
Rev. Lett., Vol.78, No.2660, 1997.
[15] B. V. R. Tata and N. Ise, “Monte Carlo study of structural ordering in charged colloids using a long- range attractive interaction”, Phys. Rev. E, Vol.58, No.2237, 1998.
[16] N. Ise, T. Konishi and B.V. R. Tata, “How Homogeneous Are “Homogeneous Dispersions”
Counterion-Mediated Attraction between Like-Charged Species”, Langmuir, Vol.15, No.4176, 1999.
[17] Y. Kataoka, “Molecular Dynamics Simulations of Charge-Stabilized Colloidal Dispersions”, Int. J.
Microgravity Sci., Appl, Nol.33, 330308, 2016.
[18] 片岡洋右, “ 分子動力学シミュレーションによる荷
電コロイド分散系における秩序構造の安定性 ”, 法 政大学情報メディア教育研究センター研究報告,
Vol.33, No.11, 2018.
[19] Ikuo S, Sogami, “On adiabatic pair potentials of highly charged colloid particles”,Prog. Theor. Exp. Phys., 033J01, 2018.
[20] K. Koizumi, T. Shinohara, M. V. Smalley, B. V. R.
Tata and I. S. Sogami, “Gibbs Pair Potential of Highly- charged Particles in Colloid Dispersions”,Int. J.
Microgravity Sci. Appl, Vol.35, 23456, 2014.
[21] 片岡洋右, “ 温度一定の分子動力学法によるアル
ゴンの融解曲線 ”,法政大学計算科学研究センター 研究報告, Vol.32, No.7, 2018.
[22] SCIGRESS-ME
http://www.fujitsu.com/jp/solutions/business- technology/tc/sol/scigress/
(最終閲覧:2019年2月)
[23] I. S. Sogami, M. V. Smalley and T. Shinoharai, “Free Energies of Macroionic Suspensions and the Equation of State for Osmotic Pressure”,Prog. Theor. Phys., Vol.113, No.235, 2005.