B104
Numerical modelling of Turbidity Currents in the Shihmen Reservoir, Taiwan: TELEMAC2D and
-3D validated by physical model measurements
〇Peng An CHEN, Sameh A. KANTOUSH, Tetsuya SUMI
INTRODUCTION
Dams interrupt the continuity of sediment transportation and cause sediment deposition in the reservoir. Reservoir sedimentation leads to storage capacity decreasing, outlets clogging, damages of power plant turbines and sediment starvation downstream. Based on the aforementioned adverse and costly consequences, desiltation is essential to maintain the useful life of reservoirs. Among the various desiltation strategies, turbidity current venting is an efficient method to reduce suspended sediment deposition (Chamoun et al. 2016). Most of turbidity current simulations have been conducted by two-dimensional model, due to restrictions of three-dimensional model.
The objective of this study is to simulate the laboratory experiments of turbidity current venting through various outlets by three-dimensional numerical model. Additionally, to evaluate the ability of TELEMAC-2D and TELMAC-3D models to reproduce the turbidity current plunging in reservoir. Several studies exist for simulating the turbidity current in the reservoir by applying the various numerical models, such as SRH-2D (Huang et al. 2019), FLOW-3D (Abd El-Gawad et al. 2012), ANASYS CFX (Chamoun et al. 2012) and TELEMCA-3D (Pérez-Díaz et al. 2018). Compare to the ANASYS CFX (commercial software), TELEMCA-3D (open-source numerical model) is easily modified and allows to add a suitable equation for each case (Jodeau et al. 2018). To investigate the plunging phenomenon and combined operation between venting structures from the dam site
and sediment bypass tunnel (SBT)., the two- and three- dimensional TELEMAC models (TELEMAC–2D and –3D), coupled with Gaia is adopted in this study.
MATERIAL AND METHODS
The distorted physical model, with a scale of 1/100 in horizontal and vertical, was built for investigated the suitable locations and venting efficiency. The configuration of the study area and details are shown in Fig. 1. The observations from Typhoon Aere, which causes severe accumulated sediment in the Shihmen reservoir, are regarded as the boundary conditions in the physical model. To investigate the venting efficiency, the scenario from combined operations with outlets from dam site, sediment bypass tunnel outlets are list in Fig. 1. Because the turbidity current cannot smoothly vent through the Dawanping SBT, the elephant trunk steel pipe is installed at the middle and bottom of channel (Sc#4 and Sc#5). In this study, measurements from Sc#1 is adopted to calibrate and validate the developed TELEMAC–2D and –3D.
The calibration and validation consisted of the sensitivity analysis of numerical characteristics that influences the simulations. The critical characteristics are list in Table 1 and the most appropriate parameters are recommended in this paper.
RESULTS AND DISCUSSION
Based on the sensitivity analysis, the appropriate parameters are obtained (Table 1). With the optimal parameters, the process of turbidity current simulations from TELEMAC-2D and -3D are shown in Fig. 2. The 3D simulations significantly show that the stratification occurs and the turbidity current is transported in the
Fig. 1 The configuration of study area and details of outlet Table 1 Numerical characteristics and appropriate values
Fig. 2 The simulations from (a) TELEMAC-3D and (b) -2D riverbed. Meanwhile, the vertical velocity profile from cross-sections 24 and 26 reveals that the negative velocity appears near to the surface. It illustrates that the turbidity current plunge and movement lead to the eddy flow. In contrast, 2D results are difficult to distinguish the turbidity current and express the flow pattern and sediment concentration (Fig. 2).
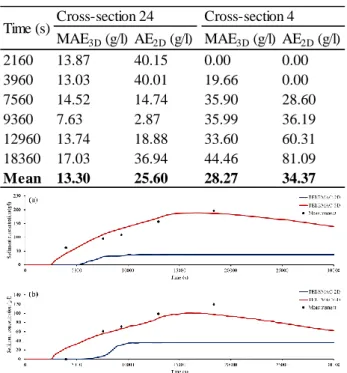
To objectively investigate the performance, the mean absolute error (MAE3D) and absolute error (AE2D) is adopted. The AE2D is calculated by depth average measurements and 2D simulations. Due to the TELEMAC-3D can yield the vertical profile results, the MAE3D is calculated by the measurements and 3D simulations from different elevations. As Table 2 shown, the performance of 3D simulations is better. Meanwhile, as Fig. 3 shown, the simulations of outflow sediment concentration from TELEMAC-3D have a
Table 2 Performance evaluation of cross-sectional simulation
Fig. 3 The comparison of outflow sediment concentration from
(a) PPI and (b) SCI between TELEMAC-2D and -3D
better agreement in both PPI and SCI. It significantly indicates that the TELEMAC-2D is hard to evaluate the outflow sediment concentration of outlets from different elevations. Based on the aforementioned results, the TELEMAC-3D is suitable to investigate the optimal venting operation and turbidity current transportation in the reservoir.
REFERENCES
Chamoun, S., De Cesare, G., Schleiss, A.J.: Experimental
investigation on turbidity current venting under restrained outflow discharges. River Flow Proceedings,
Saint Louis, USA, 2016.
Huang, C.C., Lai, Y.G., Lai, J.S., Tan, Y.C.: Field and Numerical Modeling Study of Turbidity Current in Shimen Reservoir during Typhoon Events. J. Hydraul.
Eng., Vol. 145, No. 5, pp. 05019003, 2019.
Abd El-Gawad, S.M., Pirmez, C., Cantelli, A., Minisini, D., Sylvester, Z., Imran, J.: 3-D numerical simulation of turbidity currents in submarine canyons off the Niger Delta. Marine Geology, Vol. 326-328, pp. 55–66, 2012. Chamoun, S., De Cesare, G., Schleiss, A.J.: Influence of
Operational Timing on the Efficiency of Venting Turbidity Currents. J. Hydraul. Res., Vol. 144, No. 9, pp. 04018062, 2018.
Pérez-Díaz, B., Castanedo, S., Palomar, P., Henno, F., Wood, M.: Modeling Nonconfined Density Currents Using 3D Hydrodynamic Models. J. Hydraul. Eng., Vol. 145, No. 3, pp. 04018088, 2019.
Jodeau, M., Chamoun, S., Feng, J., De Cesare, G., Schleiss, A.J.: Numerical Modeling of turbidity currents with Ansys CFX and Telemac 3D. E3S Web of Conferences, Vol. 40, pp. 03014, 2018.
Numerical aspect Options Appropriate values Horizontal turbulence formula K-Omega, Smagorinski, κ-ε κ-ε
Vertical turbulence formula Mixing-length, κ-ε κ-ε Time step 0.05 to 1 1 Bed roughness fromula Chezy, Manning, Nikuradse Nikuradse Strickler coefficient 20 to 80 77 Critical shear stress 0.00001 to 0.1 0.00001 Settling velocity 0.00005 to 0.0004, Rubey Rubey
MAE3D (g/l) AE2D (g/l) MAE3D (g/l) AE2D (g/l)
2160 13.87 40.15 0.00 0.00 3960 13.03 40.01 19.66 0.00 7560 14.52 14.74 35.90 28.60 9360 7.63 2.87 35.99 36.19 12960 13.74 18.88 33.60 60.31 18360 17.03 36.94 44.46 81.09 Mean 13.30 25.60 28.27 34.37 Cross-section 24 Cross-section 4 Time (s)