Study on Urban Tourism Carrying Capacity(和訳
:都市観光キャリング・キャパシティに関する研究
)
著者
張 博
学位授与大学
東洋大学
取得学位
博士
学位の分野
国際観光学
報告番号
32663甲第354号
学位授与年月日
2013-09-25
URL
http://id.nii.ac.jp/1060/00006699/
Creative Commons : 表示 - 非営利 - 改変禁止 http://creativecommons.org/licenses/by-nc-nd/3.0/deed.jaDoctor’s Thesis
Study on Urban Tourism Carrying Capacity
Zhang Bo
Doctor Course
International Tourism Studies
Graduate School of Regional Development
Toyo University, Japan
1
ACKNOWLEDGMENT
The past three years in Toyo University have been the most challenging and rewarding time of my life. I will fondly remember many things from this exciting period and never forget those who have helped me accomplish this lifelong goal.
First of all, I would like to express my great gratitude to my advisor, Prof. Fujii Toshinobu and Prof. Liang Chunxiang as well as other teachers and scholars of the Graduate School of Regional Development Studies & International Tourism Studies of Toyo University. Thank you for your continuous support and help, from initial advice on the topic of UTCC and contacts in the early stages of conceptual inception and through ongoing advice and encouragement to this day. Without their patience and support, I would not be at this point in my doctoral career. And their influence will continue to guide me in my future research careers.
A special thank of mine goes to the classmates, friends, especially the brothers and sisters of the same master with me. They have helped me a lot in completing the project within the limited time. They also helped me in doing a lot of Research and I came to know about so many new things about this area.
I would also like to thank my family members. I look forward to focusing my efforts and spending more quality time with them. They inspire me to be a better person, husband and educator. Thank you for your patience and love during this time.
Last but not the least, I will treasure and will continue to be grateful to people who appreciated me for my work and motivated me throughout my project. I am making this project not only for marks but to also increase my knowledge.
THANKS AGAIN TO ALL WHO HELPED ME!
2 ABSTRACT
It was more than 70 years since the end of the World War II. During this period, though there is still war exist in some area, "peace" and "development" have been two major themes in human society overall. The society is no longer experience the global hit such as the War II. Under this background, the tourism industry has experienced a rapid development for a long time.
However, boom in tourism brings economic benefits as well as the problems for the region. Millions of tourists have caused tremendous pressure to the urban in terms of the physical (transportation, water & electronic resource, etc.) and nonphysical (society, culture, belief of the residents, etc.) elements.
According to this situation, the article does a preliminary research on the carrying capacity of the urban tourism, which aims to evaluate the capacity from both tangible and intangible views by different models. Tangible elements (named as physical elements in this study) in the urban system mainly refer to the elements that can be evaluated by quantitative methods. And the data can be collected by statistic data published by government with a high credibility. While intangible ones (named as nonphysical elements) refer to the elements which is difficult to be evaluated directly. And the required data are always collected by investigation.
For the evaluation of the physical elements, research method combining FAHP (fuzzy analytic hierarchy process) with MOM (multi objective optimization method) to establish the study model in this dissertation. Application research takes Tokyo and Osaka as examples to do applicative study. Results of daily tourism carrying capacity of two cities are 150,000 peolple/day and 60,000 people/day in Tokyo and Osaka respectively. Further analysis on fitting equation of the two cities is done with three parameters, and makes the data prediction for the future period of Jul. 2012–Dec.2013. For the nonphysical elements, SRS (Stratified Random Sampling) is combined with FAHP method to do the evaluation. The application study takes Bunkyo District (Tokyo) as an example. Result of the social-psychological carrying capacity of the residents shows a positive attitude to the tourist with a value of (0.41, 0.56, 0.69) overall.
This study tries to combine the two evaluation methods together by modifying the physical result with nonphysical result and takes Bunkyo District as an example. The modified result of the UTCC shows a growth tendency with the increasing of the tourist number, which is consistent to the welcome attitude of the resident to the tourist.
Further studies such as the appropriate range, mutual influences of different elements and their impact, non-physical elements’ content and its research methods, etc. have been discussed at the end of the thesis.
Keywords
UTCC (Urban Tourism Carrying Capacity); FAHP (Fuzzy Analytic Hierarchy Process); MOM (Multi-objective Optimization Method); SRS (Stratified Random Sampling); Application Study.
3 CONTENTS
ACKNOWLEDGMENT ... 1
ABSTRACT ... 2
CHAPTER 1 INTRODUCTION OF THE STUDY ... 4
1.1INTRODUCTION ... 4
1.2BACKGROUND OF THE STUDY ... 8
1.3PURPOSE OF THE STUDY ... 12
1.4METHODS OF STUDY ... 14
1.5ORIGINALITY ... 15
1.6CONSTRUCTION OF THE DISSERTATION ... 15
CHAPTER 2 REVIEW OF LITERATURE ... 17
2.1ORIGINATION AND DEVELOPMENT OF UTCCTHEORY ... 17
2.2SUMMARY ... 30
CHAPTER 3 CONCEPT DEFINITION AND THEORY ESTABLISHMENT OF URBAN TOURISM CARRYING CAPACITY (UTCC) ... 33
3.1CONCEPT DEFINITION OF UTCC ... 33
3.2THEORY ESTABLISHMENT OF UTCC ... 34
3.3INDEX SYSTEM ... 35
CHAPTER 4 MODELING OF UTCC ... 36
4.1INTRODUCTION OF METHODOLOGY ... 36
4.2MATHEMATICAL ANALYSIS ... 37
4.3FUNCTION AND EVALUATION OF THE MODEL ... 43
CHAPTER 5 APPLICATION STUDY OF THE MODEL (TOKYO AND OSAKA FOR EXAMPLES) ... 56
5.1EVALUATING ELEMENTS AND CORRESPONDING INDEX SYSTEM ... 56
5.2APPLICATION STUDY OF THE PHYSICAL LEVEL (TOKYO AND OSAKA FOR EXAMPLES) ... 57
5.3APPLICATION STUDY OF THE NON-PHYSICAL LEVEL (BUNKYO DISTRICT,TOKYO FOR EXAMPLE) .. 66
5.4REFLECTION ON INTEGRATION OF RESULTS OF QUANTITATIVE RESEARCH AND QUALITATIVE RESEARCH... 73
CHAPTER 6 SUMMARY, FINDINGS, CONCLUSIONS, IMPLICATIONS, AND RECOMMENDATIONS ... 77
6.1SUMMARY ... 77
6.2FINDINGS &CONCLUSIONS ... 77
6.3RECOMMENDATIONS ... 83
LIST OF TABLES ... 84
LIST OF FIGURES ... 85
BIBLIOGRAPHY... 87
APPENDICES ... 96
APPENDIX A:INTRODUCTION OF THE COMPONENT STUDY SURVEY ... 96
4
Chapter 1
Introduction of the Study
1.1 Introduction
(1) Acceleration of World Urbanization and Increase of World Tourist Arrivals under the Background of Peace and Development
Within over half a century after the World War II, the human society kept stable developing and did not experience global-scale social civilization destruction as in World War II.
Although the countries, in different historical periods, experienced more or less local obstacles of social civilization progress caused by social development and contradictions, the two major themes, "peace" and "development", have been much popularized for the development of human society worldwide.
Under this background, the industrial development has accelerated the urbanization worldwide, and the development of economy and informationization have promoted the process of globalization (Figure 1-1.).
Source: World Urbanization Prospects: the 2011 Revision, United Nations, New York
In human socialization and the process of globalization, leisure and recreation are gradually heavily demanded in peaceful times, and this demand changes with the passing by of times and constant expansion of human activities, thus the global tourism industry experiences rapid development.
According to UNWTO data, by the end of 2010, the world tourist arrivals had grown from 25,280,000 in 1950 to 940,000,000 (Figure 1-2.), meaning an increase of about 37 times, and the international tourism revenues had grown from $2,100,000,000 to $919,000,000,000 (Figure 1-3.), meaning an increase of about 437 times.
1950 1970 2011 2030 2050 World Population 2530000000 3700000000 6970000000 8320000000 9310000000 Urban Population 750000000 1350000000 3630000000 4980000000 6250000000 Rural Population 1790000000 2340000000 3340000000 3340000000 3050000000 0 1 2 3 4 5 6 7 8 9 10 b il li o n
5
Source: World Tourism Organization (UNTWO)
Source: World Tourism Organization (UNTWO)
(2) Trend of Tourist Arrivals’ Flowing into Urban
"Urban", as rallying site of local human society civilization, has become popular tourism destination.
According to data from UNWTO, tourist number of 100 most popular cities in 2010 reached 358,209,000 (Table 1-1.), accounting for 38.12% of the total population of world tourism (940 million). These figures can show that tourists worldwide tend to going to cities in general.
Table 1-1. Top-100 City Destinations Ranking, 2010
Rank City Arrivals
(thousand) Rank City (thousand) Arrivals Rank City (thousand) Arrivals 1
Hong Kong 19,973 35 Francisco San 2,929 69 São Paulo 1,825
2 Singapore 18,297 36 Edirne 2,912 70 Agra 1,813
3 London 14,706 37 Toronto 2,879 71 Jaipur 1,777
4 Macau 13,098 38 Berlin 2,872 72 Johannesburg 1,771 5 Bangkok 10,984 39 Seoul 2,809 73 Chiang Mai 1,769 6 Antalya 10,641 40 Chennai 2,785 74 Shenzhen 1,749
7 Kuala
Lumpur 10,351 41 Guangzhou 2,687 75 Christchurch 1,744 8 New York
City 8,961 42 Sydney 2,610 76 Hangzhou 1,744
1950 1960 1970 1980 1990 2000 2010
World Tourist Arrivals 25300000 72100000 158700000 285000000 415000000 698000000 940000000 0 2 4 6 8 10 x 1 0 0 0 0 0 0 0 0 1950 1960 1970 1980 1990 2000 2010 International Tourism
Profits 2.1E+09 6.8E+09 1.79E+1 9.25E+1 2.65E+1 4.76E+1 9.19E+1 0 200 400 600 800 1000 b il li o n
Figure 1-2. World Tourist Arrivals, Selected Period, 1950-2010
6
9 Paris 8,176 43 Budapest 2,606 77 Athens 1,733
10 Istanbul 8,124 44 Denpasar 2,600 78 Venice 1,695 11 Dubai 7,752 45 Sharm el
Sheikh 2,558 79 Florence 1,690
12 Mecca 6,122 46 Buenos
Aires 2,509 80 Honolulu 1,666
13 Miami 6,003 47 St
Petersburg 2,500 81 Abu Dhabi 1,624
14 Rome 5,620 48 Warsaw 2,450 82 Halong 1,581
15 Shanghai 5,397 49 Damascus 2,436 83 Washington
DC 1,569
16 Barcelona 5,160 50 Ho Chi
Minh 2,435 84 Burgas 1,535
17 Las Vegas 5,130 51 Cancún 2,434 85 Riyadh 1,512
18 Cairo 4,998 52 Delhi 2,350 86 Varna 1,501
19 Beijing 4,901 53 Brussels 2,235 87 Cape Town 1,486
20 Los
Angeles 4,550 54 Mumbai 2,195 88 Melbourne 1,466 21 Pattaya 4,430 55 Bucharest 2,136 89 Hurghada 1,459 22 Amsterdam 4,021 56 Aleppo 2,116 90 Edinburgh 1,404
23 Tokyo 3,817 57 Munich 2,053 91 Minsk 1,398
24 Prague 3,758 58 Marrakech 2,028 92 Suzhou 1,379 25 Moscow 3,740 59 Mexico
City 2,028 93 Zurich 1,378
26 Phuket 3,612 60 Jakarta 2,000 94 Sharjah 1,335 27 Dublin 3,587 61 Vancouver 1,951 95 Kolkatta 1,313 28 Punta Cana 3,521 62 Auckland 1,950 96 Algiers 1,312 29 Vienna 3,520 63 Rio de
Janeiro 1,929 97 Chicago 1,300
30 Madrid 3,402 64 Lima 1,925 98 Krabi 1,291
31 Kiev 3,343 65 Milan 1,910 99 Queenstown 1,265
32 Orlando 3,277 66 Seattle 1,893 100 Manila 1,250 33 Taipei 3,224 67 Lisbon 1,881
34 Mugla 3,211 68 East
Province 1,877
Summary(thousand) 358,209
Source: Euromonitor International, 2012
As for the condition nationwide, with the data of international tourists in United States, China and Japan as examples: the number of inbound tourists to the United States in 2010 reached 59,792,616, and that in 20 cities reached 33,270,000, accounting for 55.64% of the total number (Table 1-2.).
The number of inbound tourists to China in 2010 arrived 134,000,000 (data from China National Tourism Bureau-CNTB), and that to 28 main cities amounted to 56,779,992, accounting for 42.37% of the total number (Table 1-3.); the number of tourists to Japan nationwide in 2006 reached 2,817,570,000 (according to Tourism Bureau of Japan), and that to 15 designated cities and a special area amounted to 1,264,152,000, accounting for 44.87% of the total (Table 1-4.).
7
Table 1-2.
Top States and Cities Visited by Overseas Travelers of USA, 2010
Table 1-3.
International Tourists by Major Cities of China,
Jan.-Dec., 2010
Table 1-4. Tourists by Ordinance-Designated Cities
& Tokyo Wards Area of Japan, Jan.-Dec., 2006
No City Arrivals No City Arrivals No City Arrivals
1 New York City, NY 8462000 1 Beijing 4900661 1 the 23 wards of Tokyo 376981000 2 Los Angeles, CA 3348000 2 Tianjin 1660682 2 Sapporo 14100000 3 Miami, FL 3111000 3 Shenyang 550313 3 Sendai 15290000 4 Orlando, FL 2715000 4 Dalian 1166020 4 Saitama 21170000 5 San Francisco, CA 2636000 5 Changchun 249824 5 Chiba 17300000 6 Las Vegas, NV 2425000 6 Harbin 263609 6 Yokohama 39960000 7 Washington, DC 1740000 7 Shanghai 7337216 7 Kawasaki 12970000 8 Oahu/Honolulu, HI 1634000 8 Nanjing 1308791 8 Shizuoka 23630000 9 Boston, MA 1186000 9 Wuxi 791592 9 Nagoya 30740000 10 Chicago, IL 1134000 10 Suzhou 2075299 10 Kyoto 48390000 11 San Diego, CA 765000 11 Hangzhou 2757147 11 Osaka 104050000 12 Atlanta, GA 712000 12 Ningbo 951680 12 Sakai 5380000 13 Philadelphia, PA 633000 13 Huangshan 1050301 13 Kobe 29200000 14 Flagstaff, AZ 501000 14 Xiamen 1551865 14 Hiroshima 10280000 15 Seattle, WA 475000 15 Jinan 230985 15 Fukuoka 16700000 16 Houston, TX 448000 16 Qingdao 1080511 16 Kitakyushu 16440000 17 Anaheim-Santa Ana 369000 17 Wuhan 927903 Count 1264152000 18 Petersburg, FL Tampa/St. 343000 18 Guangzhou 8147900 Sources: Data book of tourists and
tourists resorts in Japan. (2006). Archives Press.
Databook of Tourists and Tourists Resorts in Japan. (2006). Japan Travel and Tourism Association.
国 際 観 光 白 書. (2006). Japan National Tourism Organization. 19 Dallas-Plano-Irving, TX 343000 19 Shenzhen 10206000
20 San Jose, CA 290000 20 Zhuhai 3251400 Count 33270000 21 Zhongshan 480600 Source: U.S. Department of
Commerce, ITA, Office of Travel and Tourism Industries.
Release Date: May 2011
22 Guilin 1486202 23 Haikou 132877 24 Sanya 415939 25 Chongqing 1370231 26 Chengdu 731993 27 Kunming 860632 28 Xi’an 841819 Count 56779992 Sources: The Yearbook of China Tourism Statistics, 2010
Therefore, it is demonstrated that, at the national level, although the statistical calibers are different, the number of tourists tending to cities occupies higher proportion in the total number of visitors nationwide. Accordingly, it is necessary to study the cities much more attracting for tourists.
(3) Impact of Tourist Arrivals on Urban
The large number of tourists to the urban will cause much impact, especially that the concentrated and excessive use within short period of time can cause greater impact to it.
In many cities, the overall image of tourism destination has declined due to the influx of tourists which led to the decline of service quality, environmental damage,
8
cultural relic’s damage, deterioration of public security, etc., and even led to the mass distrust between tourists and residents.
Therefore, it is essential to study urban tourism carrying capacity (UTCC) so as to avoid or control the above poor situation, which is also the starting point of this study.
1.2 Background of the study (1) Reality Background
In reality, with the development of economic and transportation, more and more people are choosing an urban area as tourism destination for leisure, shopping, entertainment, history learning and so on for vacation. The cities, overcrowded by tourists, will experience great pressure in various resources especially in holidays.
Figure 1-4 reflects the daily number of visitors in "Golden Week" and usual days in China. According to the figure, the number of tourists during holidays is much higher than that in usual days could be seen easily.
As for the data of 2001 - 2010, in 2001, the number of tourists in usual days was about 2,390,000, and this number reached 6,130,000 in 2010, meaning an increase of about 2.6 times.
At the same time, the daily amount in "Golden Week" increased from 9,140,000 in 2001 to 36,290,000 in 2010, indicating an increase of about 4 times; while the ratio of the daily number in "Golden Week" to that in usual days rose from 3.8 up to about 6.
Source: data from Statistics of CNTA (http://www.cnta.com/)
Rapid growth of the number of tourists also brings about many problems, such as the deterioration of social order, decrease of tourist satisfaction, etc.
With China Beijing as an example, in the Golden Week (1st-7th, Oct. 2010), the
number of visitors to the city has reached 9,300,000, showing additional 22% than that in the previous year. During the Golden Week, the number of criminal cases increased 12% over the same period last year (data from the National Holiday Office and China National Tourism Administration).
2001 2002 2003 2004 2005 2006 2007 2008 2009 2010 Golden Week 9E+06 1E+07 1E+07 1E+07 2E+07 2E+07 2E+07 3E+07 3E+07 4E+07 Ordinary Day 2E+06 2E+06 3E+06 3E+06 4E+06 4E+06 5E+06 5E+06 6E+06 6E+06
0 100 200 300 400 x 1 0 0 0 0 0
9
In addition, in 2010, Shanghai held World Exhibition from May 1st to October 31st, the number of visitors reached 73,080,000 in total, to be the largest ever number in exhibition history. The average daily number of visitors was hundreds of thousands, especially that in the last month, it roared up to 1,200,000 a day, sometimes tourists had to wait for 6 or 7 hours, leading to many complaints (data from Shanghai Municipal Tourism Administration).
The overcrowded tourists in some region of a city will also affect the city's atmospheric environment, which can be explained by the studies of Miyake Masahiko (2010), a Japanese scholar who takes Angkor Monuments in Kampuchea area as the object of study to research the influence of the number of local tourists on atmospheric environment.
The results show that activities of the tourists will affect the atmospheric environment surrounding tourism area, which is mainly displayed that the concentration of TSP (Figure 1-5.), particulate matter, and polycyclic aromatic compounds PAHs (Figure 1-6.) will rise with the increase of the tourist number.
Figure 1-5. Relationship of the Average Monthly TSP Concentration and Number of Inbound Tourists of Shemuiriapu Airport, Selected Period, 2006-2008
10
Souce: Fig. 1-5 and Fig. 1-6 are both according to the data of Pro. Miyake’s study on Angkor monument area (No. 19404003), Kanezawa University.
Urban tourism development is closely related with other industries, the tourism industry should be rapidly and harmoniously developed according to capacity of other industries. Whichever industry that once is beyond the carrying capacity of tourism industry will lead to various social and environmental problems, and even the industry vicious chain reactions.
Therefore, it is realistically necessary to study the UTCC. (2) Academic Background
The academic background of the study is on the source of unceasing expansion in tourism research. In reality, the travel range expansion has also led to the tourism research object expanding. However, a single attribute and its object inspection has been unable to meet the needs of the actual development for tourism destination study. From macro points of view, the current theories of carrying capacity are mainly applied into biology, demography, applied ecology and human ecology (Figure 1-7.)1.
As for the specific application, the current theories can be divided into carrying capacity of natural resources or environment to population, carrying capacity of ecological environment to specific living things and entertainment tourist carrying capacity (Figure 1-8.)2.
1 Seidl, I., Tisdell, C. A. (1999). Carrying capacity reconsidered: from Malthus' population theory to cultural
carrying capacity. Ecological Economics, 31, 395-408.
2 Ruan Benqing, Liang Ruiju, Wang Hao, et al. (2001). Water Resources Management in River Basin. Sciences
Press, 156-200.
Guo Xiurui, Mao Xianqiang.(2000). Review of land carrying capacity calculating methods in China. Progress in
Earth Science, 15(6), 705-711.
Figure 1-6. Relationship of the Average Monthly PAHs Concentration and Number of Inbound Tourists of Shemuiriapu Airport, Selected Period, 2006-2008
11
According to different research methods, specific empirical carrying capacity, general empirical capacity and theoretical carrying capacity can be summarized (Figure 1-9.)3.
In fact, the research of UTCC is developed along with the accelerated urbanization in human society. The increasing development of urbanization leads to the public’s concentrated demand of recreation within short period of time (such as vacations). The phenomenon caused people distribution in short time to wide range, and followed by malignant utilization of tangible and intangible resources in cities, so that the original balance of city system was destroyed.
The urban tangible tourism resources include ecological resources, environmental resources, infrastructure resources, all kinds of enterprises and their products, human resources and the like all of which physically restrict the UTCC.
Some resource, which is damaged due to some reasons and reduces its carrying capacity, will directly lead to usually violent exclusion effect. And the destruction to urban system can play effect in a short period of time and quickly reach to the most serious result. However, it will usually not last for long, and will gradually recover along with the passage of time or the change of resources due to external influence, which essentially reflects the "imbalances" of supply and demand of resources within a short time.
The intangible elements contain the social psychological factors of city residents (such as the psychological carrying capacity to the urban tourism), urban political and economic factors (including international political influence, national and city policy orientation, economic conditions, etc.), urban tourism service quality, the degree of opening of original customs and culture, all of which invisibly affect the city residents and tourists.
3 Lockwood, D. R. (1998). Reconsidering carrying capacity. (http://www.itd.ucdavis.edu/
~dale/studies/ carrying.html.)
Figure 1-9. Research Methods of Carrying Capacity Theory
Research Methods
Specific Empirical Carrying Capacity General Empirical Carrying Capacity Theoretical Empirical Carrying Capacity
Figure 1-8. Application of Carrying Capacity Theory (Micro)
Application of Carrying Capacity Theory
(micro)
Population Carrying Capacity of Natural Resource or Environment
Biological Carrying Capacity of a Specific Habitat
Tourism Carrying Capacity
Figure 1-7. Application of Carrying Capacity Theory (Macro)
Application of Carrying Capacity Theory (macro) Biology Demography Applied ecology Human ecology
12
Compared with tangible physical factors, intangible spiritual elements are more easily to form negative additive effect and butterfly effect. The former tends to outbreak after certain concentrated accumulation, triggering mass distrust; the latter will extent the former to the whole urban tourism system, followed by damage to the overall image of tourism site.
Negative effect is usually accumulated to a certain extent and outbreaks with group consensus triggered by a small chance, leading to large-scale influence, and this poor effect will last long both before and after outbreak.
Then, it appears the research with a wide range, multiple attribute set for the conditions of the tourism carrying capacity.
The present studies mainly focus on definition and measurement of the carrying capacity of physical natural environment, which meaning more attention to physical factors and relative neglect of social factors especially the carrying capacity of social system.
Tourism activity is essentially an intercultural communication featured in "subject-object" interaction, and the effect of psychosocial factors on tourism carrying capacity becomes more prominent. Therefore, it will be especially critical to take into social factors so as to study open social system such as the UTCC.
In addition, further studies on the elements of existing capacity, the index system and the research methods are needed from integrated and general perspectives so as to investigate and evaluate the carrying capacity.
Previous researches failed to focus on general open subjects with multidimensional attributes due to their different perspectives, research ideas and methods limited by different professions, geographical features and cultures. But in the relevant literature research, there are only a few case studies from single perspective such as ecology, environmental science or other disciplines to do the research in the city of U.S., Britain or some other developed countries. For Asian cities, it still needs further study.
This research attempts to integrate the exiting research to explore a new perspective to study the carrying capacity with multi-attributes.
1.3 Purpose of the Study
Urban area, as a representative region of concentrated human social civilization, is attracting more and more people, and the urban residents worldwide are also growing.
More and more large groups of urban people are drawing tremendous pressure to the tangible and intangible urban resources in a short period of time via leisure activities. In addition, urban as the travel destination, is attracting increasing more external tourist groups. Inner and outer huge crowd causes large-scale people concentration and distribution in urban tourism within short time, which is easy to destroy the balance of original city system and lead to malignant utilization of urban resource elements.
13
This paper aims to better define, investigate and evaluate UTCC, and accordingly make practical suggestions.
Based on the above situation, this paper attempts to construct the UTCC theory and study model from the overall and systematic perspectives and does the application research with specific areas.
The main objectives of the study are as follows:
(1) Based on summary of the existing researches, to define UTCC and related concepts, clarify the research content about UTCC and investigation factors, and establish the index system according to the factors.
① Based on the researches on carrying capacity and UTCC, this study aims to analyze the characteristics and connotation of UTCC.
② Analyze factors affecting the UTCC from four aspects, including tourism facilities, ecological environment, social culture, politics and economy, and further analyze the connotation of influential factors.
③ Establish index system according to the influencing factors.
(2) To establish model for investigation according to UTCC index system, and carry out research on characteristics and functions of the model.
① To classify the influencing factors into groups of physical investigation and non-physical investigation according to their characteristics and set measurement index system.
② To construct appropriate measurement model embracing different attributes. The carrying capacity of physical factors can be analyzed with MOM (multi-objective optimization) combined with FAHP, and that of non-physical factors can be analyzed with SRS combined with FAHP.
(3) The application study of the model will conducted with cities as examples.
① Carrying capacity of physical factors is investigated with Tokyo and Osaka as examples, based on the statistical data from governments.
② Carrying capacity of non-physical factors is investigated with Bunkyo District in Tokyo as an example, via questionnaire survey, to find out the social psychological carrying capacity of residents in Bunkyo District to tourists.
③ According to the investigation results from both physical and non-physical aspects, comprehensive value of UTCC will attempt to be given with Bunkyo District as an example.
(4) To make practical suggestions, from physical and non-physical level, for future tourism planning according to the investigation results.
14 Research train of thought is as Figure 1-10.
Notes:
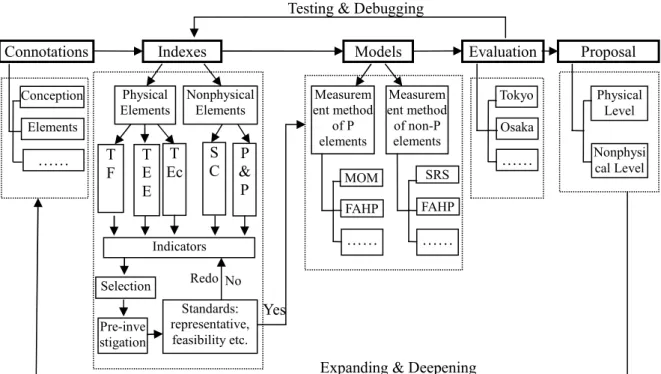
TF: Tourism Facilities TEE: Tourism Ecological Environment TEc: Tourism Economy SC: Social Culture P&P: Politics & Policy
1.4 Methods of Study
Normative research idea of this study conforms to "connotation system -- index system -- model simulation test -- advice proposal". Starting from the characteristics of the closed and open environment of the carrying capacity, the study analyzed the meaning and influencing factors of UTCC.
According to the elements of the establishment of evaluation index system and evaluation model, simulation test on the specific city, test results for different objects on the basis of comparative study. Finally, expand and deepen the connotation of UTCC, the adaptability of the index system and evaluation model analysis through the cross-cultural analysis and discussion.
The following research methods are adopted:
(1) Literature research. This method is mainly adopted to clarify the concept of UTCC, research contents & elements, and establish the evaluation index system & model, based on inheriting and drawing the existing research results.
(2) Surveys. Data for model establishment are collected via network, phone, questionnaire and interview. The former two means are mainly used to collect data for quantitative analysis of the physical factors of UTCC, while the latter two means are mainly used to collect data for qualitative analysis of non-physical factors of UTCC.
Figure 1-10. Research Train of Thought
Connotations Indexes Models Evaluation Proposal
Physical
Elements Nonphysical Elements
T F TE E T Ec S C & P P Measurem ent method of P elements Measurem ent method of non-P elements Selection Pre-inve stigation Standards: representative, feasibility etc. No Redo Indicators Yes Tokyo Osaka …… Testing & Debugging
Conception Elements …… FAHP …… SRS FAHP ……
Expanding & Deepening
Physical Level Nonphysi cal Level MOM
15
(3) Combination of qualitative analysis and quantitative analysis. The physical factors are quantitatively analyzed with FAHP and MOM; time sequence and regression analysis via the model are used to simulate and forecast the future situation. The carrying capacity of non physical factors is evaluated with SRS and FAHP. The study also gives the corresponding algorithm for combined application of the two methods.
1.5 Originality
(1) The theoretical innovation: The research presents the concept of UTCC, and does an analysis of its meaning and elements, constructs an evaluation model the application study of it.
(2) Innovation of research framework: This research is different from previous researches on the carrying capacity with a single tourism site and its single physical factor as object, then overall and systematically integrates physical and non-physical influencing factors to study UTCC.
(3) Innovation of research methods: This study on UTCC takes cities as subject of practice in macroscopic view, which is a general study model in study of tourism field. As for research methods, mathematics and computer application are combined, to reveal different influence degrees of different elements and different aspects of the same element.
FAHP is combined with MOM, SRS and FAHP are combined to qualitatively and quantitatively research of UTCC. As well, the qualitative analysis is adopted to correct quantitative results as an attempt in this study.
(4) Innovation of conclusions: This study, starting from the objective environment development trend, proposes the complexity of urban open system, reveals the multi-level factors to impact UTCC, and concludes that the factors are combined to affect urban system.
1.6 Construction of the Dissertation This paper includes 6 chapters:
Chapter One is the introduction of the study. It mainly introduced the overall framework of the UTCC study which includes the research summary, realistic and academic background, research purpose, methods, innovations and layout.
Chapter Two is literature review of the study. The origins of research on carrying capacity, the research development and the research status are explained to review the existing research results in Europe, the United States, Japan and China which are discussed from four aspects, including ecology, sociology, economics and political science. In addition, the shortcomings and development direction of existing research are also discussed in this chapter.
16
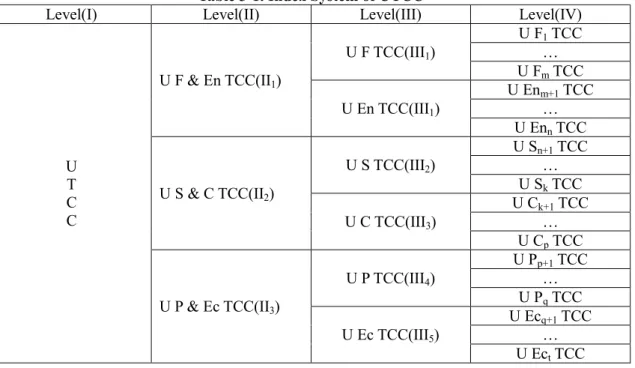
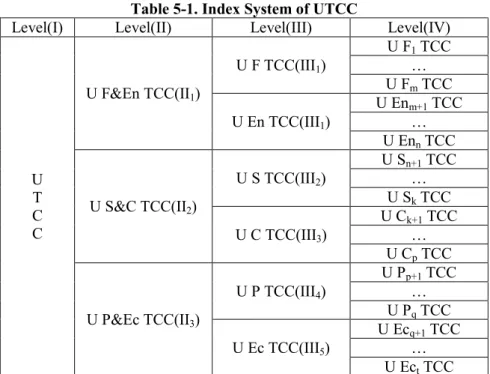
Chapter Three defines UTCC and builds required theories. After literatures reviews, the definition and meanings of UTCC are offered, and the corresponding research system is constructed from three aspects, including the Urban facilities-environmental TCC, Urban social-cultural TCC, and Urban political-economic TCC. The influencing elements are classified as physical and non-physical ones and the embraced specific indexes in each element are discussed, so as finally to establish evaluation index system of UTCC.
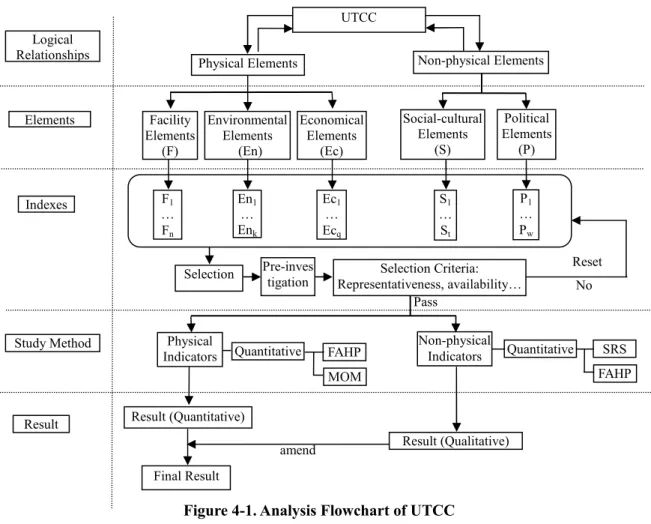
Chapter Four models UTCC. Model of UTCC is divided into three parts: the establishment of the index system according to the relationship of increasing layer from the three aspects of UTCC, research method of the physical and non-physical elements combining FAHP (fuzzy analytic hierarchy process) with MOM (multi objective optimization method) and SRS with FAHP to establish the study model, and the functions of the model, evaluated by three parameters r (curve fitting parameter), d (line spacing of the fitting curves) and S (surround area of the fitting curves).
Chapter Five is the application study of the UTCC model with specific cities. The physical indexes of tourism carrying capacity are studied with Tokyo and Osaka as examples, according to statistical data released by governments. The non-physical indexes are analyzed with Bunkyo District, Tokyo as example. Questionnaire surveys are carried out to collect the data needed so as to evaluate the social psychological carrying capacity of residents in Bunkyo District to tourist activities. This chapter finally puts forward to combining physical and non physical elements for investigation, and works out the comprehensive value of tourism carrying capacity with Bunkyo District as example after comprehensive investigation.
Chapter Six contains conclusions, development direction and suggestions. The conclusions summarize the practical and theoretical meaning of research on UTCC. The development direction describes theoretical system construction, index selection and classification, selection of evaluation methods for different indexes, the interaction degree and effect of different factors and indexes, applicability of model in different cultures (regions).
17
Chapter 2
Review of Literature
2.1 Origination and Development of UTCC Theory Origination
Urban tourism carrying capacity derives from the study of tourism carrying capacity, which originates from the concept of carrying capacity. As a result, the origin of tourism carrying capacity can be dated back to the origin of carrying capacity.
The origin of carrying capacity differs in time based on the various perspectives of disciplines.
From the perspective of applied ecology, Bartels (1993)4 dated the origin of carrying
capacity back to the American Yearbook of Agriculture in 1906; Merriam-Webster Dictionary (2012)5 traced it back to 1889 from the point of view of population biology; Malthus (1798)6 laid the foundation for the origin of carrying capacity from the perspective of demography in his work Essay on the principle of population published in 1798. Later Verhulst (1838)7 and Pearl et al. (1920)8 pointed out respectively and independently the Logistic equation which provided the mathematical expression formula for the theory of carrying capacity; Wagar (1964)9 believed that people had been aware of the limitation of land carrying capacity since prehistoric times and it was usually caused by the shortage of food as mentioned in many ancient books such as The
Old Testament. Haddon (1927)10 had once proved that the human migration is “mostly
caused by the shortage of food or excessive population”; some scholars (Chen Chunsheng, 1987)11 even dated the origin of carrying capacity back to the ancient Greek times. Most modern studies of carrying capacity are more inclined to the origin of ecology.
Development
Based on the progress and the quantity of relevant studies, the process of the carrying capacity concept applied in the tourism field can be divided into four stages:
The first stage was the period before 1930s when carrying capacity was mainly applied in the fields of ecology and demography. The major focuses of demography
4 Bartels, G. B., Norton, B. E., Perrier, G. K. (1993). An examination of the carrying capacity concept. In R. H.
Behnke Jr., I. Scooners, and C. Kerven (Eds.), Range ecology at disequilibrium. London: Overseas Development Institute, 89-103.
5 Merriam-Webster’s Collegiate Dictionary (11th ed.). (2012). Merriam Webster, 190.
6 Thomas M. (1978). Essay on the principle of population. London: J. Johnson, 396.
7 Verhulst, P. F. (1838). Notice sur la loique la population suit dans son accroissement. Correspondance
mathematiue et physique, 10, 113-121.
8 Pearl, R., Reed, L. J. (1920). On the rate of growth of the population of the United States since 1790 and its
mathematical representation. Proceeding of the National Academy of Sciences, 6(6), 275-288.
9 Wagar, J. A. (1964). The carrying capacity of wild lands for recreation. Forest Science Monographs, 7, 1-23. 10 Haddon, A. C. (1927). The wanderings of peoples. London: Cambridge University Press, 124.
11
陈春生.(1987). 环境容量收容力分析与都市成长管理之研究-以台北都会区水资源个案为例.国立台湾大
18
were the pessimistic Malthusian theory of population and the mathematical model of population growth (Pearl et al., 1920)12; ecology mainly centered on applied ecology (Zhang Linbo et al.,2009)13, including the maximum grazing capacity management of livestock farms (Hadwen et al., 1922)14, the validation of the mathematical models of demography which were applied in the field of ecology (Pearl, 1927)15, as well as the need for the protection practice of wild animal species (Young, 1998)16.
The second stage started from 1930s to 1960s. During early 1930s, the concept of carrying capacity was initially applied in the tourism field (Manning, 1999)17, though
the subject of the studies was only extended from animals and environment to tourists and environment, and the concern was limited to the visible damage caused to animals and plants with different quantities of tourists. However, during this period, researches such as Meinecke’s study of the impact of tourists on the tree roots in the California redwood parks (Meinecke, 1928)18, Sumner’s recommendations to the protection and management policies of California Mountains (Sumner, 1935)19, as well as the regional planned capacity of bathing beaches in New York (1928)20 might be regarded as the beginning of the study of tourism carrying capacity (McCool et al., 2001)21.
The Second World War (1939-1945) stopped the progress of carrying capacity study. While in America, as large amounts of tourists came to the national parks after war in 1950s, the demanding for improving the crowded situation in the parks became increasingly fierce (Clawson, 1963)22.
It was because since the economic concession in 1930s to 1950s, there was almost zero investment in the construction of facilities. The root cause was that many American managers for the leisure industry in early period were majored in forestry, wildlife zoology and range science who had never received professional training for park management. The tourists and the impact brought by them were soon defined as the (ecological) carrying capacity problem: the limitation of the initial design and management led to the fact that the facilities and resources failed to meet the gradually increasing demands of tourists (McCool et al., 2001)23. Devoto (1953)24, Clawson (1959)25 and many people wrote articles to express their dissatisfaction during the period.
12 Pearl, R., Reed, L. J. (1920). Ibid., p.17.
13 Zhang Linbo, Li Wenhua, Liu Xiaofu, Wang Wei. (2009). Carrying Capacity: origin, development and
prospective. Acta Ecological Sinica, 29(2), 878-888.
14 Hadwen, S., Palmer, L. J. (1922). Reindeer in Alaska. Bulletin of the U.S. Department of Agriculture, No. 1089. 15 Pearl, R. (1927). The growth of populations. Quarterly Review of Biology, 2(4), 532-548.
16 Young, C. C. (1998). Defining the range: the development of carrying capacity in management practice. Journal
of History of Biology, (31), 61-83.
17 Manning, R. E. (1999). Studies in Outdoor Recreation: Search and Research for Satisfaction. Corvallis: Oregon
State University Press.
18 Meinecke, E. P. (1928). The effect of excessive tourist travel on the California redwood parks. California
Department of Natural Resources, Division of Parks, Sacramento, 20.
19 Sumner, E.L., Jr. (1935). A life history of the California quail, with recommendations for its conservation and
management. California Fish and Game, 21, 167-256, 275-342.
20 Committee on the Regional Plan of New York and its Environs. (1928). Regional Survey of New York and its
Environs. Vol.V, Public Recreation. New York: Regional Plan of New York and its Environs, 116.
21 McCool, S. F., Lime, D. W. (2001). Tourism carrying capacity: Tempting fantasy or useful reality? Journal of
Sustainable Tourism, 9(5), 372-388.
22 Clawson, M. (1963). Land and Water for Recreation – Opportunities, Problems and Policies. Chicago: Rand
McNally and Company.
23 McCool, S. F., Lime, D. W. (2001). Ibid., p.18.
24 Devoto, Bernard. (1953). Let’s close the national parks. Harpers Magazine, 207(1241), 49-52. 25 Clawson, M. (1959). The crisis in outdoor recreation. American Forests, 65(3), 22-31, 40-41.
19
Based on the situation of the day, U.S. National Park Service proposed a ten-year’s project at its fifty years’ anniversary in 1956 which included 66 tasks to upgrade the park facilities. For the same reason, US Forest Service put forward a similar project named “Operation Outdoors” in 1957 and planned to fulfill it before 1962.
However, the actual tourists surpassed the conservative estimation of both projects. The number of tourists to forest park in 1959 was 15 million more than the estimated 66 million for 1962. A series of questions were reflected, such as “how many lands would be enough?”, “what’s the carrying capacity of the wild lands (forecast lands)?” and “is it necessary to manage the outdoor recreation activities from the perspective of sustainable development?” and so on (Wagar, 1964)26.
At that time, the American parks had taken certain measures to manage the resting space. For example, in 1957 U.S. Forest Service set the rule that the distance between the camping tents of different families should be 100 inches. Besides, there could only be three campsites within one acre in order to accommodate the roads and toilets (United States Forest Service, 1957)27. US National Park Service allowed four to seven campsites within one acre (United States National Park Service, 1960)28.
Japan witnessed the start-up of the study of tourism carrying capacity during this period which mostly examined the capacity for the tangible and limited spaces, falling far behind America.
The studies mainly included: Suzuki (1954)29 stated in Bathing Beach Plan that the carrying capacity for the grassland beside the lake or swimming pool was 8m2 (or 2.4 Tsubo) per person; Tamura (1948)30 believed that the carrying capacity of seaside is 14 m2 (or 4.2 Tsubo) per person; Shiota (1954)31 thought that the square for long-term camping should be 500 m2, and the wooden tent for eight persons should be 180 m2, and
it should be 56 m2 for four persons; Eyama combined the study of Wagner towards the required green area in parks for Berlin citizens (Wagner Martin, 1915)32, the New York local planning, the utilization situation in Japanese parks as well as the studies of previous scholars, and finally considered that the carrying capacity should vary according to the subject itself (ski resort, sea beach, natural park etc.) and the utilization modes (Eyama, 1956)33.
The third stage started from 1960s to 1980s. Since the beginning of 1960s, the rudiment of the tourism carrying capacity theory has already taken shape as Wagar defined recreational carrying capacity and pointed out research questions in the article “The carrying capacity of wild lands for recreation” in 1964 (Wagar, 1964)34.
26 Wagar, J. A. (1964). The carrying capacity of wild lands for recreation. Forest Science Monographs, 7, 1-23. 27 United States Forest Service. (1957). Operation outdoors: Part 1: national forest recreation. Washington, D.C.:
U.S. Government Printing Office, 14.
28 United States National Park Service. (1960). National Park Service camping policy. Washington, D.C.: NPS, 11. 29 鈴木忠義. (1954). 海水浴場の計画と施設. 国立公園, 5, 20-37. 30 田村剛. (1948). 国立公園講話. 明治書院, 163. 31 塩田敏志. (1954). 野営場の計画と施設. 国立公園, 1-3.
32 Wagner Martin. (1915). Städtische Freiflächenpolitik: Grundsätze und Richtlinien für Größe und Verteilung der
verschiedenen Arten von sanitärem Grün im Stadtplane mit besonderer Berücksichtigung von Groß-Berlin. Berlin:
Heymann, 23-55.
33
江山正美. (1956). 自然公園収容力の基本問題. 造園雑誌, 19(3), 1-4.
20
In the field of ecology, the studies of Wagar (1964), Frissel & Duncan (1965)35, Merriam & Smith (1974)36 revealed that the utilization (of tourists) and the impact on the plants and soil presented a non-leaner relationship, showing that mild utilization would exert strong impact. Combining the studies of Godfrey & Godfrey (1981)37, Hammitt & Cole (1987)38, Leung & Marion (2000)39 and so on in recent years, McCool & Lime (2001)40 described the relation as:
(1) The impact would appear with the existence of tourists (consequently, only when there was no tourists would the negative impact disappear);
(2) For the areas with high frequency of visit, to decrease the utilization (of environment) sharply was a must to reduce the existing impact;
(3) If the impact was already very serious, then it would be too difficult to improve and it would last a long term.
The principle problems for the studies in ecological field during this period were (Stankey, 1980)41:
(1) Few long-term follow-up study (Speight, 1973)42. The only exception was an investigation conducted in Boundary Waters Canoe Area which lasted for five years (McCool et al., 1969; Merriam, 1974; Merriam et al., 1973)43. The main subject was the impact of tourists on the newly developed campsites, and it discovered that most of the campsites had suffered the most serious impact during the first two years.
(2) Not enough study about the impact of resting activities on waters. Only Merriam & Smith (1974)44 studied the Escherichia coli, phosphate and opacity of the waters around the campsites. The result showed that the indicators for the regions near the campsites had a higher value while the other factors such as temperature and dissolved oxygen quantity were not impacted. As a result, they concluded that the resting activities had small impact on the quality of water.
35 Frissel, S. S., Duncan, D. P. (1965). Campsite preference and deterioration. Journal of Forestry, 63(4), 256-260. 36 Merriam, L. C. Jr., Smith C. K. (1974). Visitor impact on newly developed campsites in the Boundary Waters
Cabie Area. Journal of Forestry, 72(10), 627-630.
37 Godfrey, P.J., Godfrey, M.M. (1981). Ecological effects of off-road vehicles on Cape Cod. Oceanus, 23, 56-67. 38 Hammitt, W.E., Cole, D.N. (1987). Wildland Recreation: Ecology and Management. New York: Wiley. 39 Leung, Y. and Marion, J.L. (2000). Recreation impact and management in wilderness: A state-of-knowledge
review. In Cole, D.N., McCool, S. F., Borrie, W.T. and O’Loughlin, J. (comps.) Wilderness Science in a Time of
Change: Vol.5. Wilderness Ecosystem, Threats, and management. Proceedings RMRS-P-15-VOL-5. U.S.
Department of Agriculture, Forest Service, Rocky Mountain Research Station, Ogden, Utah, 23-48.
40 McCool, S. F., Lime, D. W. (2001). Ibid., p.18.
41 Stankey, G. H. (1980). Wilderness carrying capacity: management and research progress in the United States.
Landscape Research, 5(3), 6-11.
42 Speight, M. C. D. (1973). Outdoor recreation and its ecological effects: a bibliography and review. Discussion
papers in conservation 4, University College, London, U.K., 35.
43 McCool, S. F., Merriam, L. C., Jr. and Cushwa, C. T. (1969). The condition of wilderness campsites in the
Boundary Waters Canoe Area Minn. Forest Research Notes 202, University of Minnesota, Miinneapolis, 4.
Merriam, L. C., Jr., Smith C. K. (1974). Ibid., p.19.
Merriam, L. C., Jr., Smith C. K., Milner,D.E., Chingtiao Huang, Tappeiner, J.C., Tappeiner II, Goeckermann Kent, Bioemendal, J.A. and Costello, T.M. (1973). Newly developed campsites in the Boundary Waters Canoe Area:
a study of 5 years’ use.St. Paul: Agricultural Experiment Station, University of Minnesota, 27.
21
(3) Too less attention on the public health. For example, the study of Taylor & Erman (1979)45 indicated that recreational utilization was beneficial to the growth of submerged plants. They believed that in the areas of mountains and rivers, human utilization would induce the nutrient to be accumulated at the bottom of the lakes, therefore enhancing the growth of submerged plants. However, though their investigation showed that in certain areas recreational activity would benefit the growth of plants, it was shortsighted from the perspective of public health.
(4) Too few studies on the impact of tourists on wild animals (quantity, distribution and behaviors of species etc). Only Speight (1973)46, Stankey & Lime (1973)47 and Ream (1980)48 made some researches. The impact of tourists on the quantity of wild animals was very obvious, especially for the habitats. If the habitats were small or the quantity was limited, which became a tourist attraction, then the animals lived there would be easy to be disturbed by tourists. However, the studies relevant with this topic were seldom.
Actually, the physical-ecological impact (of tourists on recreational area) was a very complicated process, and sometimes it was even impossible to find out. At most times, for example, if the human activity at the campsite has caused damage to one of the species, some other specie with stronger vitality would appear to replace it and finally reach a new ecological balance (Verburg, 1974)49.
During this period when tourism carrying capacity was being dug deeper in ecological field, it was also extended to the sociology field, triggering reflection on its social attribute. “Reflection on the impact of the utilization (of tourists) is not only limited to the ‘physico-ecological’ change to the environment, but also the impact on tourist experience” (Stankey, 1980) 50.
Though the study of Wagar (1964)51 didn’t mention the sociological impact of
(tourists’) “utilization” directly, it was involved in many points of the study. For example, it discussed the relationship between “congestion and recreational quality”, and studied the relation of the number of tourists and the recreational quality under various utilization modes, each of which was stated in detail. The paper also mentioned the field research in McKinley National Park in the summer of 1958 which mainly examined the distances among the campers in the park and got the result that the distance varied according to the personality (taste) of the camper. More or less these belong to the research scope of tourism social carrying capacity.
Some scholars also studied the willingness of encounter during recreational activity. Lucas’s (1964)52 study in BWCA (Boundary waters Canoe Area) showed that people
45 Taylor, T. P., Erman, D. C. (1979). The response of benthic plants to past levels of human use in high mountain
lakes in Kings Canyon National Park, California, USA. Journal of Environmental Management, 9(3), 271-278.
46 Speight, M. C. D. (1973). Ibid., p.20.
47 Stankey, G., Lime, D. (1973). Recreational carrying capacity: an annotated bibliography. USDA Forest Service,
General Technical Report, INT-3, 45.
48 Ream, C. H. (1980). Impacts of backcountry recreationists on wildlife: an annotated bibliography. USDA Forest
Service, General Technical Report, INT-81, 62.
49 Verburg, K. (1974). The carrying capacity of recreational lands: a review. Occasional Paper No. 1, Prairie Region,
Parks, Canada. 70.
50 Stankey, G. H. (1980). Ibid., p.20. 51 Wagar, J. A. (1964). Ibid., p.17.
22
who were canoeing expected less opportunity to encounter than people who were on a motorboat, and they were extremely reluctant to meet motorboat. Lime (1975)53 testified the study of Lucas in the report released in 1975, indicating that three fourths of the people who went rafting claimed too many encounters (among each other) during one journey. And they believed that the quality of the journey would be impacted with over three times of encounter as it would lose the feeling to get close to nature. More than 90% of people who canoed claimed that they would not like to meet motorboat.
For the study of tourist perception tolerance, Stankey (1973)54 found the general
trend that the tolerance would decrease with the increase of utilization degree. It was discovered that 75% of the tourists would not like to meet backpackers during the journey and only 20% of them could accept four times of encounters. Fewer people showed their willingness or even acceptance of a party.
However, it didn’t mean that the quality of outdoor experience would decrease with the increase of utilization degree. Stankey also discovered that compared to “no people”, tourists tend to be more willing to meet other teams for one or two times. Pfister & Frenkel (1974)55 found the similar situation during the investigation conducted towards the tourists in Rouge River that almost half of them preferred one time encounter compared to “no people”. This could at least show that it was also important to provide proper opportunity to contact with other people.
Shebly (1980)56 studied the relationship of actual contact and degree of satisfaction. After an investigation towards the drifters in Grand Canyon, it showed that though the river was frequently utilized, there was not so much actual contact among the drifters. It was quite relevant with the terrain, utilization mode and people’s willingness to avoid contacting with others. One crucial problem was, even though the average actual contact rate surpassed the proper frequency agreed by the tourists (two or three times per day) as it reached zero to ten times per day, there seemed no relations between congestion and actual contact. The study finally believed that there was no direct negative correlation between the feeling of congestion and the overall satisfaction of the journey.
Other studies regarding the social attribute of carrying capacity were conducted during this period too, such as the behavior characteristics for experienced tourists who stayed overnight in campsite (Thomas et al., 1979)57, the impact of large amounts of tourists on other tourists (Lime, 1972)58 and the attitude of other tourists (Stankey, 1973)59, the impact of tourists’ illegal behavior and trace (waste) on other tourists as well as the satisfaction (Badger, 1975;60 Lee, 197561).
Paper LS-15, 34.
53 Lime, D. W. (1975). Sources of congestion and visitor satisfaction in the Boundary Waters Canoe Area.
Proceedings of the Third Boundary Waters Canoe Area Institute, Quetico-Superior Foundation, Duluth MN, 68-82.
54 Stankey, G. H. (1973). Visitor perception of wilderness recreation carrying capacity. USDA Forest Service
Research Paper, INT-142, 61.
55 Pfister, R. E., Frenkel, R. E. (1974). Field investigation of river use within the wild river area of the Rogue River.
Oregon: Interim Report to Oregon State Marine Board, 112.
56 Shelby, Bo. (1980). Crowding models for backcountry recreation. Land Economics, 56(1), 1-27. 57 Thomas, A. H., Peter, D. (1979). Systematic observation of use levels, campsite selection and visitor
characteristics at a high mountain lake. Journal of Leisure Research, 11(4), 307-316.
58 Lime, D. W. (1972). Large groups in the Boundary Waters Canoe Area – Heir numbers, characteristics, and
impact. USDA Forest Service Research, Note NC-142, 4.
59 Stankey, G. H. (1973). Ibid., p.21.
23
What’s more, as the complexity of carrying capacity – “it is decided by the original construction intention of the facility and no carrying capacity is suitable for every area” – was gradually recognized, it triggered reflections on the questions of managerial targets that “the available utilization degree of (wild area)” (Lime, 1970)62 and “what kind of changes (caused by tourist utilization) are acceptable?”.
For example, based on the figures in 1971, Grand Canyon National Park in America allowed maximal 96, 500 people per day to drift on the Colorado River in the park in 1972. Later the figure was modified to 169, 500 according to the river management plan. However, the disputes existed on the questions such as what should be the correct figure and how to manage it. Since then, the parks and protection zones took different ways to consider the problems of carrying capacity and the restriction of maximal utilization in policy.
Meanwhile, with the increase of experience and knowledge in management and other aspects, the carrying capacity of facilities were also considered and interpreted to be the allowed overall maximal resting utilization based on regional management targets. It included two layers of meaning: (1) carrying capacity was not fixed or incoherent; (2) carrying capacity was diversified with different research purposes.
The Japanese academia has gradually extended the study of carrying capacity from the physical (body) level of tourists to the spiritual level, incorporating the spiritual (feeling) sense of distance into the study of carrying capacity.
However, no matter in quantity or the depth of study, it fell behind the leading countries such as America. The main studies in Japanese academia during this period were: Shinshi (1970)63 studied the touring route and the distance among tourists in the park; Eyama (1974)64 was entrusted by the Japan Environmental Agency to study the
carrying capacity of natural park; Kondou and other scholars (1977)65 studied the carrying capacity of the grassland in parks; Mima (1977)66 made a research on the width of the hiking paths of Hakusan National Park.
It was easy to see that from 1960s to 1980s, the study of carrying capacity went deeper and more specific in the physico-ecological aspect. The research in ecological field showed that there was non-linear relationship between “utilization” and “impact”. Meanwhile, the carrying capacity of (manmade) facilities was added to the research scope. What’s more, the study of social carrying capacity started at this time.
The fourth stage started from 1980s to date. As the extension of carrying capacity,
social carrying capacity. Fort Collins: M.S. thesis, Colorado State University, 83.
61 Lee, R. G. (1975). The management of human components in the Yosemite National Park ecosystem: Final
research report. Yosemite Nat’l Park CA: The Yosemite Institute, 134.
62 Lime, D. W. (1970). Research for the determining use capacities of the Boundary Waters Canoe Area. Naturalist
21(4), 9-13 63 進士五十八. (1970). 公園設計に関する基礎的研究(第一報)―特に一定空間内に於ける人間の占有位置 及び占有空間規模の特性について. 造園雑誌, 33(3), 22-29. 64 江山正美, 他. (1974). 自然公園における収容力に関する研究(最終報告). 環境庁自然保護局, 107. 65 近藤三雄, 小沢知雄. (1977). 芝生地の収容力に関する基礎的研究(I). 造園雑誌, 40(3), 11-23. 近藤三雄, 安藤茂子, 小沢知雄. (1979). 芝生地の収容力に関する基礎的研究(II). 造園雑誌, 43(2), 12-19. 66 美馬秀夫. (1977). 白山における許容登山利用へのアプローチ. 国立公園, 333, 1-3.
24
tourism carrying capacity was endowed with more connotations and the research scope was expanded to economic, political and managerial fields. Compared to before, the research methods were diversified and some case studies applied the existing theory into practice.
The theory of LAC (Limits of Acceptable Change) pointed out by Stankey (1984)67 and others in 1984 marked that the perspective of tourism carrying capacity study was gradually changing to be more integral and systematic.
The LAC theory was based on following five acknowledges: (1) specific targets should be set up to confirm the protected content of many managerial actions; (2) there would always be some environmental changes in the system of nature; (3) any recreational utilization would lead to certain changes; (4) the question for management was the limits of acceptable changes; (5) it was necessary to examine the result of management so as to make sure if the actions were effective. The method was firstly applied to the wild animal management by USDA Forest Service.
Later, American National Park and Recreational Act required the National Park Service (NPS) to include the capacity management into the overall management plan of the park (Budruk, 2001)68. To this end, the researchers in the NPS systematically proposed VERP (Visitor Experience & Resource Protection) theory as the planning framework for the implementation of capacity policies as well as the tool for monitoring and management (National Park Service, 1997)69.
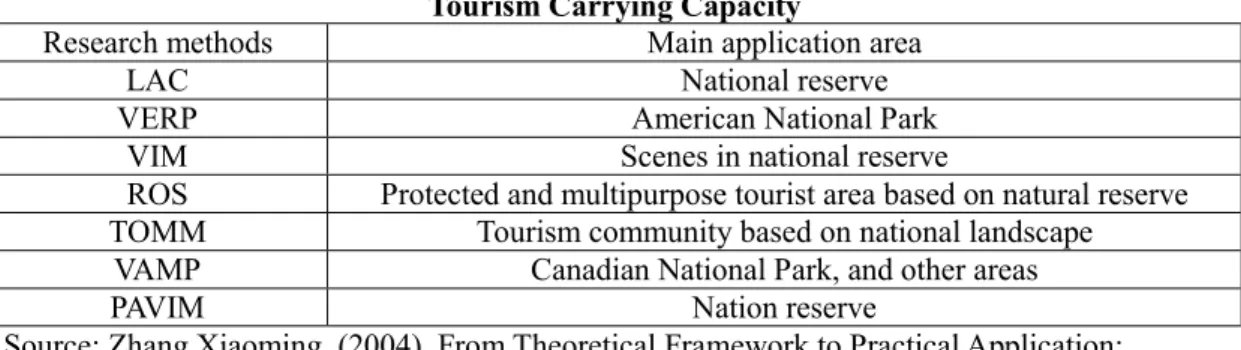
Apart from LAC and VERP, many scholars studied tourism carrying capacity with models from different perspectives, marking that the theoretical study of tourism carrying capacity was becoming more and more systematic and specific. For example, there was VIM (Visitor Impact Management) (Graefe et al., 1990)70, VAMP (Visitor Activities Management Process) (Nilsen et al., 1998)71, ROS (Recreation Opportunity
Spectrum) (Clark et al., 1979)72, TOMM (Tourism Optimization Management Model) (Manidis, 1997)73, PAVIM (Protected Areas Visitor Impact Management) (Farrell et al., 2002)74 and so on. The research methods and main application area were shown in following table (Table 2-1.).
67 Stankey, G. H., McCool S. F., Stokes G. L. (1984). Limits of acceptable change: A new
framework for managing the Bob Marshall Wilderness Complex. Western Wildlands, 10(3), 33-37.
68 Budruk, M., Valliere, W., Manning, R., et al. (2001), Crossing Programmatic Boundaries: Integrative Approaches
to Managing the Quality of the Visitor Experience. The George Wright Forum, 18(3), 124-131.
69 National Park Service. (1997). The Visitor Experience and Resource Protection (VERP) Framework: A
Handbook for Planners and Managers. Washington, D.C.: National Park Service, 5-11.
70 Graefe, A. R., Kuss, F. R., Vaske, J.J. (1990). Visitor Impact Management: The planning Framework.
Washington, D.C.: National Parks and Conservation Association.
71 Nilsen, P., Tayler, G. (1998). A comparative analysis of protected area planning and management frameworks.
Proceedings: Limits of Acceptable Change and Related Processes: Progress and Future Directions, Ogden, UT: USDA Forest Service Rocky Mountain Research Station, 49-57.
72 Clark, R. N., Stankey, G. H. (1979). The Recreation Opportunity Spectrum: A Framework for Planning,
Management, and Research. US Department of Agriculture Forest Service, Pacific Northwest Forest and Range
Experiment Station, General Technical Report PNW-98
73 Manidis, R. C. (1997). Developing a Tourism Optimization Management Model (TOMM), A Model to Monitor
and Manage Tourism on Kangaroo Island, South Australia. Surry Hills, New South Wales: Manidis Roberts
Consultants.
74 Farrell, T. A., Marion, J. L. (2002). The Protected Area Visitor Impact Management (PAVIM) Framework: A