3-5 2008 年 岩手・宮城内陸地震前の東北地方の地震活動について
Seismicity changes in northern Tohoku District before the 2008 Iwate-Miyagi
Nairiku Earthquake
統計数理研究所 The Institute of Statistical Mathematics 岩手・宮城内陸部地震(M7.2)が 2008 年 6 月 14 日に発生したが,それに先立つこと10年余りの地震活 動の経緯を調べた.2003 年 5 月 26 日に宮城県気仙沼沖の深さ 71km で沈み込む太平洋プレート内を震源 とするM7.1 の地震(三陸南地震)が発生した.この断層運動によって岩手県南部・宮城県北部地域を含む 東北地方内陸部の逆断層系においてクーロン破壊応力変化(CFS)が増加し地震活動も活発化した(第 1 図)1).この一環として2003 年7 月 26 日M5.5 の前震活動を始めとして M6.2 宮城県北部地震が誘発されたと 考えられるが,今回の岩手・宮城内陸部地震の発生も促進されたと考える.さらに,宮城県北部地震によっ ても岩手・宮城内陸部地震の発生は促進されている(第 1 図右上図).本報告では岩手・宮城内陸部地震の 断層内(または深部延長)で一定の前駆すべりも促進されたものと仮定して,これに基づいて周辺部の地震 活動の変化の説明を試みる.前駆すべりの断層メカニズムとしてキネマティック GPS データによる地震時断 層モデル(表 1 参照)2) の南側断層解を使用した.受け手のメカニズムとして,余震活動についてはそれらの 本震のメカニズムと同様であるとし,その他の小地域では F-net で決められた震源メカニズムをその地域の 断層群の代表であるとして採用した. 各地域の地震(余震)活動に ETAS モデルをあてはめ,有意な地震活動変化があるか否かを AIC 修正版 で確かめた.先ず,日本海中部地震の余震活動域はストレスシャドウ(クーロン破壊応力CFS が減少してい る地域)になっている.ここで 2005 年 10 月 18 日に M5.4, M5.3 を始めとする 2 次余震が発生しているが, その直後からは静穏化している(第 2 図).CFS が増加している岩手青森地域では 2003 年半ばより活発化 している(第 3 図).太平洋プレート境界やアウターライズ地域の地震活動はCFS の増減と調和的に変化し ている(第4図,第5図).2003 年三陸南地震や宮城県北部地震の余震は順調に推移しており,それぞれの CFS の増減はほぼニュートラルであった(第6図,第7図).東北地方南部の活動は順調に推移かやや活 発化している(8図). さらに,岩手・宮城内陸部震源域の近辺の地震活動も調べた.南部隣接域(第9図)と南西部隣接域(第 10図)における地震群はストレスシャドウにあたり活動静穏化が見られる.特に南西部近傍の 1996 年 8 月 11 日の M6.1 を本震とする鬼首群発地震は本震-余震型に減衰していたが 4 年ほど経って 2000 年前後から静 穏化している(第10図).その北側隣接域地域の活動(第11図)は 2007 年あたりから加速度的に活発して 岩手・宮城内陸部地震に至っている.この活発化をCFS の増加で説明するためには,すべりの位置を断層 の深部延長部におかなければならない.岩手・宮城内陸部地震の余震活動(第12図)は 2009 年 4 月現在 まで順調に経緯している. 本解析にかんして地震研究所TSEIS と気象研究所 MICAP-G,データについては気象庁一元化震 源データを使用した. 追記.第182回予知連での報告後,島崎会長と地理院 3) から以下の測地情報を得た.すなわち,すべり 断層の直上にある栗駒2において周りの GPS 観測点と比べて 2004-2007 年にかけて南東方向への移動が 見られること,及び 2005 年 11 月から2年にかけて,栗駒2と 500m 離れた臨時観測点のどちらにも南東方向 に約7mmの変動が見られたことである.これらは本報告の断層モデルのすべりを支持し,計算意よると2年
間のすべり量は 3 cm 程度であったことになる.
(熊澤貴雄, 尾形良彦, 遠田晋次) 参考文献
1) Ogata, Y., 2005, J. Geophys. Res. 110, B05S06, doi:10.1029/2004JB003245 2) 東北大(太田雄策,大園真子,飯沼卓史,三浦哲), 2008,
http://www.aob.geophys.tohoku.ac.jp/info/topics/20080614_news/GPS/ 3) 国土地理院, 2009, 地震予知連絡会報, 81, 208-263.
表1 岩手・宮城内陸部地震の断層解2)
Table 1 Fault model of the Iwate-Miyagi Nairiku Earthquake by Group for the Emergent Observation of the Iwate-Miyagi Nairiku Earthquake in 2008 and Graduate School of Science, Tohoku University (2008), On the Iwate-Miyagi Nairiku earthquake in 2008.
fault
surface Longitude (deg.) Latitude (deg.) depth (km) length (km) width (km) Strike (deg.) Dip (deg.) Rake (deg.) slip (m) Northern 140.979E 39.109N 0.5 20.6 12.1 195.2 44.9 105.5 1.8 Southern 140.907E 38.927N 0.4 12.6 10.1 225.3 25.0 80.9 3.5
第1図 2003 年宮城県沖地震(左上)や宮城県北部地震(右上)による岩手・宮城内陸地域のCFF と 2002 年 8 月から翌年7月に掛けての地震活動.左中下は時空間,右中下は累積図.赤い累積曲線は ETAS モデ ルによる.
Fig. 1 The top left and right panels show CFF map for the Iwate-Miyagi Nairiku (Inland) region transferred from 2003 Miyagi-Ken-Oki and Northern Miyagi-Ken earthquake source, respectively. Left middle and bottom: Latitude and longitude against time plots of earthquakes from August 2002 through July 2003. Right middle and bottom: The empirical (black) and theoretical (red) cumulative curves with respect to regular and transformed time for the same period
第2図 1983 年日本海中部地震余震域周辺の CFF と地震活動.赤い累積曲線は ETAS モデルによる.
Fig. 2 CFF map for the aftershock region in and
around 1983 central Japan Sea earthquake, and empirical (black) and theoretical (red) cumulative curves with respect to regular and transformed time from October 1997 till the day before the 2008 Iwate-Miyagi
第3図 東北地方北部のCFF と地震活動. 赤い累積曲線は ETAS モデルによる.
Fig. 3 CFF map for the northern Tohoku
District, and empirical (black) and theoretical (red) cumulative curves with respect to regular and
transformed time from October 1997 till the day before the 2008 Iwate- Miyagi Nairiku earthquake..
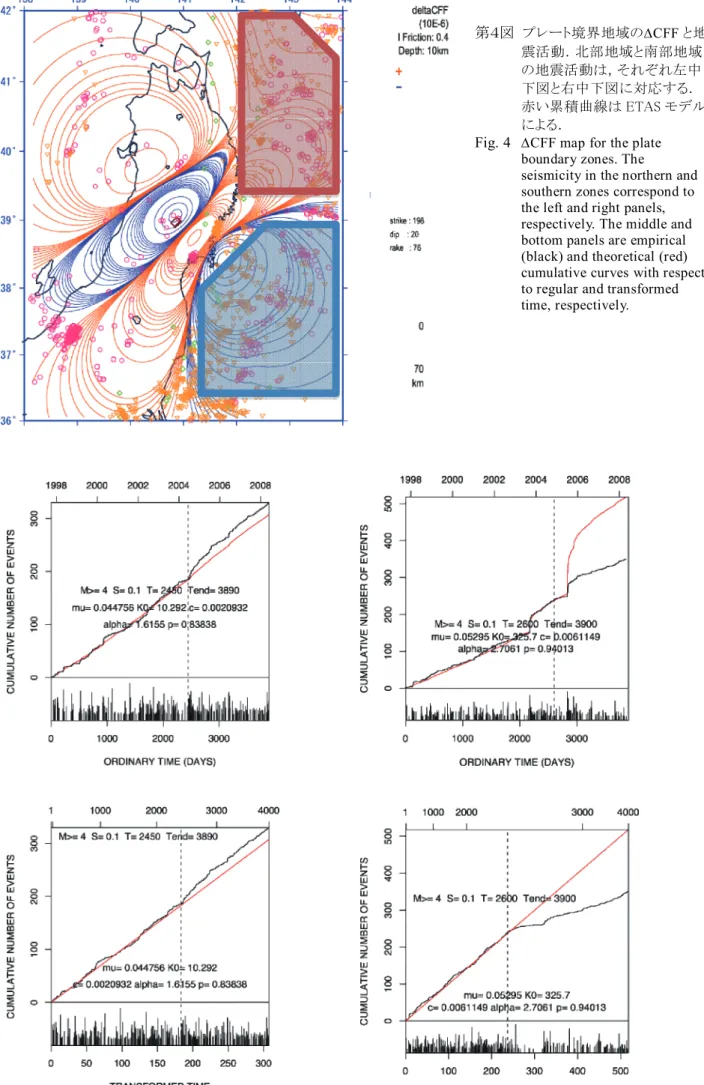
第4図 プレート境界地域のCFF と地 震活動.北部地域と南部地域 の地震活動は,それぞれ左中 下図と右中下図に対応する. 赤い累積曲線は ETAS モデル による.
Fig. 4 CFF map for the plate
boundary zones. The
seismicity in the northern and southern zones correspond to the left and right panels, respectively. The middle and bottom panels are empirical (black) and theoretical (red) cumulative curves with respect to regular and transformed time, respectively.
第5図 太平洋プレートアウターライズ地 域のCFF と地震活動.北部地域 と南部地域の地震活動は,それぞ れ左中下図と右中下図に対応す る.赤い累積曲線は ETAS モデル による.
Fig. 5 CFF map for the outer rize zones.
The seismicity in the northern and southern zones correspond to the left and right panels, respectively. The middle and bottom panels are empirical (black) and theoretical (red) cumulative curves with respect to regular and transformed time, respectively.
第6図 2003 年宮城県北部地震余震域のCFF と 余震活動.赤い累積曲線は ETAS モデル による.
Fig. 6 CFF map for the aftershock region of the
northern Miyagi-Ken earthquake, and empirical (black) and theoretical (red) cumulative curves with respect to regular and transformed time from the mainshock until the 2008 Iwate-Miyagi Nairiku earthquake.
第7図 2003 年宮城県沖地震余震域のCFF と余震活動.赤い累積曲線は ETAS モデルによる.
Fig. 7 CFF map for the aftershock region
of the 2003 Miyagi-Ken-Oki
earthquake, and empirical (black) and theoretical (red) cumulative curves with respect to regular and
transformed time from the mainshock until the 2008 Iwate-Miyagi Nairiku earthquake.
第8図 東北地方南部のCFF と地震活動.赤い累積曲線は ETAS モデルによる.
Fig. 8 The left panels shows CFF map for the southwestern region. Left middle and bottom: Latitude and longitude against time plots of earthquakes from August 2002 through July 2003. Top right and middle panels: The empirical (black) and theoretical (red) cumulative curves with respect to regular and transformed time for the same period.
第9図 岩手・宮城内陸震源域の南部隣接域の CFF と地震活動.
Fig. 9 CFF map and seismicity in the southern
neighboring region of the source, and empirical (black) and theoretical (red) cumulative curves with respect to regular and transformed time from 1996 till the 2008 mainshock.
第10図 岩手・宮城内陸震源域の南西部隣 接域のCFF と地震活動.
Fig. 10 CFF map and seismicity in the
southwestern neighboring region of the source, and empirical (black) and theoretical (red) cumulative curves with respect to regular and transformed time from 1996 till the 2008 mainshock.
第11図 岩手・宮城内陸震源域の西部隣接域の CFF と地震活動.
Fig. 11 CFF map and seismicity in the western
neighboring region of the source, and empirical (black) and theoretical (red) cumulative curves with respect to regular and transformed time from 1996 till the 2008 mainshock.
第12図 岩手・宮城内陸地震の余震活動.
Fig. 12 Aftershock activity of the 2008 Iwate-
Miyagi Nairiku Earthquake, and empirical (black) and theoretical (red) cumulative curves with respect to regular and transformed time from 1996 till the 2008 mainshock.