鳥取大学研究成果リポジトリ
Tottori University research result repository
タイトル
Title Effect of Mechanical Pre-Lithiation on ElectrochemicalPerformance of Silicon Negative Electrode for Lithium-Ion Batteries
著者
Auther(s) Domi, Yasuhiro; Usui, Hiroyuki; Iwanari, Daichi;Sakaguchi, Hiroki
掲載誌・巻号・ページ
Citation Journal of the Electrochemical Society , 164 (7) :A1651 - A1654
刊行日
Issue Date 2017-06-02
資源タイプ
Resource Type 学術雑誌論文 / Journal Article
版区分
Resource Version 著者版 / Author
権利
Rights © 2017 The Electrochemical Society
DOI 10.1149/2.1361707jes
Effect of Mechanical Pre–Lithiation on Electrochemical Performance of Silicon Negative Electrode for Lithium–Ion Batteries
Yasuhiro Domi,a,b Hiroyuki Usui,a,b Daichi Iwanari,a,b Hiroki Sakaguchia,b,z,*
a Department of Chemistry and Biotechnology, Graduate School of Engineering, Tottori University,
Minami 4–101, Koyama–cho, Tottori 680–8552, Japan
b Center for Research on Green Sustainable Chemistry, Tottori University, Minami 4–101, Koyama–
cho, Tottori 680–8552, Japan
[email protected]–u.ac.jp, [email protected]–u.ac.jp, [email protected], [email protected]–u.ac.jp
* Electrochemical Society Active Member.
z Corresponding authors:
E–mail address: [email protected]–u.ac.jp (Hiroki Sakaguchi) Tel/Fax: +81–857–31–5265
Abstract
The effect of pre–lithiation on the electrochemical performance of Si negative electrodes for lithium– ion batteries was studied. A pre–volume–expansion of Si induced by the pre–lithiation is expected to decrease the relative change in volume of Si during charge–discharge reactions. Suppression of change in volume of Si should improve the cycle performance, the Coulombic efficiency, and so on. When the mechanically pre–doped Li was extracted from Li–Si alloy during the first cycle, an alloy electrode exhibited the poor cycle performance just like a Si–alone electrode. On the other hand, the Li1.00Si electrode exhibited the improved cycle performance and higher Coulombic efficiency under
the discharge cut–off potential of 0.7 and 0.5 V, respectively. The electrode also showed 1.5 times longer cycle life compared to the Si–alone electrode when the charge capacity and the cut–off potential were limited. These results demonstrated that the appropriate mechanical pre–lithiation helps to improve the poor electrochemical performance of the Si negative electrodes.
1. Introduction
Silicon (Si) is a potential candidate as an active material for the negative electrode in lithium– ion batteries (LIBs) due to its high theoretical capacity of 3580 mA h g–1 (Li3.75Si).1,2 However, a
significant change in volume of Si occur during charge (lithiation) and discharge (delithiation) reactions.3 The expansion ratio per Si atom from Si to Li3.75Si corresponds to 380%, which generates
high stresses and large strains in the active material.4 The strains that accumulate under repeated charge–discharge cycling result in cracking and pulverization of the active material, which causes a loss of electric contact with the current collector. Hence, the Si negative electrode disintegrates and shows a rapid capacity fading and a poor cycle performance. In addition, the cracking and pulverization of the active material cause a decrease in the Coulombic efficiency because the reductive decomposition of the electrolyte on the newly formed Si surface.5 High Coulombic efficiency is required to achieve the practical use of LIBs with new active materials.
To improve the Coulombic efficiency of Si–based electrodes, researchers have proposed various approaches, including the synthesis of three–dimensional hyperporous silicon flakes,6 a preparation of Si nanowire with interconnected structure,7 and a pre–lithiation of Si,8 In addition to compensate an irreversible capacity, the pre–lithiation has been previously reported to make a full battery with active materials of lithium–free positive and negative electrodes (e.g. Silicon–Sulfur).9,10 The pre–lithiation of Si was carried out mainly by an electrochemical and a chemical methods. In the electrochemical pre–lithiation, Si electrodes were galvanostatically charged and discharged for 10 cycles between 0.1 and 0.7 V vs. Li+/Li.9 The Si electrodes were charged without any potential
limitation to obtain a pre–lithiated Si in the final discharge step. In the chemical pre–lithiation, on the other hand, the Si electrode and a piece of lithium metal were immersed and contacted (short– circuited) in the electrolyte solution.8,10 The degree of pre–lithiation was controlled by changing the contact time. While a crystalline Li–Si alloy phase was synthesized by a mechanical alloying (MA) method11 and studied based on density functional theory,12-16 the electrochemical performance of it has not yet been reported. Li–Si alloy has various phase; Li1.00Si, Li1.71Si (Li12Si7), Li2.33Si (Li7Si3),
Li3.25Si (Li13Si4), Li3.75Si (Li15Si4) and Li4.40Si (Li22Si5). It is well–known that Li3.75Si is Li–rich phase
obtained electrochemically at room temperature.13,17 This is the Li–Si alloy phase without Si–Si bond; all Si atoms is surrounded by Li atoms.
In the present study, the crystalline LixSi alloy phase was synthesized by the MA method and
its electrochemical performance was investigated to elucidate the effect of mechanical pre–lithiation of Si. The pre–lithiation should induce a pre–volume–expansion of Si, which is expected to decrease the relative change in volume of Si during charge–discharge reactions and to suppress the cracking and pulverization of Si. The suppression should improve the electrochemical performance of the Si electrode, such as the cyclability and the Coulombic efficiency. We also discussed the electrochemical performance of LixSi electrode under the limitation of the cut–off potential and the charge capacity.
2. Experimental
LixSi (x = 1.00, 1.71, 2.33, 3.25, 4.40) powder was synthesized by means of a MA method.18
weight ratio of the sample to the balls was about 1:50 and dry Ar gas was filled inside the pod. Li chip was prepared by cutting Li sheet into small pieces (less than 2 mm x 2 mm in size) with scissor. MA was conducted using a high–energy planetary ball mill (P–6, Fritsh) for 20 h with a rotary speed of 380 rpm at room temperature. X–ray diffraction (XRD, Ultima IV, Rigaku) measurement was performed at a voltage of 40 kV and a current of 40 mA with Cu–Kα (λ = 1.5406 Å) radiation to verify the crystal structure of the powder. The Inorganic Crystal Structure Database (ICSD) was used to identify the obtained XRD patterns.
The working electrode was fabricated by gas deposition (GD) method in a vacuum chamber equipped with a guide tube.19 He gas (99.9999%) was used as a carrier gas. Other condition of GD was described in our previous paper.20 The weight of deposited active materials on Cu substrate was 42 ± 20 µg. A laboratory–made beaker type three–electrode cell was used for electrochemical measurements. Both the reference and counter electrodes consisted of Li metal sheets (Rare Metallic,
99.9%, thickness; 1 mm). All potentials in the text reflect V vs. Li+/Li. The electrolyte solution was 1 mol dm–3 (M) lithium perchlorate (LiClO4) in propylene carbonate (PC) (Kishida Chemical Co.,
Ltd.). The cell assembly was performed in an Ar–filled glovebox (Miwa MFG, DBO–2.5LNKP–TS) with a dew point below –100 oC and an oxygen content below 1 ppm. A galvanostatic charge– discharge test was carried out with an electrochemical measurement system (HJ1001SM8A, Hokuto Denko Co., Ltd. or BS2506, KEISOKUKI) in the potential range between 0.005 and 2.000 V unless otherwise stated. The current density and temperature for the test was set at 3.0 A g–1 and at 303 K, respectively. Cyclic volutammetry (CV) measurement was performed at a sweep rate of 1.0 mV s–1
using HZ–3000 (Hokuto Denko Co., Ltd.). The capacity in charge–discharge curve and cycle performance and the current density in cyclic voltammogram were described based on the weight and the surface area of initial deposited active materials (LixSi and Si), respectively.
3. Results and Discussion
Characterization of Synthesized LixSi Powder. ––– Figure 1 shows XRD patterns of synthesized
LixSi (x = 1.00, 1.71, 2.33, 3.25, 4.40) powders. The resulting patterns were good agreement with
each ICSD pattern of Li1.00Si, Li1.71Si, Li2.33Si, Li3.25Si, and Li4.40Si. In addition, there is no peak
assigned to raw material of Si. Therefore, it was confirmed that a single phase of crystalline Li1.00Si,
Li1.71Si, Li2.33Si, Li3.25Si, and Li4.40Si alloys was obtained. While it is reported that Li1.00Si phase is
formed at high pressures (1.0 – 2.5 GPa) and high temperatures (500 – 700oC),13,21 the Li1.00Si powder
was easily synthesized by a MA method. Once formed, this phase is stable at atmospheric pressure but decomposes into Li1.71Si and Si at 470 oC. Li4.40Si phase is most Li–rich phase and known to be
formed electrochemically at 415 oC.13 This phase was also obtained by the MA method.
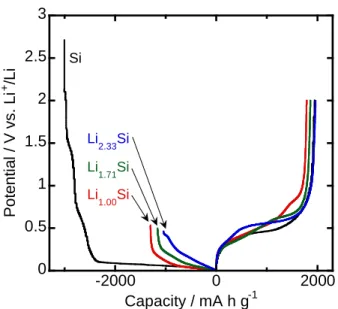
Electrochemical Behavior of LixSi Electrode. ––– Figure 2 shows the first charge–discharge
(lithiation–delithiation) curves of LixSi (x = 1.00, 1.71, 2.33) alloy electrodes in 1 M LiClO4/PC. For
comparison, the result of a Si–alone electrode is also shown in the same Figure. We did not show the electrochemical behavior of Li3.25Si and Li4.40Si phases because the phases rarely alloyed with Li any
discharge curves, respectively. The plateaus are attributed to the alloying and dealloying reactions of Si and Li.22 Each potential plateau of the LixSi electrodes was somewhat higher than that of the Si–
alone electrode. It is considered that the internal resistance of LixSi is lower than that of Si–alone
because the electrical resistivity of Li is very lower than that of Si. In addition, a crystallinity of LixSi
can associate with the potential plateau (discussed later). A charge capacity decreased with an increase in x value because Si had been pre–lithiated and the amount of Li required to form Li3.75Si
phase is lower compared to the Si–alone electrode. An open circuit voltage (OCV) also decreased with an increase in x, which indicates that chemical potential of Li increased in Si due to the pre– lithiation. On the other hand, the Coulombic efficiency increased with x, as shown in Table 1A. Because a discharge capacity was almost the same (ca. 2000 mA h g–1), a mechanically pre–doped Li would be released along with an electrochemically stored Li. LixSi electrodes exhibited two plateaus
on discharge curve at around 0.4 V and higher potentials.
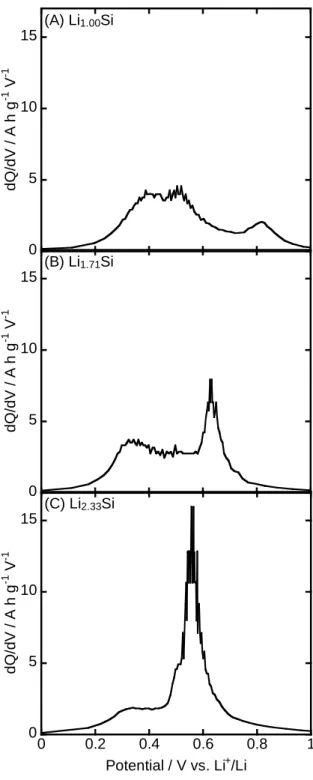
To clarify the difference in the potential of plateaus, differential capacity (dQ/dV) plots of LixSi electrodes for discharge capacity are shown in Figure 3. A peak at potentials between 0.5 and
0.8 V obviously increased with an increase in x, whereas peaks at potentials below 0.5 V decreased with it; the former and latter were assigned to delithiation of the mechanically pre–doped Li and the electrochemically stored Li, respectively. In the dQ/dV plot of Li1.71Si electrode at the second
discharge process (Figure S1), the two peaks were observed at potentials below 0.5 V. Because all of the mechanically pre–doped Li and the electrochemically stored Li is released during the first discharge process, the peaks are assigned to the release of Li stored electrochemically at the second
charge process. The two peaks indicates the following delithiation processes from the Li–Si alloy phases.3
c − . → − + + (1)
a − → − + + (2)
This peak separation below 0.5 V could be confirmed at the first discharge process when the electrochemically stored Li is relatively much (Figure 3A). The difference in these peak potentials was consistent with the results of CV, as shown in Figure S2. In the first cycle, the Si–alone electrode exhibited a sharp peak below 0.15 V assigned to an alloying reaction of c–Si with Li according to the following equations.4,23,24
− + + → a − (3)
a − + + → − . (4)
The Si electrode showed a cathodic peak at around 0.18 V in the second cycle, which results from the electrochemical lithiation of a–Si. On the other hand, LixSi (x = 1.00, 1.71, and 2.33) electrode
exhibited a shoulder peak at around 0.18 V even in the first cycle. Because there was no a–Si, it is considered that Li is stored in c–LixSi to form a–LiySi at about 0.18 V and in a–LiySi to form c–
Li3.75Si below 0.15 V. A peak of the LixSi (x = 1.00, 1.71, and 2.33) electrode at around 0.18 V in the
second cycle is assigned to the electrochemical lithiation of a–Si, as with the Si–alone electrode.
Figure S3 shows the cycle performance of LixSi (x = 1.00, 1.71, 2.33) and Si–alone electrodes. The
galvanostatic charge–discharge test was started from charging (lithiation). All LixSi electrodes
pre–lithiation on the cycle performance since the mechanically pre–doped Li was released during the first cycle.
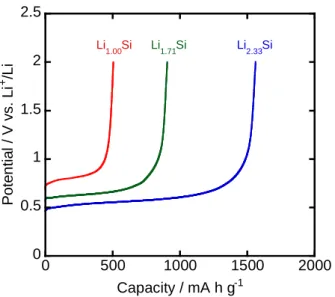
Figure 4 shows the first discharge curves of LixSi (x = 1.00, 1.71, and 2.33) electrodes in 1
M LiClO4/PC. The discharge test was carried out without the electrochemical lithiation process; Li
was not electrochemically stored. The discharge capacity increased with an increase in x, whereas an OCV decreased with it. The Comlombic efficiency of the electrochemically stored Li can be estimated by deducting discharge capacity in Figure 4 from that in Figure 2A, as shown in Table 1B. As the result, the Li1.00Si electrode exhibited about 100% of the Comlombic efficiency, whereas the
Coulombic efficiency decreased with an increase in x. Consequently, appropriate mechanical pre– lithiation should improve the Coulombic efficiency of the electrochemical lithiation–delithiation. Excess pre–lithiation should also decrease the efficiency.
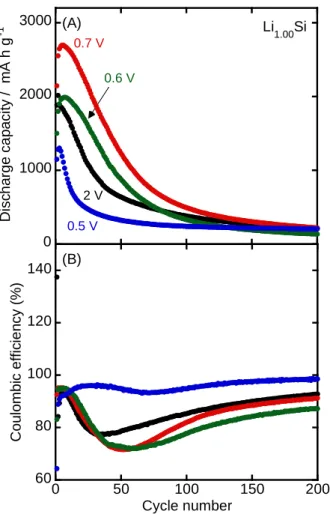
Cycle Performance of Li1.00Si Electrode under Limitation of Cut–Off Potential. ––– The cycle
performance is expected to improve due to suppression of change in volume of Si, when the mechanically pre–doped Li is kept in Si. Figures 5A and 5B shows the dependence of a discharge capacity and the Coulombic efficiency of Li1.00Si electrode on the cycle number with various
discharge cut–off potentials, respectively. The charge–discharge test was started from charging. While the Li1.00Si electrode showed a discharge capacity of ca. 380 mA h g–1 at the 50th cycle in
Figure S3, the electrode exhibited 1230 mA h g–1 under the discharge cut–off potential of 0.7 V at the
on the cut–off potentials. It is considered that the amount of the electrochemical lithiation and delithiation are too much to have a positive effect.
When the discharge cut–off potential was 0.7 V, the electrode showed ca. 93% of the first Coulombic efficiency. When the cut–off potential was 0.6 and 0.5 V, on the other hand, the efficiency was about 83 and 64%, respectively. It is considered that the discharge process stops before the electrochemically stored Li is completely extracted, leading a lower efficiency. A drop in the Coulombic efficiency of each cut–off potential was observed after the 10th cycle. It is widely accepted that a surface film forms through reductive decomposition of the electrolyte, and that the formation of this film is one of the reasons for a decrease in the Coulombic efficiency. The resulting surface film should collapse with the large volumetric changes in Si during charge–discharge reactions, followed by a surface film should form again on the newly formed Si surface, which results in the decrement in the efficiency. After the 10th cycle, however, the electrode maintained the highest efficiency over 93% under the discharge cut–off potential of 0.5 V. This efficiency is higher than that of the Si–alone electrode in the same electrolyte solution.25,26
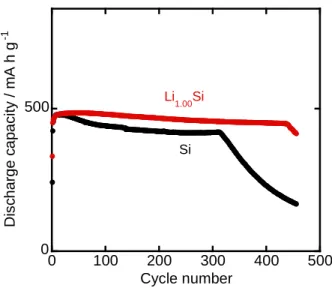
To suppress the amount of the electrochemical lithiation and delithiation in moderation, the charge capacity and the discharge cut–off potential were simultaneously limited. Figure 6 shows the cycle performance of Li1.00Si and Si–alone electrodes in 1 M LiClO4/PC at constant charge capacity
of 500 mA h g–1. Charge and discharge cut–off potentials were set at 0.005 and 0.7 V, respectively. The Li1.00Si and Si–alone electrodes maintained a discharge capacity of 500 mA h g–1 until the 440th
it is demonstrated that the Li1.00Si electrode reaches a superior electrochemical performance with
keeping the mechanically pre–doped Li and limiting the charge capacity.
4. Conclusion
The effect of pre–lithiation on the electrochemical performance of Si negative electrode in LIBs was investigated. Crystalline LixSi phases were synthesized by a MA method. When the
mechanically pre–doped Li was released from LixSi during the first cycle, the LixSi electrodes
exhibited the poor electrochemical performance not depending on x as with a Si–alone electrode. On the other hand, the moderate mechanical pre–lithiation improved the Coulombic efficiency and the excess pre–lithiation decreased the efficiency based on the calculation taking the discharge capacity derived from the mechanical pre–lithiation out of that derived from the mechanical and the electrochemical pre–lithiation. It was demonstrated that the Li1.00Si electrode exhibited the improved
cycle performance and higher Coulombic efficiency under the discharge cut–off potential of 0.7 and 0.5 V, respectively. In addition, the Li1.00Si electrode exhibited 1.5 times longer cycle life compared
to a Si–alone electrode under the constant charge capacity of 500 mA h g–1 and the discharge cut–off potential of 0.7 V. Consequently, the appropriate mechanical pre–lithiation helped to improve the poor electrochemical performance of the Si negative electrode.
Acknowledgements
References
1. B. Key, M. Morcrette, J.–M. Tarascon, and C. P. Grey, J. Am. Chem. Soc., 133, 503 (2011).
2. P. R. Abel, Y.–M. Lin, H. Celio, A. Heller, and C. B. Bullins, ACS Nano, 6, 2506 (2012).
3. B. Jerliu, E. Hüger, L. Dörrer, B.–K. Seidlhofer, R. Steitz, V. Oberst, U. Geckle, M. Bruns, and H. Schmidt, J. Phys. Chem. C, 118, 9395 (2014).
4. M. N. Obrovac, and L. J. Krause, J. Electrochem. Soc., 154, A103 (2007).
5. Y. Domi, H. Usui, Y. Takemoto, K. Yamauchi, and H. Sakaguchi, J. Phys. Chem. C, 120, 16333 (2016).
6. J. Ryu, D. Hong, M. Shin, and S. Park, ACS Nano, 10, 10589 (2016).
7. Z. Wen, G. Wang, S. Li, S. Ji, and J. Sun, Int. J. Electrochem. Sci., 10, 10336 (2015).
8. T. Okubo, M. Saito, C. Yodoya, A. Kamei, M. Hirota, T. Takenaka, T. Okumura, A. Tasaka, and M. Inaba, Solid State Ionics, 262, 39 (2014).
9. M. Hagan, E. Quiroga–González, S. Dörfler, G. Fahrer, J. Tübke, M. J. Hoffmann, H. Althues, R. Speck, M. Krampfert, S. Kaskel, and H. Föll, J. Power Sources, 248, 1058 (2014).
10. N. Liu, L. Hu, M. T. Mactthew, A. Jackson, and Y. Cui, ACS Nano, 5, 6487 (2011).
11. K. Doi, S. Hino, H. Miyaoka, T. Ichikawa, and Y. Kojima, J. Power Sources, 196, 504 (2011).
13. V. L. Chevrier, J. W. Zwanziger, and J. R. Dahn, J. Alloys Compd., 496, 25 (2010).
14. H. Kim, C.–Y. Chou, J. G. Ekerdt, and G. S. Hwang, J. Phys. Chem. C, 115, 2514 (2011).
15. C.–Y. Chou, H. Kim, and G. S. Hwang, J. Phys. Chem. C, 115, 20018 (2011).
16. V. B. Shenoy, P. Johari, and Y. Qi, J. Power Sources, 195, 6825 (2010).
17. B. Key, R. Bhattacharyya, M. Morcrette, V. Seznéc, J.–M. Tarascon, and C. P. Grey, J. Am. Chem.
Soc., 131, 9239 (2009).
18. H. Sakaguchi, T. Iida, M. Itoh, N. Shibamura and T. Hirano, IOP Conf. Ser.: Mater. Sci. Eng., 1, 012030 (2009).
19. H. Usui, Y. Kiri, and H. Sakaguchi, Thin Solid Films, 520, 7006 (2012).
20. Y. Domi, H. Usui, H. Itoh, and H. Sakaguchi, J. Alloys Compd., 695, 2035 (2017).
21. L. A. Stearns, J. Gryko, J. Diefenbacher, G. K. Ramachandran, and P. F. McMillan, J. Solid State
Chem., 173, 251 (2003).
22. Y.–M. Kang, S.–M. Lee, S.–J. Kim, G.–J. Jeong, M.–S. Sung, W.–U. Choi, and S.–S. Kim,
Electrochem. Commun., 9, 959 (2007).
23. T. D. hatchard and J. R. Dahn, J. Electrochem. Soc., 151, A838 (2004).
Figure captions
Figure 1 XRD patterns of LixSi powders (x =1.00, 1.71, 2.33, 3.25, 4.40).
Figure 2 (A) First charge–discharge curves of Li1.00Si, Li1.71Si, Li2.33Si, and Si electrodes in 1 M
LiClO4/PC at a constant current density of 3.0 A g–1.
Figure 3 dQ/dV plot at the first discharge capacity side of (a) Li1.00Si, (b) Li1.71Si, and (c) Li2.33Si
electrodes.
Figure 4 First discharge profiles of Li1.00Si, Li1.71Si, and Li2.33Si electrodes in 1 M LiClO4/PC at a
constant current density of 3.0 A g–1.
Figure 5 Dependence of (A) discharge capacity and (B) Coulombic efficiency of Li1.00Si electrode
Figure 6 Cycle performance of Li1.00Si and Si electrodes in 1 M LiClO4/PC at a current density of 3.0
A g-1. Charge capacity was limited at 500 mA h g-1, and charge and discharge cut–off potentials were set at 0.005 and 0.7 V vs. Li+/Li, respectively.
Table 1 Coulombic efficiency of various LixSi (x = 1.00, 1.71, 2.33) electrodes (A) estimated by
charge and discharge capacities in Fig. 2A and (B) obtained by dividing deducted discharge capacity by charge capacity in Fig. 2A. The deducted capacity was calculated by taking discharge capacity in Fig. 4 out of that in Fig. 2A
35 40 45 50 55 In te n s it y / a .u . 2θ (Cu-Kα)/deg. Li1.71Si: 00-040-0942 Li2.33Si: 01-089-0005 Si :00-027-1402 Li1.00Si: 00-040-0942 Li3.25Si: 03-065-1337 Li4.4Si: 01-073-2049 ● ◆ ▲ ■ ▼ ▼ ▼ ▼ ▼ ▼ ▼ ■ ■ ● ● ● ● ● ◆ ◆ ◆ ▲ ▲ ▲ x = 4.40 x = 3.25 x = 2.33 x = 1.71 x = 1.00
0 0.5 1 1.5 2 2.5 3 -2000 0 2000 P o te n ti a l / V v s . L i + /L i Capacity / mA h g-1 Si Li 2.33Si Li 1.71Si Li 1.00Si
Figure 2 (A) First charge–discharge curves of Li1.00Si, Li1.71Si, Li2.33Si, and Si electrodes in 1 M
Figure 3 dQ/dV plot at the first discharge capacity side of (a) Li1.00Si, (b) Li1.71Si, and (c) Li2.33Si electrodes. 0 5 10 15 (A) Li1.00Si d Q /d V / A h g -1 V -1 0 5 10 15 d Q /d V / A h g -1 V -1 (B) Li1.71Si 0 5 10 15 0 0.2 0.4 0.6 0.8 1 Potential / V vs. Li+/Li (C) Li2.33Si d Q /d V / A h g -1 V -1
0 0.5 1 1.5 2 2.5 0 500 1000 1500 2000 Li 1.00Si Li1.71Si Li2.33Si P o te n tia l / V v s . L i + /L i Capacity / mA h g-1
Figure 4 First discharge profiles of Li1.00Si, Li1.71Si, and Li2.33Si electrodes in 1 M LiClO4/PC at a
Figure 5 Dependence of (A) discharge capacity and (B) Coulombic efficiency of Li1.00Si electrode
with various cut–off potentials.
0 1000 2000 3000 D is c h a rg e c a p a c it y / m A h g -1 0.7 V 0.6 V 2 V 0.5 V Li1.00Si (A) 60 80 100 120 140 0 50 100 150 200 C o u lo m b ic e ffi c ie n c y ( % ) Cycle number (B)
0 500 0 100 200 300 400 500 D is c h a rg e c a p a c it y / m A h g -1 Cycle number Si Li 1.00Si
Figure 6 Cycle performance of Li1.00Si and Si electrodes in 1 M LiClO4/PC at a current density of 3.0
A g-1. Charge capacity was limited at 500 mA h g-1, and charge and discharge cut–off potentials were set at 0.005 and 0.7 V vs. Li+/Li, respectively.
Table 1 Coulombic efficiency of various LixSi (x = 1.00, 1.71, 2.33) electrodes (A) estimated by
charge and discharge capacities in Fig. 2A and (B) obtained by dividing deducted discharge capacity by charge capacity in Fig. 2A. The deducted capacity was calculated by taking discharge capacity in Fig. 4 out of that in Fig. 2A
(A) (B)
Li1.00Si 137% 98%
Li1.71Si 160% 92%