Effects of Cholestyramine and Phytosterol
on Cholesterol Metabolism in the
Starvation-refeeding Rats*
Reiko INAI* and Tatsuhiro MATSUOAbstract
The present study investigated the effects of cholestyramine and phytosterol on cholesterol metabolism in the starvation-refeeding rats. Twenty female Donryu rats (age 5 weeks) were fed a cholesterol-free diet for 14 days and then divided into four groups, a control (Con), high-cholesterol (Chol), Chol-cholestyramine (Chol-Cm), and Cm (Experiment 1) or Chol-phytosterol (Chol-PS) (Experiment 2) diet group. All groups were fasted for 2 days
fol-lowed by 3 days feeding. Food intake, final body weight and liver weight were not different among the four groups. The plasma total cholesterol, free cholesterol, cholesteryl ester, and non HDL-cholesterol concentrations were signifi-cantly higher and plasma HDL-cholesterol concentration was signifisignifi-cantly lower in the Chol group than in the other groups. Dietary cholestyramine inhibited the change in the plasma cholesterol concentrations induced by a high-cho-lesterol diet (Experiment 1). However, no effect on the plasma chohigh-cho-lesterol concentrations by dietary phytosterol was found (Experiment 2). Dietary cholestyramine and phytosterol significantly inhibited liver cholesterol accumulation but the inhibitory effect of phytosterol was lower than that of cholestyramine. These results suggest that the dietary cholestyramine and phytoseterol affected cholesterol metabolism in rats fed a high-cholesterol diet under starvation-refeeding status.
Key words : cholestyramine, phytosterol, cholesterol, starvation-refeeding, rat
INTRODUCTION
Starvation has been recognized to reduce the activities of hepatic enzymes in animals(1-7). Some of the largest decreases
in activity occur with the nicotinamide adenine dinucleotide phosphate (NADP)-linked dehydrogenases of the cytosol(3)
and organelles(1, 5). However, it is well established that
starva-tion followed by refeeding (starvastarva-tion-refeeding) causes an increase in rat liver lipogenic enzyme activity in comparison to the levels obtained with the same diet fed ad libitum. Sz-epesi and Berdanier(8)reported that the response to a 2-day
period of starvation followed by a 2-day period of refeeding typically include an increase in liver lipid content and an in-crease or overshoot in the activities of the hepatic enzymes concerned with lipogenesis. Moreover, Wurdeman et al. (9)
and Berdanier and Shubeck(10)demonstrated that
glucocor-ticoid and insulin are involved in the genesis of the enzyme overshoot response to starvation-refeeding, perhaps through an effect on de novo RNA synthesis. Cholesterol, one of the
physiologically significant lipids along with triacylglycerol (TG) or fatty acids, is present in tissues and plasma
lipopro-tein either as free cholesterol, or in combination with long-chain fatty acids as cholesteryl ester(11). It is synthesized in
many tissues from acetyl-CoA and is ultimately eliminated from the body in the bile as cholesterol or bile salts. Choles-terol is the precursor of all other steroids in the body such as glucocorticoid and sex hormones(11). We previously confirmed
that cholesterol synthesis in the liver was accelerated under the activated condition of hepatic lipogenesis because the en-zymes related to cholesterol synthesis occur with the NADP-linked dehydrogenases (data not shown).
Cholestyramine, a resin which strongly binds bile acids, is used as a hypolipidemic drug. It is considered to lower serum cholesterol levels by inhibiting the enterohepatic circulation of bile acids(12). Phytosterols are cholesterol-like compounds
that occur naturally in plant foods and reduce cholesterol ab-sorption(13). In the present study, we investigated the effect of
cholestyramine and phytosterol on cholesterol metabolism in
the starvation-refeeding rats.
Materials and Methods
All procedures involving the rats were approved by the Ex-perimental Animal Care Committee of Kagawa University. Experiment 1
Animals, diets, and experimental design
Twenty female Donryu rats (age 5 weeks) were purchased from Japan SLC, Inc. (Shizuoka, Japan). All rats were housed individually at 22 ± 1 ℃ with light from 08:00 to 20:00 h and free access to water. The rats were fed CE-2, a commercial ro-dent diet (CLEA, Tokyo, Japan) ad libitum until 6 weeks of age. The rats were fed synthetic high-fat diets (Table 1). This diet also contained per kilogram: retinyl palmitate, 60,000IU; ergocalciferol, 600IU; α-tocopheryl acetate, 1 gram. The vi-tamin and mineral mixtures based on Harper’s mixture were used(14). After a 14 day feeding period, the rats were divided
into four groups, a control (Con), high-cholesterol (Chol), cholestyramine (Cm), and high-cholesterol and cholestyr-amine (Chol-Cm) diet groups. All groups were fasted for 2 days followed by 3 days refeeding. After the starvation-refeeding period, the rats were killed by heart puncturing un-der anesthesia. Blood was collected to obtain plasma, and the liver was quickly removed, weighed, and stored at -40℃.
Analysis
The plasma total cholesterol, free cholesterol, HDL choles-terol and TG concentrations were determined using kits (Cho-lesterol E-Test, Free Cho(Cho-lesterol E-Test, HDL-Cho(Cho-lesterol E-Test and Triglyceride E-Test, Wako Pure Chemical Indus-tries, Osaka, Japan). The plasma cholesteryl ester concentra-tion was calculated from the plasma total cholesterol and free cholesterol concentrations. Total liver lipid and plasma lipid were extracted by the method of Folch et al.(15). The liver
total cholesterol, free cholesterol and cholesteryl ester con-tents were determined by the method previously(16, 17). Plasma
cholesteryl ester was divided using a thin-layer chromatog-raphy technique(18). The fatty acid composition of plasma
cholesteryl ester was determined using gas chromatography. The TG extract liquid was vaporized by nitrogen gas and then transmethylated using methanol-sulfuric acid (230:2, v/v). The fatty acid methyl esters were extracted with hexane and separated in a gas chromatograph (ModelG-163, Hitachi Co., Tokyo, Japan) equipped with a 3 mm x 2 m glass column which filled up packing material (EGSS-Y, Shinwa Chemical Industries, Ltd., Tokyo, Japan). The column temperature was set at 187℃. The carrier gas was helium at a flow rate of 40 ml・min-1. Methyl esters of individual fatty acids were identi-fied in the chromatograms by comparing their retention times to those of pure methyl esters, and were quantified by compar-ing the areas under their peaks.
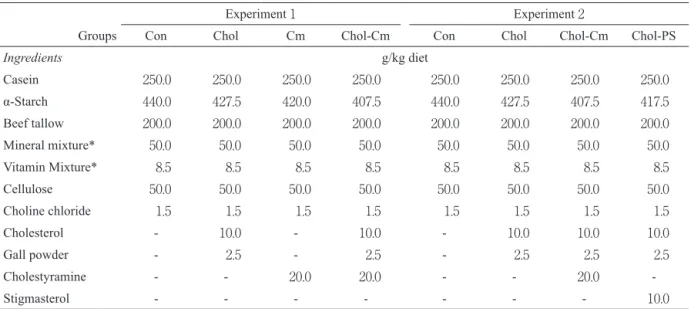
Table 1 Composition of experimental diets.
Experiment 1 Experiment 2
Groups Con Chol Cm Chol-Cm Con Chol Chol-Cm Chol-PS
Ingredients g/kg diet Casein 250.0 250.0 250.0 250.0 250.0 250.0 250.0 250.0 α-Starch 440.0 427.5 420.0 407.5 440.0 427.5 407.5 417.5 Beef tallow 200.0 200.0 200.0 200.0 200.0 200.0 200.0 200.0 Mineral mixture* 50.0 50.0 50.0 50.0 50.0 50.0 50.0 50.0 Vitamin Mixture* 8.5 8.5 8.5 8.5 8.5 8.5 8.5 8.5 Cellulose 50.0 50.0 50.0 50.0 50.0 50.0 50.0 50.0 Choline chloride 1.5 1.5 1.5 1.5 1.5 1.5 1.5 1.5 Cholesterol - 10.0 - 10.0 - 10.0 10.0 10.0 Gall powder - 2.5 - 2.5 - 2.5 2.5 2.5 Cholestyramine - - 20.0 20.0 - - 20.0 -Stigmasterol - - - 10.0
These diets contained per kilogram: retinyl palmitate, 60,000IU; ergocalciferol, 600IU; α-tocopheryl acetate, 1 gram. Con, Control; Chol, Cholesterol; Cm, Cholestyramine; PS, Phytosterol. *Harper’s mixture.
Experiment 2
Animals, diets, and experimental design
Twenty female Donryu rats (age 5 weeks) were purchased from Japan SLC, Inc. (Shizuoka, Japan). All rats were housed individually at 22 ± 1 ℃ with light from 08:00 to 20:00 h and free access to water. The rats were fed CE-2, a commercial ro-dent diet (CLEA, Tokyo, Japan) ad libitum until 6 weeks of age. The rats were fed synthetic high fat diets (Table 1). This diet also contained per kilogram: retinyl palmitate, 60,000IU; ergocalciferol, 600IU; α-tocopheryl acetate, 1 gram. The vi-tamin and mineral mixtures based on Harper’s mixture were used(15). After a 14 day of feeding period, the rats were
divid-ed into four groups, a control (Con), high-cholesterol (Chol), high-cholesterol and cholestyramine (Chol-Cm), high-cho-lesterol and phytosterol (Chol-PS) diet diets. All groups were then fasted for 2 days followed by 3 days feeding. After the starvation-refeeding period, the rats were killed by heart punc-turing under anesthesia. Blood was collected to obtain plasma, and liver was quickly removed, weighed, and stored at -40℃. Analysis
The plasma substrates, liver lipids and fatty acid composi-tion of plasma cholesteryl ester were assayed as in Experiment 1.
Statistical analysis
The values are expressed as means ± standard deviation (SD). Data were evaluated by one-way ANOVA and Turkey’s test was used to determine specific mean differences. A p
val-ue of < 0.05 was considered statistically significant. All analy-ses were performed with a commercially available statistical package (Excel Statistics, SSRI Co., Ltd., Tokyo, Japan).
Results and Discussion
Experiment 1
Food intake, body weight and liver weights
Food intake, final body weight and liver weight were not different among the four groups (mean values: food intake, 17 g; final body weight 204 g; liver weight, 10 g [all dietary groups].
Plasma substrates and liver lipids
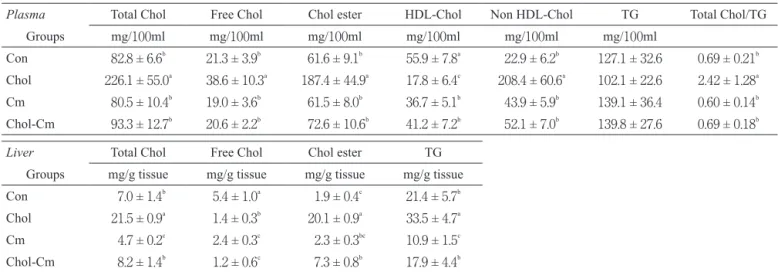
Table 2 shows the concentrations of plasma cholesterol and TG and the content of liver lipids. The plasma total choles-terol, free cholescholes-terol, cholesteryl ester, non HDL-cholesterol concentrations, and total cholesterol/TG ratio were signifi-cantly higher and the plasma HDL-cholesterol concentration was significantly lower in the Chol group than in the Con, Cm, and Chol-Cm groups. Dietary cholestyramine inhibited the changes in the plasma cholesterol concentrations induced by a high-cholesterol diet. The plasma TG concentration was not different among the four groups.
The liver total cholesterol, cholesteryl ester and TG content were significantly higher and the liver free cholesterol content was significantly lower in the Chol group than in the other groups. Dietary cholestyramine inhibited the accumulation of liver cholesterol and TG induced by high-cholesterol diet. Table 2 Effect of dietary cholesterol and cholestyramine on plasma and liver components in rats under starvation-refeeding status
(Experiment 1).
Plasma Total Chol Free Chol Chol ester HDL-Chol Non HDL-Chol TG Total Chol/TG
Groups mg/100ml mg/100ml mg/100ml mg/100ml mg/100ml mg/100ml
Con 82.8 ± 6.6b 21.3 ± 3.9b 61.6 ± 9.1b 55.9 ± 7.8a 22.9 ± 6.2b 127.1 ± 32.6 0.69 ± 0.21b
Chol 226.1 ± 55.0a 38.6 ± 10.3a 187.4 ± 44.9a 17.8 ± 6.4c 208.4 ± 60.6a 102.1 ± 22.6 2.42 ± 1.28a
Cm 80.5 ± 10.4b 19.0 ± 3.6b 61.5 ± 8.0b 36.7 ± 5.1b 43.9 ± 5.9b 139.1 ± 36.4 0.60 ± 0.14b
Chol-Cm 93.3 ± 12.7b 20.6 ± 2.2b 72.6 ± 10.6b 41.2 ± 7.2b 52.1 ± 7.0b 139.8 ± 27.6 0.69 ± 0.18b
Liver Total Chol Free Chol Chol ester TG
Groups mg/g tissue mg/g tissue mg/g tissue mg/g tissue Con 7.0 ± 1.4b 5.4 ± 1.0a 1.9 ± 0.4c 21.4 ± 5.7b
Chol 21.5 ± 0.9a 1.4 ± 0.3b 20.1 ± 0.9a 33.5 ± 4.7a
Cm 4.7 ± 0.2c 2.4 ± 0.3c 2.3 ± 0.3bc 10.9 ± 1.5c
Chol-Cm 8.2 ± 1.4b 1.2 ± 0.6c 7.3 ± 0.8b 17.9 ± 4.4b
Values are means ± SD for 5 rats. Means with different superscripts within a column are significantly different at p<0.05. Con, Control; Chol, Cholesterol; Cm, Cholestyramine; TG, triacylglycerol.
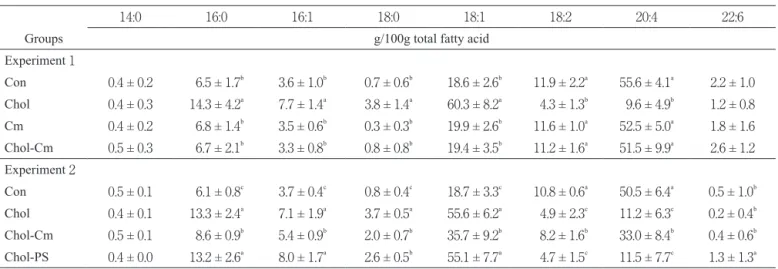
Fatty acid composition of plasma cholesteryl ester Table 4 shows the fatty acid composition of plasma chles-teryl ester. The percentage of palmitic, palmitoleic, stearic, and oleic acids were significantly higher whereas linoleic and arachidonic acids were significantly lower in the Chol group than in the other groups. Dietary cholestyramine inhibited the changes in the percentage of fatty acids in plasma chlesteryl ester induced by a high-cholesterol diet.
Experiment 2
Food intake, body weight and liver weights
Food intake, final body weight and liver weight were not different among the four groups (mean values: food intake, 16 g; final body weight 211 g; liver weight, 11 g [all dietary groups].
Plasma substrates and liver lipids
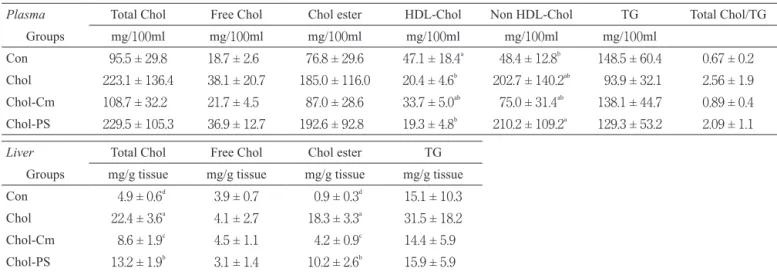
Table 3 shows the concentrations of plasma cholesterol and TG and the content of liver lipids. The plasma total choles-terol, free cholescholes-terol, cholesteryl ester, and non HDL-choles-terol concentrations were significantly higher and the plasma HDL-cholesterol concentration was significantly lower in the Chol group than in the Con group. Dietary cholestyramine inhibited the changes in the plasma cholesterol concentrations induced by high-cholesterol diet. However, no effect by di-etary phytosterol was found.
The liver total cholesterol and cholesteryl ester content were significantly higher and the liver free cholesterol content was significantly lower in the Chol group than in the Con
group. Dietary cholestyramine inhibited the accumulation of liver cholesterol induced by a high-cholesterol diet. Dietary phytosterol significantly inhibited liver cholesterol accumula-tion but the inhibitory effect of phytosterol was lower than that of cholestyramine.
Fatty acid composition of plasma cholesteryl ester Table 4 shows the fatty acid composition of plasma chles-teryl ester. The percentage of palmitoleic, palmitoleic, stearic, and oleic acids were significantly higher whereas those of linoleic and arachidonic acids were significantly lower in the Chol group than in the Con and Cm groups. Dietary cholestyr-amine inhibited the changes in the percentage of fatty acids in plasma chlesteryl ester induced by a high-cholesterol diet. Many researchers reported that cholestyramine and phy-tosterol in experiments on animals(19-22)and humans(23, 24).
Both cholestyramine and phytosterol exhibited a hypocholes-terolemic effect, and increased the fecal excretion of sterols. In the present study, we found that 1% cholestyramine in the diet dramatically decreased the plasma total and non-HDL cholesterol concentrations and increased HDL-cholesterol concentration in rats fed a high-cholesterol diet, results which support those previous findings.
In Experiment 2, however, phytosterol did not have a very strong cholesterol-lowering effect in rats a fed high-choles-terol diet. Ling and Jones(23)suggested that phytosterol (1%
sitosterol) effectively modify circulating lipoprotein choles-terol concentrations at the level of the intestine, rather than in-ternally at the level of chlesterogenesis in rats. Chien et al.(21)
Table 3 Effect of dietary fats and cholestyramine on plasma and liver components in rats under starvation-refeeding status (Ex-periment 2).
Plasma Total Chol Free Chol Chol ester HDL-Chol Non HDL-Chol TG Total Chol/TG
Groups mg/100ml mg/100ml mg/100ml mg/100ml mg/100ml mg/100ml
Con 95.5 ± 29.8 18.7 ± 2.6 76.8 ± 29.6 47.1 ± 18.4a 48.4 ± 12.8b 148.5 ± 60.4 0.67 ± 0.2
Chol 223.1 ± 136.4 38.1 ± 20.7 185.0 ± 116.0 20.4 ± 4.6b 202.7 ± 140.2ab 93.9 ± 32.1 2.56 ± 1.9
Chol-Cm 108.7 ± 32.2 21.7 ± 4.5 87.0 ± 28.6 33.7 ± 5.0ab 75.0 ± 31.4ab 138.1 ± 44.7 0.89 ± 0.4
Chol-PS 229.5 ± 105.3 36.9 ± 12.7 192.6 ± 92.8 19.3 ± 4.8b 210.2 ± 109.2a 129.3 ± 53.2 2.09 ± 1.1
Liver Total Chol Free Chol Chol ester TG
Groups mg/g tissue mg/g tissue mg/g tissue mg/g tissue Con 4.9 ± 0.6d 3.9 ± 0.7 0.9 ± 0.3d 15.1 ± 10.3
Chol 22.4 ± 3.6a 4.1 ± 2.7 18.3 ± 3.3a 31.5 ± 18.2
Chol-Cm 8.6 ± 1.9c 4.5 ± 1.1 4.2 ± 0.9c 14.4 ± 5.9
Chol-PS 13.2 ± 1.9b 3.1 ± 1.4 10.2 ± 2.6b 15.9 ± 5.9
Values are means ± SD for 5 rats. Means with different superscripts within a column are significantly different at p<0.05. Con, Control; Chol, Cholesterol; Cm, Cholestyramine; PS, Phytosterol; TG, triacylglycerol.
Table 4 Fatty acid composition of plasma cholesteryl ester in rats under starvation-refeeding status (Experiments 1 and 2).
14:0 16:0 16:1 18:0 18:1 18:2 20:4 22:6
Groups g/100g total fatty acid
Experiment 1 Con 0.4 ± 0.2 6.5 ± 1.7b 3.6 ± 1.0b 0.7 ± 0.6b 18.6 ± 2.6b 11.9 ± 2.2a 55.6 ± 4.1a 2.2 ± 1.0 Chol 0.4 ± 0.3 14.3 ± 4.2a 7.7 ± 1.4a 3.8 ± 1.4a 60.3 ± 8.2a 4.3 ± 1.3b 9.6 ± 4.9b 1.2 ± 0.8 Cm 0.4 ± 0.2 6.8 ± 1.4b 3.5 ± 0.6b 0.3 ± 0.3b 19.9 ± 2.6b 11.6 ± 1.0a 52.5 ± 5.0a 1.8 ± 1.6 Chol-Cm 0.5 ± 0.3 6.7 ± 2.1b 3.3 ± 0.8b 0.8 ± 0.8b 19.4 ± 3.5b 11.2 ± 1.6a 51.5 ± 9.9a 2.6 ± 1.2 Experiment 2 Con 0.5 ± 0.1 6.1 ± 0.8c 3.7 ± 0.4c 0.8 ± 0.4c 18.7 ± 3.3c 10.8 ± 0.6a 50.5 ± 6.4a 0.5 ± 1.0b Chol 0.4 ± 0.1 13.3 ± 2.4a 7.1 ± 1.9a 3.7 ± 0.5a 55.6 ± 6.2a 4.9 ± 2.3c 11.2 ± 6.3c 0.2 ± 0.4b Chol-Cm 0.5 ± 0.1 8.6 ± 0.9b 5.4 ± 0.9b 2.0 ± 0.7b 35.7 ± 9.2b 8.2 ± 1.6b 33.0 ± 8.4b 0.4 ± 0.6b Chol-PS 0.4 ± 0.0 13.2 ± 2.6a 8.0 ± 1.7a 2.6 ± 0.5b 55.1 ± 7.7a 4.7 ± 1.5c 11.5 ± 7.7c 1.3 ± 1.3a
Values are means ± SD for 5 rats. Means with different superscripts within a column are significantly different at p<0.05. Con, Control; Chol, Cholesterol; Cm, Cholestyramine; PS, Phytosterol.
demonstrated that phytosterol-containing lactic-fermented milk powder (0.74-1.85% phytosterol) could be used as a potential cholesterol-lowering ingredient in the management of hypercholesterolemia in hamsters. The differences between our results and previous findings might be due to differences in experimental design or the nutritional status of the rats. The previous findings demonstrated that diets supplemented with cholestyramine or phytosterol significantly increased the fecal cholesterol concentration, and the increase was propor-tional to the supplemental contents of the diets(20, 22). In the
present study (Experiment 2), fecal dry weight was higher in the Chol-Cm and Chol-PS group than in the Chol group (4.2 ± 0.8, 2.4 ± 0.7 vs. 1.7 ± 0.5 g/2 days). Fecal cholesterol
excre-tion was higher in the Chol-Cm and Chol-PS group than in the Chol group (data not shown). It has been reported that the net effect of dietary cholesterol absorption, endogenous choles-terol synthesis and biliary cholescholes-terol excretion regulates body cholesterol balance(25, 26). The cholesterol-lowering effect of
diets containing cholestyramine and phytosterol might be due to the inhibition of intestinal dietary cholesterol absorption, but also to the interference of biliary cholesterol re-absorption. The results of the present study suggest that the dietary cho-lestyramine and phytosterol affected cholesterol metabolism in starved-refed rats fed a high cholesterol diet, but a further detailed study is needed to confirm and clarify this mecha-nism.
References
1. SICULELLA, L., SABETTA, S., di SUMMA, R., LEO, M., G I-UDETTI, A.M., PALMIERI, F., and GNONI, G.V.
Starvation-induced posttranscriptional control of rat liver mitochon-drial citrate carrier expression. Biochem. Biophys. Res.
Commun., 299, 418-423 (2002).
2. BARROSO, J.B., PERAGÓN, J., CONTRERAS-JURADO, C.,
GARCÍA-SALGUERO, L., CORPAS, F.J., ESTEBAN, F.J., P EI-NADO, M.A., De La HIGUERA, M., and LUPIÁÑEZ, J.A.
Impact of starvation-refeeding on kinetics and protein expression of trout liver NADPH-production systems.
Am. J. Physiol., 274, R1578-R1587 (1998).
3. FREEDLAND, R.A. Effect of progressive starvation on rat
liver enzyme activities. J. Nutr., 91, 489-495 (1967). 4. GUDERLEY, H.G., LAPOINTE, D., BEDARD, M., and DUTIL,
J. Metabolic priorities during starvation: enzyme sparing in liver and white muscle of Atlantic cod, Gadus morhua L. Comp. Biochem. Physiol., 135, 347-356 (2003). 5. AWAD, S., CONSTANTIN-TEODOSIU, D., MACDONALD, I.A.,
and LOBO, D.N. Short-term starvation and mitochondrial
dysfunction – A possible mechanism leading to postoper-ative insulin resistance. Clin. Nutr., 28, 497-509 (2009). 6. LONGO, V., INGELMAN-SUNDBERG, M., AMATO, G., S
AL-VETTI, A., and GERVASI, P.G. Effect of starvation and
chlormethiazole on cytochrome P450s of rat nasal mu-cosa. Biochem. Pharmacol., 59, 1425-1432 (2000). 7. SCHIMKE, R.T. Differential effect of fasting and
protein-free diets on levels of urea cycle enzymes in rat liver. J.
8. SZEPSI, B., and BENDER, C.D. Time course of the
starve-refeed response in rats; the possible role of insulin. J.
Nutr., 101, 1563-1574 (1971).
9. WURDEMAN, R., BERDANIER, C.D., and TOBIN, R.B.
En-zyme overshoot in starved-refed rats: role of the adrenal glucocorticoid. J. Nutr., 108, 1457-1461 (1978). 10. BERDANIER, C.D., and SHUBECK, D. Interaction of
glu-cocorticoid and insulin in the responses of rats to starva-tion-refeeding. J. Nutr., 109, 1766-1771 (1979). 11. ROTHBLAT, G.H., and KRITCHEVSKY, D. The metabolism
of free and esterifiedcholesterol in tissue culture cells: A review. Exp. Mol. Pathol., 8, 314-329 (1968).
12. SHIBATA, S., HAYAKAWA, K., EGASHIRA, Y., and SANADA,
H. Role of nuclear receptors in the upregulation of he-patic cholesterol 7 α-hydroxylase by cholestyramine in rats. Life Sci., 80, 546-553 (2007).
13. NESTEL, P, CEHUM, M., POMEROY, S., ABBEY, M., and
WELDON, G. Cholesterol-lowering effects of plant sterol
esters and non-esterified stanols in margarine, butter and low-fat foods. Eur. J. Clin. Nutr., 55, 1084-1090 (2001). 14. ROGERS, Q.R., and HARPER, A.E. Amino acid diets and
maximal growth in the rat. J. Nutr., 87, 267-273 (1965). 15. FOLCH, J., LEES, M., and SLOANE-STANDLEY, G.H. A
simple method for the isolation and purification of total lipids from animal tissues. J. Biol. Chem., 226, 497-509 (1957).
16. ZAK, B. Simple rapid microtechnic for serum total
cho-lesterol. Am. J. Clin. Pathol., 27, 583-588 (1957). 17. CHAM, B.E., HURWOOD, J.J., KNOWLES, B.R., and
POW-ELL, L.W. Rapid, sensitive method for the separation of
free cholesterol from ester cholesterol. Clin. Chim. Acta., 49, 109-113 (1973).
18. ALLING, C., SVENNERHOLM, L., and TICHY, J. Fatty acid
composition of serum cholesteryl ester fractions is iso-lated by thin-layer chromatography. J. Chromatogr., 34, 413-415 (1968).
19. MAROUNEK, M., VOLEK, Z.,SKRIVANOVA, E., and TUMA,
L. Effects of amidated pectin alone and combined with cholestyramine on cholesterol homeostasis in rats fed a cholesterol-containing diet. Carbohyd. Res., 80, 989-992 (2010).
20. MATSUMOTO, K., and YOKOYAMA, S., Gene expression
analysis on the liver of cholestyramine-treated type 2 dia-betic model mice. Biomed. Pharm., 64, 373-378 (2010). 21. CHIEN, Y., WU, L., LEE, T., and HWANG, L.
Cholesterol-lowering effect of phytosterol-containing lactic fermented mill powder in hamsters. Food Chem., 119, 1121-1126 (2010).
22. LING W.H., JONES, P.J.H. Enhanced efficacy of
sitostanol-containing versus sitostanol-free phytosterol mixtures in altering lipoprotein cholesterol levels and synthesis in rats. Atherosclerosis, 118, 319-331 (1995).
23. ANDREWS, T.C., WHITNEY, E.J., GREEN, G., KALENIAN,
R., and PERSONIUS, B.E. Effect of gemfibrozil ± niacin ±
cholestyramine on endothelial function in patients with serum low-density lipoprotein cholesterol levels < 160 mg/dl and high-density lipoprotein cholesterol levels < 40 mg/dl. Am. J. Cardiol., 80, 831-835 (1997).
24. LIN, X., MA, L., RACETTE, S.B., SPEARIE, C.L.A., and O S-TLUND, R.E. Phytosterol glycosides reduce cholesterol