page range
56-74
Model Experiments on the Physical
Characteristics of the Thai Shrimp
Trawl Gear
Sophon RUANGPAN* and Takehiko IMAI"
Abstract
This study was carried out in order to obtain some fundamental information on the physical characteristics of the balloon type single rigged Thai shrimp trawl gear in
a circular tank. The reduced scale model net was constructed on Dr. Tauti's compar
ative method.
Observations and measurements were made simultaneously on the shape and resist ance of the net under the influence of six stages of flow velocity. For convenience of discussion, all empirical values from the reduced scale model have been converted
into full scale values.
The results obtained in this study are summarized as follows :
1) Five parameters i.e. net mouth height (H), wing tip distance (W), sweeping area (Sa), projective area of net mouth (An) and water filtering volume (Fv) were taken into account to determine the physical characteristics of the gear.
The above mentioned parameters are formulated as follows :
H = 2.01 V-°76 W = 5.85 V +7.6
Sa = 17.9 V-3.4
An = -17.0 VJ + 68.4 V2 - 86.0 V + 57.0
Fv = 21.3 V+3.2
2) Concerning the fluid dynamical resistance of the gear under towing conditions, the obtained results of total net resistance (Rt), net resistance (Rn) and otter board
resistance (Rob) are formulated as follows:
Rt = 665.55 V1-9
Rn =449.62 V1-5 Rob= 114.45 V2-0
INTRODUCTION
As fisheries play an important role in her economy, Thailand has a long history of
shrimp fishing. Recently, the annual catch of shrimp .has been increasing in many
'Exploratory Fishing Division, Dept. of Fisheries, Ministry of Agriculture and Cooperative, Rajadamnern Ave., Bangkok, Thailand.
"Lab. Fishing Gear, Faculty of Fisheries, Kagoshima University, 50-20 Shimoarata-4, Kagoshima City
net to improve fishing efficiency using the knowledge of the habitat and behavior of the shrimp and the quality of gear materials. Noteworthy are the research works which have been carried out by Robas (1959)9), Lee and Matuda (1973)5), Imai and Marin (1978)" etc., These contribute much to the knowledge of gear efficiencies and physical characteristics of shrimp trawl gear.
To obtain some fundamental information on the physical characteristics and gear efficiencies of a balloon type Thai shrimp trawl gear where the otter board is designed to be directly rigged to the wing tip of the net, the authors carried out a series of experiments on the reduced scale net in a circular tank. The obtained data will clearify some doubtful information for improvement of the gear.
MATERIALS AND METHODS
The shrimp trawl net under investigation was the balloon type single rigged shrimp trawl net. In order to fit the experimental trawl gear in a circular tank, the full scale net was reduced in accordance with Dr. Tauti's comparative method (Tauti, 1934)11'-The netting arrangement of the full scale and reduced scale nets are shown in Fig. 1 and Fig. 2, and the particulars of the gears are indicated in Table 1. In making a reduced scale net, similar net construction to the original full scale net was adopted.
Concerning netting material, polyethylene is specified for full scale net construction. Owing to the stiffness of polyethylene fiber however, it is unsuitable for reduced scale net construction. Therefore, nylon netting material was used in the construction of the reduced scale net. In the case of the otter board, polyvinyl chloride material was used instead of wooden board. The experiment was carried out in a circular tank of the Faculty of Fisheries, Kagoshima University.
As shown in Table 2, the ratio between the reduced scale model net (') and the
full scale net (") of the experimental trawl net was ascertained to be as follows:
1) Reducing scale ratio A/A"
2) Ratio of twine diameter and that of mesh size D/D'=L7L"=I<
3) Ratio of velocity
v/v=7dvd"-o>-l )/(P- -1)
4) Ratio of rope diameter
D'/D- =v/ava"-(p;-i) / u-n-wv"2
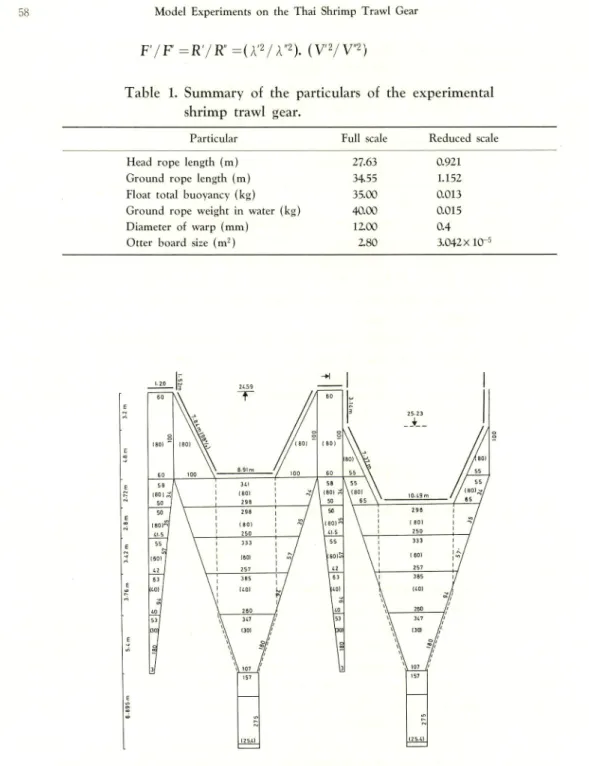
F/F=R'/R" =(A'2/A"2). (V'VV"2)
Table 1. Summary of the particulars of the experimental shrimp trawl gear.
Particular Full scale Reduced scale
Head rope length (m) 27.63 0.921
Ground rope Length (m) 34.55 1.152
Float total buoyancy (kg) 35.00 0.013
Ground rope weight in water (kg) 40.00 0.015
Diameter of warp (mm) 12.00 0.4
Otter board size (m2) 2.80 3.042 X 10⁻⁵
Figure 1. Net plan of the experimental shrimp trawl net. Numbers in the figure
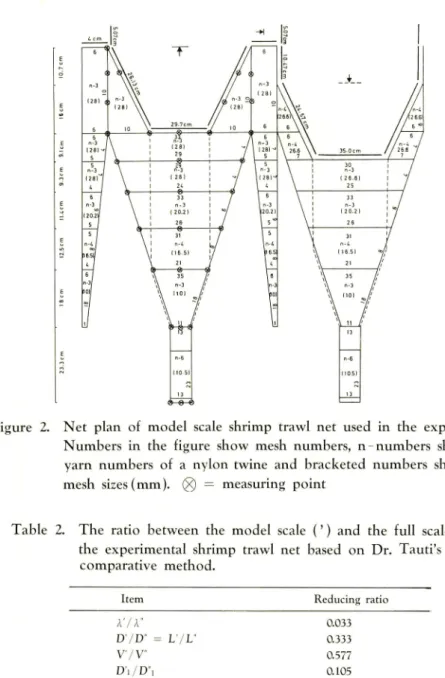
Figure 2. Net plan of model scale shrimp trawl net used in the experiment. Numbers in the figure show mesh numbers, n-numbers show yarn numbers of a nylon twine and bracketed numbers show
mesh sizes (mm). (X) = measuring point
Table 2. The ratio between the model scale (') and the full scale (") of the experimental shrimp trawl net based on Dr. Tauti's
comparative method. Item A7A" D'/D" V'/V" D'i/D'i Fi/F'i = R'i/R" L'/L" Reducing ratio 0.033 0.333 0.577 0.105 3.4 X 10-'
Two stages of experiment were carried out. The first stage was to determine the
net resistance (Rt) and net shape at different wing tip distances and towing speeds.
Practically, the distance between both wing tips is estimated to be in the range of 60 % to 80 % of the head rope length for shrimp trawl net (Wada, 1974)12). Therefore, for the experiment of model shrimp trawl net, the intervals between both wing tips
were designed to be fixed at 40 %, 50 60 and 70 % of the head rope length.
The resistance of the net at each fixed wing tip distance was measured at 0.5, 1.0, 1.5, 2.0, 2.5 and 3.0 knots, each reduced in accordance with Dr. Tauti's comparative
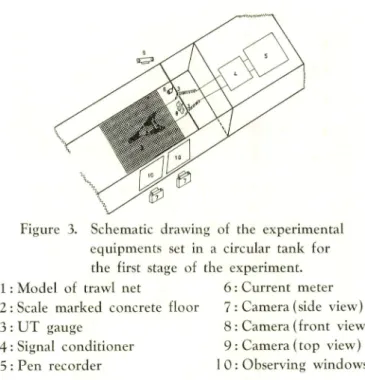
Figure 3. Schematic drawing of the experimental equipments set in a circular tank for the first stage of the experiment.
1: Model of trawl net 6 : Current meter
2: Scale marked concrete floor 7 : Camera (side view)
3 : UT gauge 8 : Camera (front view)
4: Signal conditioner 9: Camera (top view)
5 : Pen recorder 10 : Observing windows
In order to avoid the error of water current setting, different pulley position sett ing was done for each set flow velocity. By using Toko Dentan CM 10 S current meter, the flow velocity was transformed by electrical pulsation and the designed flow velocity could be set accordingly. The experimental model net was set on the scale mark concrete floor of the circular tank and both wing tips were connected to the tension meter system through the movable pulleys (Fig. 3). The tension meter system consists of a UT gauge, signal conditioner (YEW 3458-10) and flat bed pen recorder (Y E W 3062). The height of each wing tip was fixed with a wooden stick four centimeters in length, as the height of otter board, to keep the height of both wing tips as the same rigging otter boards.
The second stage of the experiment was to determine the net mouth height (H), wing tip distance (W), sweeping area (Sa), projective area of net mouth (An), water filtering volume (Fv), total net resistance (Rt) and otter board resistance (Rob) at
different flow velocities.
Since the otter board plane was not available, it was necessary to design a suitable otter board to fit this shrimp trawl net. Using the results obtained from the first stage of experiment and reliable data, the size and weight of otter board was determined
from the following equation :
L = 1/2Cl p V2 S Where :
L : Shear force of otter board Cl : Shear force coefficient
p : Density of water
V : Towing speed
S : Area of otter board
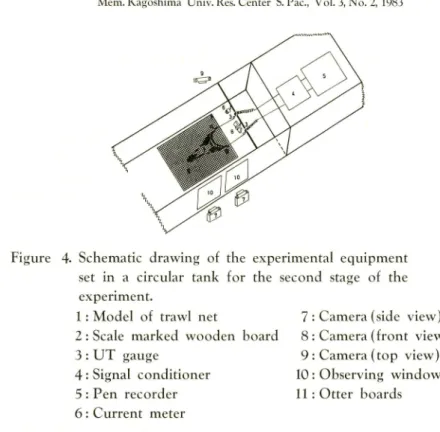
Figure 4. Schematic drawing of the experimental equipment set in a circular tank for the second stage of the experiment.
1: Model of trawl net
2 : Scale marked wooden board
3 : UT gauge
4: Signal conditioner
5: Pen recorder 6: Current meter
7 : Camera (side view) 8 : Camera (front view)
9 : Camera (top view) 10: Observing windows
11: Otter boards
layer about 15 cm just above the floor of the circular tank, a 30 cm elevated scale marked wooden board was used instead of the scale marked concrete floor. The board was placed horizontally inside the tank, then the experimental model net was set on
the board. The otter boards were rigged directly to both wing tips and connected to
the tension meter system through the movable pulleys (Fig. 4). The total tension of
the net was examined at 0.5, 1.0, 1.5, 2.0, 2.5, and 3.0 knots as with the first stage of the experiment, each reduced in accordance with Dr. Tauti's comparative method. The warp length and the position of the pulleys were based on the results from the first stage of experiment.
The tension of the experimental model net against the flowing water was measured by UT gauge and recorded by pen recorder. The net shape was determined directly by the measuring scale bar and the towing speed of net was represented by the flow velocity of water against the net. Measurements of the shape of the net at different flow velocities were carried out by reading each measuring point (Fig. 2) on the X,
Y, Z coordinate method and checked by photography in three directions.
Knowing the distance between both wing tips and the projective area of the net mouth, it was possible to determine the sweeping area (= distance between both wing tips X towing speed) and filtering volume (=projective area net mouth X towing speed) at each flow velocity.
Unless otherwise indicated, the symbols in all figures represent empirical values, and the curves indicate empirical equations.
RESULTS OF THE EXPERIMENTS
A. THE FIRST STAGE OF THE EXPERIMENT
The results of the relationship between the height of net mouth and towing speed at different wing tip distances are examined in graph form as show in Fig. 5. The curves seem to have similar characteristics. The height of the net mouth decreased sharply as the towing speed increased from 0.5 to 1.5 knots and continue to decrease
gradually as the towing speed increased over 2.0 knots. The lowest net mouth height
for each wing tip distance ranged from 1.68 meters to 1.47 meters as the towing speed increased up to the highest speed.
It is assumed that the height of the net mouth shows an exponential function to towing speed and that all empirical values for each towing speed are represented by the exponential regression equation as follows:
H = JVm Where :
H : Height of net mouth (m) V : Towing speed (m/s)
J : Coefficient
m: Index
The "J" and "rn" values for each wing tip distance are summarized in
Table 3.
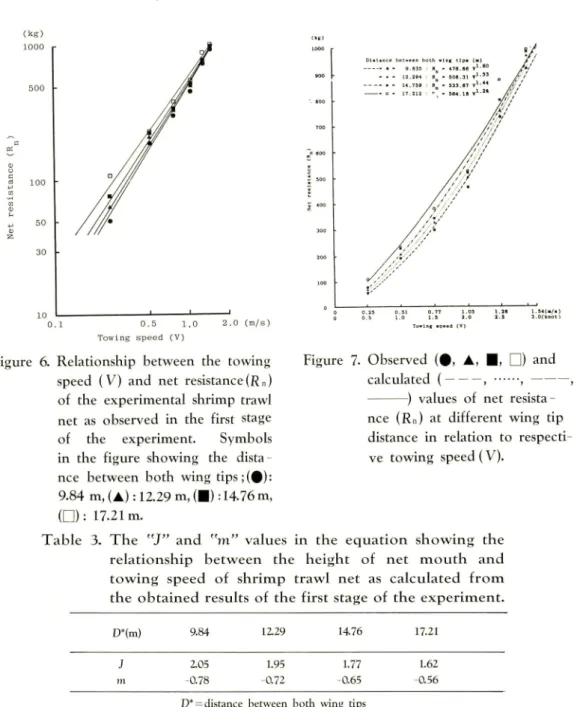
Obviously the resistance of the net for each fixed wing tip distance shows a linear relation to the towing speed on the logarithm graph (Fig. 6). The resistance of the
(m)
7
-Distance betweenboth wing tips (m)
• m • = 9.835 : H = 2.05 V * • 12.294 H - 1.95 V -°'73 \ . . . - • - 14.759 H = 1.77 V -°'65 *\ = • = 17.212 H = 1.62 V -°'56 • \ \ D
\ \\
• \ \ \ "'•• x \ '• x^m ,, \ — ____~~D •'-'^ • 0.25 0 . 5 0.51 1 . 0 0 . 7 7 1 . 5 1.03 2 . 0 1 . 2 8 2 . 5 1.54(m/s) 3.0 (knot) Towing speed (V)Figure. 5. Observed (#, •, •, D) and calculated ( , , , )
values of the height of net mouth (H) in relation to the towing speed (V) as obtained from the first stage of the experiment.
Towing speed (V)
2.0 (m/s)
Figure 6. Relationship between the towing speed (V) and net resistance(R„) of the experimental shrimp trawl net as observed in the first stage
of the experiment. Symbols
in the figure showing the dista nce between both wing tips ;(•): 9.84 m, (A): 12.29 m, (•): 14.76 m, (•): 17.21m.
Table 3. The "J" and V values in the equation showing the
relationship between the height of net mouth and
towing speed of shrimp trawl net as calculated from the obtained results of the first stage of the experiment.
D*(m) 9.84 205 -0.78 1229 1.95 -0.72
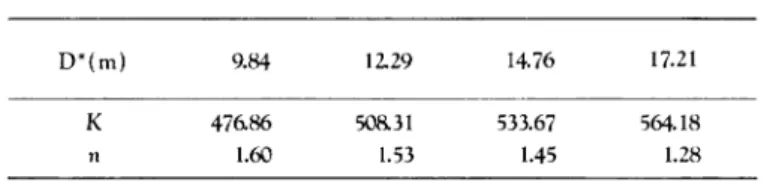
Figure 7. Observed (#, •, •, Q) and
calculated ( , , ,
) values of net resista nce (Rn) at different wing tip
distance in relation to respecti
ve towing speed (V). 14.76 1.77 -0.65 17.21 1.62 -0.56
D*= distance between both wing tips
net for each fixed wing tip distance increased in accordance with the increasing towing speed (Fig. 7).
Generally, the resistance of the net is represented by the most practical equation shown as a function of the index value of the towing speed, as follows:
R = KV"
Where :
R ; Resistance of the net V : Towing speed
K: Coefficient n : Index
From the above equation the ffK" and "n" values were determined for each fixed wing tip distance using a linear regression equation.
Table 4. The "K" and "n" values in the equation showing the relationship between the net resistance and towing speed of experimental shrimp trawl net as calculated from the obtained results of the first stage of the
experiment.
D*(m) 9.84 12.29 1476 17.21
K 47686 50a31 533.67 564.18
n 1.60 1.53 1.45 1.28
D*= distance between both wing tips
As shown in Fig. 8, it is obvious that the net resistance shows the linear relation to wing tip distance and that their relationship can be represented by a linear regression equation as follows:
R = aW+b Where:
R : Resistance of net W .* Wing tip distance
a : Coefficient
b : Constant
The "a" and "b" values were obtained for each towing speed and summarized in Table 5, and the net resistance at each stage of towing speed can be determined at any point between both wing tips.
B. THE SECOND STAGE OF THE EXPERIMENT
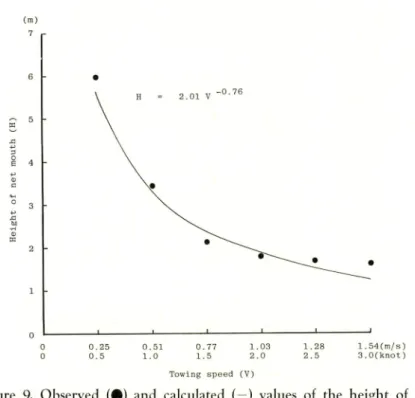
Generally, the results resemble those of the first stage of the experiment. As the towing speed accelerated from 0.5 to 1.5 knots, the height of net mouth lowered rapidly from 6.0 meters to 1.8 meters and then gradually decreased to 1.68 meters at 2.5 knots and 1.65 meters at 3.0 knots (Fig. 9).
As in the first stage of the experiment, the height of the net mouth showed an exponential function to the towing speed and that their relationship could be formu
lated as follows:
H=2.01 V"0-76 (1)
Where :
H ♦' height of net mouth (m)
V : towing speed (m/s)
The distance between the wing tips increased in accordance with increasing towing
speed. As shown in Fig. 10 the relationship between wing tip distance and towing speed is linear. The initial wing tip distance was 9.0 meters (32.6% of HR) at 0.5 knots, and gradually increased to 10.05 meters (36.4% of HR), 12.9 meters (46.7% of HR),
14.95 meters (51.0% of HR), 15.6 meters (56.5% of HR) and 16.05 meters (58.1% of
R - 3.57W+415.84(2.0knots)
R = 4.34W+261.15(1.5knots)
_» R = 2.55W+164.60U . Oknot )
|R = 3.55W+16.27(0.5knot)
8 10 12 14 16 18 (m) Wing tip distance (W)
Figure 8. Relationship between the net resistance and wing tip distance at various towing speeds.
Table 5. The "a" and "b" values in the equation showing the relationship between the net resistance and wing tip distance of the experi mental shrimp trawl net as calculated from the obtained results of the first stage of the experiment.
V*(m/s) 0.25 0.51 0.77 1.03 1.28 1.54
a 3.55 255 4.34 3.57 10.27 9.31
b 16.27 164.W 261.15 415.84 564.70 65865
V* —towing speed
Using a linear regression equation, the wing tip distance can be determined in relation to towing speed from the following equation :
W-5.85 V+ 7.6 (2)
Where :
W : Distance between both wing tips (m) V : Towing speed (m/s)
(m)
7
0 0.25 0.51 0.77 1.03 1.28 1.54(m/s)
0 0 . 5 1 . 0 1 . 5 2 . 0 2 . 5 3.0(knot)
Towing speed (V)
Figure 9. Observed (%) and calculated (—) values of the height of the net mouth (H) of the experimental shrimp trawl net equiped with otter boards in relation to towing speed (V).
0 . 2 5 0 . 5 0 . 5 1 1 . 0 5.85 V + 7.60 0.77 1 . 5 Towing speed (V) 1 . 0 3 2 . 0 1 .28 2 . 5 1.54(m/« 3.0(knnl
Figure 10. Relationship between wing tip distance (W) and towing speed (V) as observed in the second stage of the experiment.
0 . 2 5 0.51 0.77 1.03 1 . 2 8 1.54(m/s) 0 . 5 1.0 1.5 Towing speed 2.0 (V) 2.5 3.0(knot)
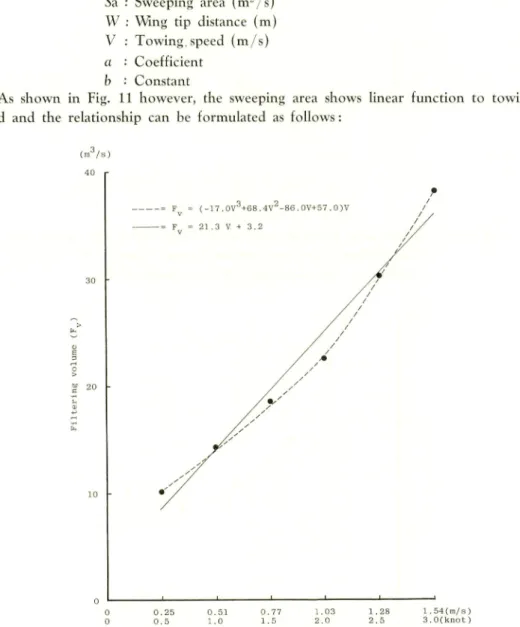
Figure 11. Relationship between sweeping area (Sa) and towing speed (V). The broken curve was obtained from equation (3) and the continuous line was obtained from equation (4).
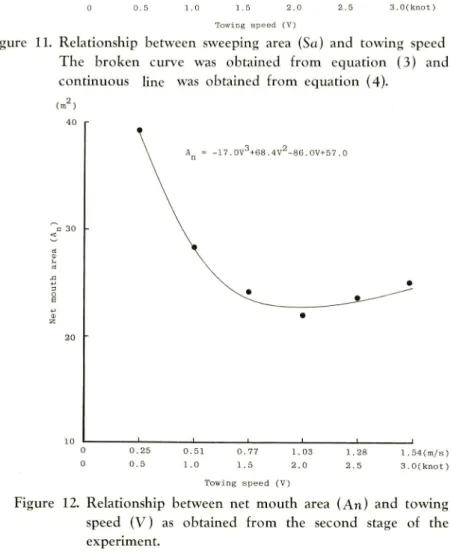
40 \\ A "n -17.0V3+68.4V2-86.OV+57.0 30 • • 20 10 1 ' i I i ' 0 0.25 0.51 0.77 1.03 1 .28 1 ,54(m/s) 0 0 . 5 1.0 1.5 2.0 Towing speed (V) 2 . 5 3.0(knot)
Figure 12. Relationship between net mouth area (An) and towing speed (V) as obtained from the second stage of the experiment.
to determine the sweeping area per unit of time by multiplying the value of the distance between both wing tips and towing speed.
Therefore : Sa = WV = (aV+ b)V = (5.85 V+ 7.6) V (3) Where : Sa : Sweeping area (m2/s) W : Wing tip distance (m) V : Towing, speed (m/s)
a : Coefficient b • Constant
As shown in Fig. 11 however, the sweeping area shows linear function to towing speed and the relationship can be formulated as follows:
F = 21.3 V + 3.2
0.25 0.51 0 . 7 7 1.03 1 . 2 8 1.54(m/s)
0 . 5 1 . 0 1 . 5 2 . 0 2 . 5 3.0(knot)
Towing speed (V)
Figure 13. Relationship between filtering volume (Ft1) per unit of time and towing speed (V) as obtained from the second stage of
the experiment. The broken curve was obtained from
equation (6) and the continuous line was obtained from
An= -17.0 V3+68.4 V2-86.0 V+ 57.0 (5) Wiere :
An: Projective area of net mouth (m2) V" •' Towing speed (m/s)
The water filtering volume is defined as the volume of water filtered through the projective area of net mouth per unit of time.
Therefore : Fv = An V
or
Fv = (- 17.0 V3 + 68.4 V2-86.0 V+57.0) XV
(6)
Wiere : (kg) 2000 0.5 1.0 Towing speed (V) 2.0(m/s)Figure 14. Relationship between the total net resistance (Rt) and towing speed (V) of the experimental shrimp trawl net as obtained
from the second stage of the experiment. The initial wing
tip distance was set at approximately 70% of the maximum
Fv = Water filtering volume (m3/s)
An= Projective area of net mouth (m2) V = Towing speed (m/s)
The results obtained from the second stage of the experiment show that the water
filtering volume varies in accordance with towing speed and that their relationship is
nearly linear (Fig. 13). Using a linear regression equation in order to simplify the equation (6), the empirical values can be represented by the following equation :
Fr= aV+b
= 21.3 V+3.2 (7)
The total net resistance shows almost linear relation to towing speed as the empirical
values were ploted on logarithm graph (Fig. 14).
Obviously, the total net resistance
increased exponentially to the towing speed. The relationship between total net re
sistance and towing speed can be represented by the following equation :
Rt = K V" = 665.55 V1-9 (8) Where : (kg) 2000 0 . 2 5 0 . 5 0.51 1 . 0 0.77 1 . 5 1.03 2 . 0 Towing speed (V) 1 . 2 8 2 . 5 1.54(m/s) 3.0(knot)
Figure 15. Relationship between the total net resistance (Rt) and towing speed (V), net resistance (Rn) and towing speed (V), otter board resistance (Ro b) and towing speed (V).
knowledge of the relationship between net resistance and wing tip distance as have been discussed earlier however, it is possible to determine the net resistance for each wing tip distance as in the second stage of the experiment, since the net resistance shows linear relation to wing tip distance at every stage of towing speed (Fig. 8).
As shown in Fig. 15, the relationship between net resistance and towing speed is represented by the following equation :
Rn^ 449.62 V1-5 (9)
Thus the resistance of otter board can be determined accordingly as:
Rob = Rt - Rn
As shown in Fig. 15, the resistance of the otter board shows exponential function
to towing speed and can be formulated as follows:
Rob = 141.45 V20 (10)
DISCUSSION
The lowest net mouth height, as observed in both stages of the experiment, is assumed to remain constant because the net mouth height has a tendency to be mai ntained by the height of the otter board and the floats ever at high towing speed. This is the most remarkable characteristic of the shrimp trawl net where the otter
board is rigged directly to the wing tip. Shrimp usually embed in muddy or sandy
sea bottom or swim just above it. Therefore, it is unnecessary for shrimp trawl nets to have a high net mouth. Miyamoto (1969)61 reported on his fishing trial of shrimp trawl net, in India that the design of net should take account of not so much the height of the net mouth as the distance between both wing tips. He also recommended that the height of the net mouth range from 60 cm to 100cm.
The lowest height of net mouth observed in this study was a bit high. This is
probably due to the net construction and excess buoyancy of the floats. Higo (1970)1' conducted model net experiments on three types of net and concluded that the factors which affect the height of the net mouth were distance between both wing tips, towing speed and buoyancy. His conclusion was later supported by Nomura et al. (1977)s).
The results of wing tip distances as observed in the second stage of experiment show that at towing speed 3.0 knots, the wing tip distance is only 58 % of head rope length. Comparatively speaking, it was a bit short because the standard wing tip distance
ranges between 65 % to 70 % of head rope length (Wada, 1974)12). This is probably
experiment however, the effect of the otter board to the wing tip distance was neglected
in the calculation.
In ordinary towing conditions, the sweeping area varies in accordance with the towing speed as long as the distance between both wing tips is rather fixed. In other words, to increase the sweeping area can be done by increasing towing speed. Secondly, the wing tip distance is another factor which affect the sweeping area. As in the case of wing tip distance, a greater sweeping area is expected if an aspect ratio of otter
board more than 0.5 or wider otter board is used.
As shown in Fig. 11, the broken and continuous lines were drawn from equation (3) and (4) respectively. The lines seem similar. In other words, equation (4) is a simplification of equation (3) and both equations are suitable for practical calculation. The projective area of the net mouth, as obtained in the second stage of the experiment, reduced rapidly as the towing speed increased from 0.5 to 2.0 knots. As the towing speed went higher than 2.0 knots however, it had tendency to increase
faster. This phenomena could be explained by the fact that the increasing rate of
net mouth height at 2.0 knots to 3.0 knots was comparatively low (Fig. 9), whereas
the wing tip distance showed an almost constant rate of increase. (Fig. 10).
Generally, the efficiency of trawl gear relates to the filtering volume per unit of
time. As shown in Fig. 13, the broken and continuous lines were obtained from equation (6) and (7) respectively. Obviously, they are not similar. In this case, equation (6) is preferable for accurate calculation.
The equation of net resistance is denoted by the exponential function of towing
speed and the index value is 1.5. This value is similar to that obtained by Nomura
and Yasui (1953 )71 and Honda (1958)21 on the model experiments of traditional two panel trawl nets where the obtained index values were 1.35-1.40 and 1.30-1.76 respectively. San and Fuwa (1975)10' conducted model experiments on the four panel shrimp trawl net and obtained the index values of 1.70- 1.74 dependent on the wing tip distance. Imai and Marin (1978)3> conducted model experiments on double rigged Mexican
shrimp trawl nets and the obtained index value was 1.71. Therefore, the experimental
Thai shrimp trawl net is assumed to have characteristics of water resistance similar to that of the traditional two-panel trawl net.
The resistance of the otter board is denoted as a function of the square of the
towing speed which is similar to a flat plate in a stream.
The percentage of otter
board resistance ranges between 7.6 %- 34.2% to that of total net resistance. This is
higher than other experiments conducted at sea by Koyama (1965)" who obtained
results showing that the-percentage of otter board resistance ranged between 15.2%
-29.8°/0 of the total net resistance. This is probably due to the large attack angle of the otter board against the flowing water. In the experiments, the attack angle was
planned at 25 degrees, but the observed results as checked from photographs and
measurements, ranged between 32 degree to 38 degree. Therefore, otter board bridle
length adjustment must be taken into consideration in order to set a small attack angle.
SUMMARY AND CONCLUSION
ACKNOWLEDGEMENT
The authors are greatly indebted to the kindness of Prof. Dr. Nobio Higo and Research Asst. Mr. Shigeru Fuwa of the Laboratory of Fishing Gear, Faculty of Fisheries, Kagoshima University for his guidance and helpful suggestions, and to all the facilities provided to make this study possible ; to Mr. Gomes Chareonbhanich, Fishing Gear Specialist, Department of Fisheries, Ministry of Agriculture and Cooperatives, Thailand for providing the authors with a shrimp trawl net plan, and to all the students of the Laboratory of Fishing Gear for helping in various ways.
REFERENCES
1) Higo, N. 1970: Fundamental Studies on the Fishing Efficiencies of Trawling Nets.,
Mem. Fac. Fish., Kagoshima Univ., 20 (2): 1-137.
2) Honda, K. 1958: A Model Experiment for Trawl Nets., Bull. Jap. Soc. Set. Fish.,
23:608-611.
3) Imai, T. and Marin, H. R. 1978: Model Experiments on Double Rigged Shrimp
Trawl Gear: Physical Characteristics of Balloon Net., Mem. Fac. Fish., Kagoshima
Univ., 27 (1): 139- 146.
4) Koyama, T. 1965: On the Result of Field Trial with Various Big Sized Otter
Trawls. Bull. Tokai Reg. Fish. Res. Led?., 43: 13-71.
5) Lee, T.J. and Matuda, K. 1973 : Studies on the Shrimp Beam Trawl Used in Taiwan
-I: Field Experiments of the Beam Trawl. Bull Jap. Soc. Sci. Fish., 39 (12): 1237
- 1243.
6) Miyamoto, H. 1968: Establishment of a Fishing Gear Research Laboratory., FAO
TA 2599: 1- 137.
7) Nomura, M. and Yasui, T. 1953: Model Experiments on Trawl Nets of Various Types., Bull Jap. Soc. Sci. Fish., 18 (12): 727 - 733.
8) Nomura, M., Mori, K., Tawara, Y., Osawa, Y., Shimada, Y. and Senga, K. 1977 :
Factors of Trawl Net Construction Relating to the Height of Net Mouth., Bull.
Tokai Reg. Fish. Res. Lab. 91. 53-66.
9) Robas, J. S. 1959: Shrimp Trawling Gear as used in the Gulf of Mexico., "Modern Fishing Gear of the World". Fishing News Books Ltd., London: 311-316.
10) San, M. M. and Fuwa, S. 1975: Comparison of the Gear Efficiencies of Two Types
of Trawl Net., Mem. Fac. Fish., Kagoshima Univ., 24:47-56.
11) Tauti, M. 1934: A Relation between Experiments on Model and on Full Scale of
Fishing Net., Bull. Jap. Soc. Sci. Fish., 3 (4): 171- 177.