J Occup Health. 2021;63:e12214.
|
1 of 11https://doi.org/10.1002/1348-9585.12214 wileyonlinelibrary.com/journal/joh2
O R I G I N A L A R T I C L E
Gender differences and site- specific incident risks of
musculoskeletal disorders among 224 506 workers in the food
and beverage service industry in Taiwan: A 15- year Nationwide
Population- Based Cohort Study
Chiung- Yu Peng
1,2|
Hui- Min Hsieh
1,2,3,4,5|
Meng- Yun Li
1|
Lih- Jiun Liaw
6|
Chao- Ling Wang
2,7|
Chih- Hong Pan
8|
Ming- Tsang Wu
1,2,9,10,111Department of Public Health, Kaohsiung Medical University, Kaohsiung, Taiwan
2Research Center for Environmental Medicine, Kaohsiung Medical University, Kaohsiung, Taiwan 3Department of Medical Research, Kaohsiung Medical University Hospital, Kaohsiung, Taiwan 4Department of Community Medicine, Kaohsiung Medical University Hospital, Kaohsiung, Taiwan 5Center for Big Data Research, Kaohsiung Medical University, Kaohsiung, Taiwan
6Department of Physical Therapy, Kaohsiung Medical University, Kaohsiung, Taiwan
7Department of Occupational Medicine, Kaohsiung Medical University Hospital, Kaohsiung, Taiwan 8Institute of Labor, Occupational Safety and Health, Ministry of Labor, Taipei, Taiwan
9Department of Family Medicine, Kaohsiung Medical University Hospital, Kaohsiung Medical University, Kaohsiung, Taiwan 10Environmental and Occupational Medicine, Kaohsiung Medical University, Kaohsiung, Taiwan
11Graduate Institute of Clinical Medicine, Kaohsiung Medical University, Kaohsiung, Taiwan
Correspondence
Hui- Min Hsieh, 100 Shih- Chung 1st Road, San- Ming Dist., Kaohsiung 807, Taiwan. Email: [email protected]
Funding information
This study was supported by the
Occupational Safety and Health, Ministry of Labor (ILOSH- 103- 3002, ILOSH- 105- 0007, and ILOSH- 106- 0012), and by the Ministry of Science and Technology grant (MOST 109- 2423- H- 037- 001- SS3). We are also grateful to Kaohsiung Medical University for providing administrative and funding support. The authors thank the help from the Division of Medical Statistics and Bioinformatics, Department of Medical Research, Kaohsiung Medical University Hospital, and Center for Big Data Research (KMU- KMU- TC109B08), Kaohsiung Medical University for providing administrative support. None of which had any role in study design, data collection and analysis, decision to publish, or preparation of the manuscript.
Abstract
Objectives: Occupational characteristics in the food and beverage service industry (FBSI) have been found to be associated with musculoskeletal disorders (MSDs). This study aimed to examine gender and site- specific incident risks of MSDs among FBSI workers in Taiwan using a national population- based database.
Methods: We conducted a 15- year population- based cohort study among 224 506 FBSI workers in Taiwan using data from five large nationwide databases to estimate direct standardized incidence ratios (SIRs) for identifying specific MSDs related to overexertion and repetitiveness during work. Overall, MSDs risks were also investi-gated by gender, sub- industrial categories, and certificate types.
Results: We found SIRs for overall MSDs for male and female workers of 1.706 (95% CI, 1.688- 1.724) and 2.198 (95% CI, 2.177- 2.219), respectively. Our findings indicate significantly increased WMSD risk for both men and women, including median/ulnar nerve disorders (ICD- 9 354.0- 354.2); spondylosis and allied disorders (ICD- 9 721); intervertebral disc disorders (ICD- 9 722); disorders of the back (ICD- 9 724); peripheral enthesopathies and allied syndromes (ICD- 9 726); synovium, tendon, and bursa disorders (ICD- 9 727); and soft tissues of the peripheral system disorders This is an open access article under the terms of the Creative Commons Attribution-NonCommercial-NoDerivs License, which permits use and distribution in any medium, provided the original work is properly cited, the use is non-commercial and no modifications or adaptations are made.
1
|
INTRODUCTION
Musculoskeletal disorders (MSDs) are common occupational problems, with high incidence and prevalence and substantial disease burden worldwide.1 The World Health Organization defines work- related MSDs (WMSDs) as induced or aggra-vated by work and occupational characteristics, such as re-petitive tasks or awkward lifting.2 According to the European Occupational Diseases Statistics reports in 2005, WMSDs accounted for about 38% of all occupational diseases.2 The UK’s Health and Safety Executive reported that WMSD cases accounted for 39% of all work- related ill health in Great Britain.1 In the US, a survey reported lower back pain in 24.8% of employed adults and arthritis in 17.8%.3 One report from the Ministry of Labor in Taiwan indicated that WMSD cases ranked first of occupational diseases, accounting for 37.7%, according to Taiwan's occupational injury and disease notification system in 2018.4
WMSD risks among food and beverage services indus-try (FBSI) workers specifically have been identified.5- 8 FBSI work is characterized by long hours, prolonged standing and leaning forward, repetitive and fast hand and wrist move-ments, prolonged and forceful hand and wrist exertion, and carrying and lifting heavy objects, all well- known risk fac-tors for WMSDs.1,5,7- 9 Studies have investigated the associa-tion between such tasks and WMSDs. For example, Tomita et al found significant lower back pain in workers who pre-pared a large number of meals daily (≥150 vs <150 meals/ person- day).10 FBSI workers may experience high body strain associated with their tasks, and thus develop WMSDs.
Although a number of studies have examined FBSI- related MSD risk factors, most used a cross- sectional de-sign, obtained related information from self- administrated questionnaires with limited sample sizes, and focused on prevalence risks of selected WMSDs.7 For example, Chyuan et al reported that 84% of 905 participating restaurant work-ers experienced MSDs during the past month.11 Jayaraman et al reported MSD prevalence in 502 restaurant workers of 63% in lower limbs, 56% in lower back, and 49% in neck
and upper back.12 Subramaniam and Murugesan found that 67.5% of 114 male kitchen workers had MSDs, with the highest prevalence in the lower back (65.8%) and shoulder (62.3%).6 Some complaints in the survey questionnaire may be minor and not need medical treatment, or may lack accu-racy or completeness due to recall bias.5 Very little existing literature reports population- based data to examine WMSD risk. One study by Shiue et al (2008) reported physician- diagnosed WMSD incidence in 52 261 Chinese restaurant cooks using health insurance data from 1998 to 2002, and found higher risk among cooks in Taiwan. However, these authors identified only selected MSDs in cooks, not incident risk of all types of WMSDs across different FBSI sectors. As the anatomical sites reported in the existing literature may ne-glect some painful symptoms, empirical evidence is lacking regarding the extent of body sites or MSD symptoms with higher incident risks among FBSI workers.11
This study aimed to investigate specific WMSD incident risks among FBSI workers in Taiwan compared with the age- and gender- specific general population. Specifically, we conducted a 15- year population- based cohort study using data from five large nationwide databases to estimate direct standardized incidence ratios (SIRs) for identifying specific WMSDs using all MSD diagnosis codes from the International Classification of Diseases, Ninth Revision, Clinical Modification (ICD- 9- CM), among 224 506 FBSI workers in Taiwan. Overall, MSDs risks were also investi-gated by gender, type of primary work sub- industry (restau-rant, non- alcoholic beverage service, food and beverage service, and other), and type of cooking license (Chinese cui-sine, baking, western cuicui-sine, and other).
2
|
METHODS AND MATERIALS
2.1
|
Data source
Data analyzed in this study were retrieved from five nation-wide population- based databases in Taiwan. The first was the (ICD- 9 729). Food stall workers and workers with Chinese cuisine or baking licenses were at higher risk among sub- industrial categories and certificate types.
Conclusion: This large- scale study revealed that FBSI workers were at higher risk for several MSDs than the general population. This information could help prioritize MSD problems and identify a high- risk population. Relevant policy and ergonomic improvements and interventions could be implemented for health promotion in this industry.
K E Y W O R D S
National Labor Insurance (NLI) Database from the Ministry of Labor, which contained data for 13 million workers within a 15- year period from 2000 to 2014, and provided detailed informa-tion regarding labor enrollment profiles, company profiles (ie, industrial classifications, address), and a registry of compensa-tion for occupacompensa-tional injuries and disease. The second was the Registry of Professional Certified Chiefs, 1984- 2014, from the Workforce Development Agency, Ministry of Labor, contain-ing the types of cookcontain-ing certifications issued and the date of certification. The third was Taiwan's National Health Insurance Research Database (NHIRD) 1998- 2014, containing records of all claims for ambulatory and inpatient medical care (including diagnoses) and prescriptions, and health insurance enrollment profiles for Taiwan's 23 million people. The fourth database was the national death registry, 1971- 2014, containing accurate death dates and causes of death for all Taiwan's residents. The fifth was a national cancer registry, containing records of all cancer diagnoses by type, 1979- 2014. These five databases were linked using encrypted patient identifiers. All data analyses were com-pleted in the Health and Welfare Data Science Center, Ministry of Health and Welfare, Taiwan, in 2019- 2020. This study was approved by the Institutional Review Board at Kaohsiung Medical University Hospital (KMUHIRB- E(I)- 20170116).
2.2
|
Study population
This was a retrospective cohort study. The study cohort in-cluded anyone with any enrollment records in the FBSI sec-tor of the NLI program between 2000 and 2014, based on the tenth version of the standard industrial classification system of the National Statistics in Taiwan. Specifically, we identi-fied 1 561 114 workers in the FBSI sector between 2000 and 2014, and defined the first date of NLI enrollment during the identification period as the entry date. We excluded workers whose records lacked birthday or gender information, non- citizens, workers aged younger than 20 or older than 65 years on the entry date, and workers with less than 6 months of cumulative work experience in the FBSI sector during the identification period. We also excluded those with death re-cords, cancer diagnoses, or any petition or payment records due to occupational diseases prior to the entry date. To ob-tain valid estimates of MSD incidence, we further excluded workers with any MSD diagnosis (as listed in Table 3) prior to the entry date. The study inclusion and exclusion criteria flow chart is shown in Figure 1. After exclusions, the study included 224 506 FBSI workers in 2000- 2014 (113 543 men, 130 963 women).
FIGURE 1 Inclusion and exclusion
criteria for the study population working in the food and beverage services industry
2.3
|
Follow- up and end points
We used unique identifiers to link study subjects with na-tional health insurance administrative claims from 2000 to 2014, and identified observed and expected events for 32 types of MSDs with ICD- 9- CM diagnosis codes 354.0- 354.2, 443.8- 443.9, and 710.x- 739.x for at least two outpatient visits or at least one inpatient hospitalization after the entry date up to the study end point. We defined the date of the first MSD diagnosis for each study subject between 2000 and 2014 as the event date. All study subjects were followed from the entry date to the first of occurrence of an end point (MSDs), death, or the study end date, December 31, 2014. We calcu-lated SIRs of MSDs to compare observed events from the FBSI study cohort with the expected events from the general population.
Since MSD rates increase strongly with age and vary by gender and calendar year, the SIR estimation considered the effect of age, gender, and calendar year. Following Udaltsova and Silverberg's (2014) apporach,13 we first calculated the age- and gender- specific rates of MSD incidence and person- years for the FBSI cohort. We then calculated the number of expected cases based on general population- based MSD inci-dence rates, and follow- up time matrix by age (20- 24, 25- 29, 30- 34, 35- 39, 40- 44, 45- 49, 50- 54, 55- 59, and 60- 64 years), gender (male, female), and calendar year (2000- 2014).13 Age, gender, and calendar year SIRs were then calculated by dividing the observed numbers of MSD claims by the ex-pected numbers. Specific SIRs of MSDs by gender (male, female), types of primary work sub- industries (restaurant, non- alcoholic beverage service, food stall service, and other), and types of cooking license (Chinese cuisine, baking, west-ern cuisine, and other) were estimated. A 95% confidence interval (CI) was calculated using Poisson distribution as proposed by Gardner and Altman (1989).13- 15
2.4
|
Statistical approach
In addition to the SIR estimations, we further used the Bonferroni and false discovery rate approach to calculate adjusted P- values among multiple specific MSD site com-parisons to handle multiple testing concerns.16 All statistical operations were performed using SAS version 9.4 (SAS in-stitute, Cary, NC). A P- value of less than .05 was considered significant.
3
|
RESULTS
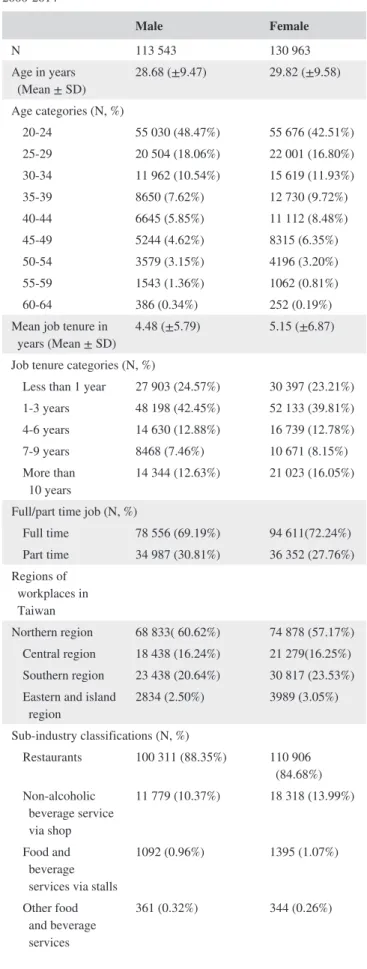
Table 1 summarizes demographic and occupational char-acteristics of male and female FBSI workers identified in 2000- 2014. Male workers (n = 113 543) had a mean age of
TABLE 1 Demographic and occupational characteristics in
male and female workers in the food and beverage services industry, 2000- 2014 Male Female N 113 543 130 963 Age in years (Mean ± SD) 28.68 (±9.47) 29.82 (±9.58) Age categories (N, %) 20- 24 55 030 (48.47%) 55 676 (42.51%) 25- 29 20 504 (18.06%) 22 001 (16.80%) 30- 34 11 962 (10.54%) 15 619 (11.93%) 35- 39 8650 (7.62%) 12 730 (9.72%) 40- 44 6645 (5.85%) 11 112 (8.48%) 45- 49 5244 (4.62%) 8315 (6.35%) 50- 54 3579 (3.15%) 4196 (3.20%) 55- 59 1543 (1.36%) 1062 (0.81%) 60- 64 386 (0.34%) 252 (0.19%) Mean job tenure in
years (Mean ± SD) 4.48 (±5.79) 5.15 (±6.87) Job tenure categories (N, %)
Less than 1 year 27 903 (24.57%) 30 397 (23.21%) 1- 3 years 48 198 (42.45%) 52 133 (39.81%) 4- 6 years 14 630 (12.88%) 16 739 (12.78%) 7- 9 years 8468 (7.46%) 10 671 (8.15%) More than
10 years 14 344 (12.63%) 21 023 (16.05%) Full/part time job (N, %)
Full time 78 556 (69.19%) 94 611(72.24%) Part time 34 987 (30.81%) 36 352 (27.76%) Regions of workplaces in Taiwan Northern region 68 833( 60.62%) 74 878 (57.17%) Central region 18 438 (16.24%) 21 279(16.25%) Southern region 23 438 (20.64%) 30 817 (23.53%) Eastern and island
region 2834 (2.50%) 3989 (3.05%) Sub- industry classifications (N, %)
Restaurants 100 311 (88.35%) 110 906 (84.68%) Non- alcoholic beverage service via shop 11 779 (10.37%) 18 318 (13.99%) Food and beverage services via stalls
1092 (0.96%) 1395 (1.07%) Other food and beverage services 361 (0.32%) 344 (0.26%) (Continues)
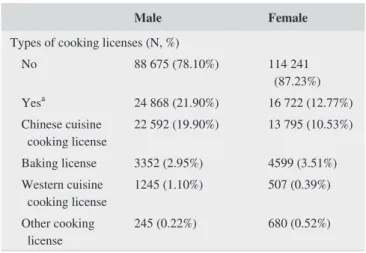
28.68 years; 88.35% worked in restaurants and 21.90% had official cooking certificates, a high portion Chinese cuisine certificates. Female workers (n = 130 963) had a mean age 29.82 years; 84.68% worked in restaurants and 12.77% had official cooking certificates, a high portion Chinese cuisine certificates.
Table 2 shows crude gender- and age- specific incidence rates of all- cause MSDs in FBSI workers; 76 711 workers (34 313 men, 42 398 women) were diagnosed with all- cause incident MSDs over 1 627 351 person- years, representing a crude MSD incidence rate 4.71 per 100 person- years. The average duration of follow- up was 6.98 years for men and 6.37 years for women. Crude MSD incidence was greater in women (5.08 per 100 person- years) than in men (4.33 per 100 person- years) and increased with age.
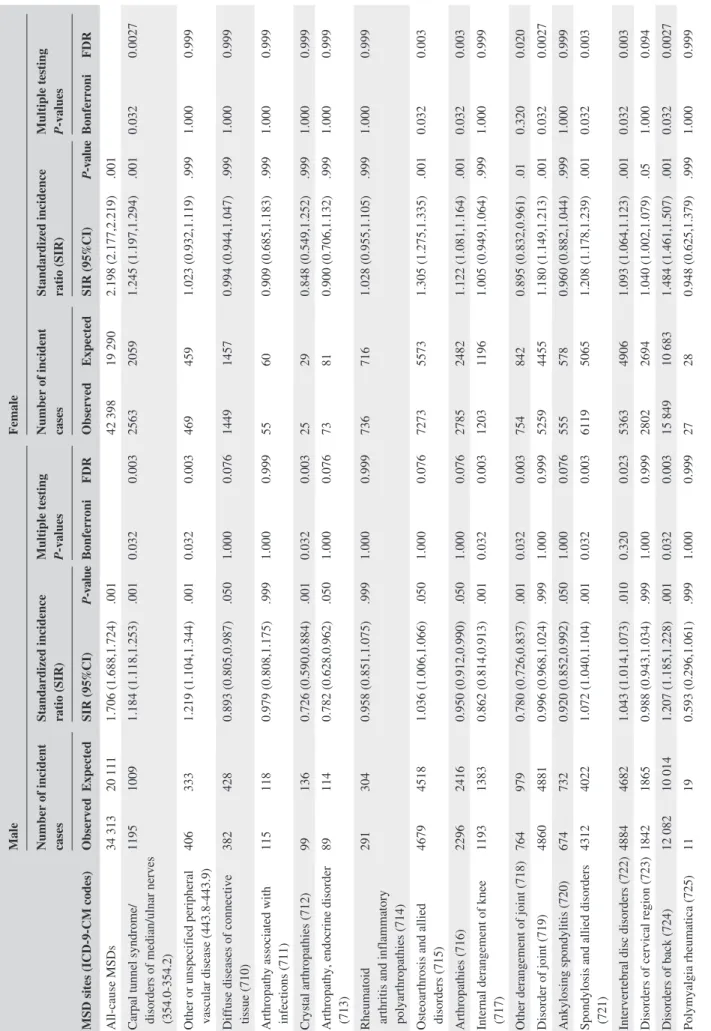
Table 3 presents the SIRs of all- cause and site- specific MSDs for male and female FBSI workers. Compared with the general population, both male and female FBSI workers had significantly increased rates of all- cause MSD incidence, with an SIR of 1.706 (95% CI, 1.688- 1.724, observed vs ex-pected incident MSD cases: 34 313 vs 20 111) for men and 2.198 (95% CI, 2.177- 2.219, observed vs expected incident MSD cases: 42 398 vs 19 290) for women. Male workers had higher site- specific SIRs for carpal tunnel syndrome/ median/ulnar nerve disorder (1.184; 95% CI, 1.118- 1.253); other peripheral vascular disease (white finger) (1.219; 95% CI, 1.104- 1.344); spondylosis and allied disorders (1.072; 95%CI, 1.040- 1.104); back or spinal disorder (1.207; 95% CI, 1.185- 1.228); peripheral enthesopathies and allied syndrome (1.099; 95% CI, 1.071- 1.128); other synovium, tendon, and bursa disorder (1.129, 95% CI, 10103- 1.155); and soft tis-sue disorder (1.267, 95%CI, 1.248- 1.287). Risk patterns were similar for female workers.
Table 4 presents SIRs for overall MSD risk in male and female FBSI workers, stratified by sub- industrial categories and types of cooking certificates. Male workers (SIR, 1.475;
95% CI, 1.334- 1.627) with baking cooking licenses (SIR, 1.508, 95% CI, 1.400- 1.380) had higher MSD risk; female workers in restaurants (SIR, 1.704; 95% CI, 1.687- 1.722) and with Chinese cuisine cooking licenses had higher MSDs risk (SIR, 1.865; 95% CI, 1.814- 1.917).
4
|
DISCUSSION
This study used nationwide population- based databases to comprehensively investigate specific WMSD incident risks in FBSI workers from insurance- claimed illnesses related to MSDs (ICD 9 710- 739) and two other disorder groups (ICD- 9 354.0- 354.2: carpal tunnel syndrome, other lesion of median nerve, and lesion of ulnar nerve, described as disorders of median/ulnar nerves; ICD- 9 443.8- 443.9: other specified pe-ripheral vascular disease and unspecified pepe-ripheral vascu-lar disease, described as peripheral vascuvascu-lar diseases in this study) associated with work repetitiveness and overexertion. Overall findings indicated higher SIRs of all- cause MSDs for male and female FBSI workers, while several WMSDs were particularly identified with high risks possibly associated with FBSI work characteristics.
Specifically, of these disorders, our findings indicate significantly increased risk for both gender of disorders of median/ulnar nerves (ICD- 9 354.0- 354.2); spondylosis and allied disorders (ICD- 9 721); intervertebral disc disorders (ICD- 9 722); other and unspecified disorders of back (ICD- 9 724); peripheral enthesopathies and allied syndromes (ICD- 9 726); other disorders of synovium, tendon, and bursa (ICD- 9 727); and other disorders of soft tissues of the peripheral system (ICD- 9 729). The majority of results were similar to those reported by Shiue et al (2008), which showed an in-creased risk of carpal tunnel syndrome/median/ulnar nerve disorders (ICD- 9, 354.0), displacement of thoracic or lum-bar intervertebral disc without myelopathy (ICD- 9, 722.1), lumbago (ICD- 9, 724.2), shoulder and epicondylitis (ICD- 9, 726.1, 726.31- 726.32), and trigger finger and radial styloid tenosynovitis (ICD- 9, 727.03- 727.04).5 However, these au-thors did not identify two other WMSD risks, including for spondylosis and allied disorders (ICD- 9 721) and other dis-orders of soft tissues of the peripheral system (ICD- 9 729) among FBSI workers. Disorders of the soft tissue (ICD- 9 729) and spondylosis and allied disorders (ICD- 9 721) were top rankings, with high observed incidence for both gender; however, few studies investigated the association of these dis-orders with work- related factors. They are related to overuse of muscles, quick and repetitive movements, and static and prolonged standing.17,18
We also found that FBSI workers had lower risks of de-rangement of joint (ICD- 9 718) and ankylosing spondylitis (ICD- 9 720) than the general population. The first disease group includes articular cartilage disorder (718.0), recurrent
Male Female
Types of cooking licenses (N, %)
No 88 675 (78.10%) 114 241 (87.23%) Yesa 24 868 (21.90%) 16 722 (12.77%) Chinese cuisine cooking license 22 592 (19.90%) 13 795 (10.53%) Baking license 3352 (2.95%) 4599 (3.51%) Western cuisine cooking license 1245 (1.10%) 507 (0.39%) Other cooking license 245 (0.22%) 680 (0.52%)
aThe categories of cooking licenses are not mutually exclusive, indicating that an individual may hold more than one license.
dislocation of joint (718.3), contracture of joint (718.4), and ankylosis of joint (718.5), which cause severe joint damage. Workers with these diseases sustain them from jobs requiring long periods of standing, such as cooking. The last is related to individual characteristics, and genetic factors seem to be involved. Symptoms of ankylosing spondylitis might include pain and stiffness in the lower back and hips.19 These disor-ders prevent the individuals who have them from performing work requiring lifting/handling heavy objects or maintain a static posture (eg, standing) for a long time, possibly ex-plaining their low FBSI- worker risk. This result can help with worker selection, since workers with these diseases may not be capable of FBSI work.
Gender differences in incidence and prevalence were also noted in previous studies. For example, Shiue et al found that female cooks had the highest incidence, followed by the fe-male reference group, fe-male cooks, and the fe-male reference group, in almost every age category.5 Tomita et al reported prevalence rates of low back pain for male and female work-ers of 30.6% and 39.0%, respectively, among commercial kitchen workers.10 Results were similar for the other occu-pational categories. Parot- Schinkel et al reported signifi-cantly higher prevalence rates for women than for men in
the categories of managers/professionals (66.7% vs 63.8%), associated professionals/technicians (67.5% vs 62.4%), and skilled and unskilled workers (75.6% vs 63.9%),20 showing that female workers were at higher risk of WMSDs than male workers. Therefore, gender differences should be considered in WMSD prevention. Additional information is needed to understand the underlying reasons and to formulate gender- specific mitigation.
In addition to gender differences in overall risks of MSDs, gender differences in body site- specific MSDs were also found. For example, male workers, but not female workers, had significantly increased risk of other and unspecified peripheral vascular disease (ICD- 9 443.8- 443.9). The most common peripheral vascular disease was lower limb varicose veins (LLVV), and the prominent risk factor was prolonged standing time per day.21- 23A systematic review reported that workers who stood longer than 3- 4 hours per day seemed to have an increased risk (~2.5- fold higher) of LLVV than those who were less exposed.24 Several studies reported that women had higher prevalence23 or risk (workers with prolonged standing vs no prolonged standing) than men.25 Given that our reference group was the general population in which the above- mentioned occupational types had the same
MSD incident event
occurrence Total Person- years observed Crude Incidence rate / per 100 person- years
Male 20- 24 13 914 382 654.42 3.64 25- 29 5954 151 908.45 3.92 30- 34 3985 86 222.31 4.62 35- 39 3157 61 101.71 5.17 40- 44 2635 44 378.29 5.94 45- 49 2209 33 894.25 6.52 50- 54 1529 22 083.49 6.92 55- 59 732 8620.17 8.49 60- 64 198 2234.82 8.86 All 34 313 793 097.91 4.33 Female 20- 24 12 497 368 056.84 3.40 25- 29 6425 148 229.05 4.33 30- 34 5417 100 331.89 5.40 35- 39 5316 78 754.21 6.75 40- 44 5387 65 927.25 8.17 45- 49 4428 44 648.07 9.92 50- 54 2235 22 023.51 10.15 55- 59 536 5091.19 10.53 60- 64 157 1191.43 13.18 All 42 398 834 253.44 5.08
Abbreviations: MSD, Musculoskeletal disorder.
TABLE 2 Gender- and age- specific
incidence rates of overall musculoskeletal disorders in 224 506 male and female workers in the food and beverage services industry in Taiwan, 2000- 2014
TABLE 3
Standard incidence ratio of
cause and specific MSD in male and female workers in the food and beverage services industry in Taiwan,
2014 MSD sites CM codes) Male Female
Number of incident cases Standardized incidence ratio (SIR) Multiple testing P- values Number of incident cases Standardized incidence ratio (SIR) Multiple testing P- values
Observed Expected SIR (95%CI) value Bonferroni FDR Observed Expected SIR (95%CI) value Bonferroni FDR cause MSDs 34 313 20 111 1.706 (1.688,1.724) .001 42 398 19 290 2.198 (2.177,2.219) .001
Carpal tunnel syndrome/ disorders of median/ulnar nerves
354.2) 1195 1009 1.184 (1.118,1.253) .001 0.032 0.003 2563 2059 1.245 (1.197,1.294) .001 0.032 0.0027
Other or unspecified peripheral vascular disease
443.9) 406 333 1.219 (1.104,1.344) .001 0.032 0.003 469 459 1.023 (0.932,1.119) .999 1.000 0.999
Diffuse diseases of connective tissue (710)
382 428 0.893 (0.805,0.987) .050 1.000 0.076 1449 1457 0.994 (0.944,1.047) .999 1.000 0.999
Arthropathy associated with infections (711)
115 118 0.979 (0.808,1.175) .999 1.000 0.999 55 60 0.909 (0.685,1.183) .999 1.000 0.999 Crystal arthropathies (712) 99 136 0.726 (0.590,0.884) .001 0.032 0.003 25 29 0.848 (0.549,1.252) .999 1.000 0.999
Arthropathy, endocrine disorder (713)
89 114 0.782 (0.628,0.962) .050 1.000 0.076 73 81 0.900 (0.706,1.132) .999 1.000 0.999
Rheumatoid arthritis and inflammatory polyarthropathies (714)
291 304 0.958 (0.851,1.075) .999 1.000 0.999 736 716 1.028 (0.955,1.105) .999 1.000 0.999
Osteoarthrosis and allied disorders (715)
4679 4518 1.036 (1.006,1.066) .050 1.000 0.076 7273 5573 1.305 (1.275,1.335) .001 0.032 0.003 Arthropathies (716) 2296 2416 0.950 (0.912,0.990) .050 1.000 0.076 2785 2482 1.122 (1.081,1.164) .001 0.032 0.003
Internal derangement of knee (717)
1193 1383 0.862 (0.814,0.913) .001 0.032 0.003 1203 1196 1.005 (0.949,1.064) .999 1.000 0.999
Other derangement of joint (718)
764 979 0.780 (0.726,0.837) .001 0.032 0.003 754 842 0.895 (0.832,0.961) .01 0.320 0.020 Disorder of joint (719) 4860 4881 0.996 (0.968,1.024) .999 1.000 0.999 5259 4455 1.180 (1.149,1.213) .001 0.032 0.0027 Ankylosing spondylitis (720) 674 732 0.920 (0.852,0.992) .050 1.000 0.076 555 578 0.960 (0.882,1.044) .999 1.000 0.999
Spondylosis and allied disorders (721)
4312 4022 1.072 (1.040,1.104) .001 0.032 0.003 6119 5065 1.208 (1.178,1.239) .001 0.032 0.003 Intervertebral disc disorders (722) 4884 4682 1.043 (1.014,1.073) .010 0.320 0.023 5363 4906 1.093 (1.064,1.123) .001 0.032 0.003
Disorders of cervical region (723)
1842 1865 0.988 (0.943,1.034) .999 1.000 0.999 2802 2694 1.040 (1.002,1.079) .05 1.000 0.094 Disorders of back (724) 12 082 10 014 1.207 (1.185,1.228) .001 0.032 0.003 15 849 10 683 1.484 (1.461,1.507) .001 0.032 0.0027 Polymyalgia rheumatica (725) 11 19 0.593 (0.296,1.061) .999 1.000 0.999 27 28 0.948 (0.625,1.379) .999 1.000 0.999 (Continues)
MSD sites
CM codes)
Male
Female
Number of incident cases Standardized incidence ratio (SIR) Multiple testing P- values Number of incident cases Standardized incidence ratio (SIR) Multiple testing P- values
Observed Expected SIR (95%CI) value Bonferroni FDR Observed Expected SIR (95%CI) value Bonferroni FDR
Peripheral enthesopathies and allied syndromes (726)
5850 5323 1.099 (1.071,1.128) .001 0.032 0.003 8283 6292 1.316 (1.288,1.345) .001 0.032 0.003 Disorders of synovium, tendon, and bursa (727) 7220 6398 1.129 (1.103,1.155) .001 0.032 0.003 9792 7370 1.329 (1.302,1.355) .001 0.032 0.003
Disorders of muscle, ligament, and fascia (728)
3136 3312 0.947 (0.914,0.981) .010 0.320 0.023 4183 3910 1.070 (1.038,1.103) .001 0.032 0.003
Other disorders of soft tissues (729)
15 831 12 493 1.267 (1.248,1.287) .001 0.032 0.003 20 673 13 619 1.518 (1.497,1.539) .001 0.032 0.0027
Osteomyelitis, periostitis, and infections involving bone (730)
231 271 0.852 (0.745,0.969) .050 1.000 0.076 126 119 1.061 (0.884,1.264) .999 1.000 0.999
Osteitis deformans and osteopathies associated with other disorders (731)
23 19 1.224 (0.776,1.837) .999 1.000 0.999 20 13 1.599 (0.977,2.469) .999 1.000 0.999 Osteochondropathies (732) 47 65 0.729 (0.535,0.969) .050 1.000 0.076 11 23 0.471 (0.235,0.842) .010 0.320 0.020
Other disorders of bone and cartilage (733)
806 854 0.944 (0.880,1.011) .999 1.000 0.999 1344 1199 1.121 (1.062,1.182) .001 0.032 0.003 Flat foot (734) 85 95 0.891 (0.712,1.102) .999 1.000 0.999 21 30 0.710 (0.439,1.085) .999 1.000 0.999
Acquired deformities of toe (735)
42 47 0.896 (0.646,1.211) .999 1.000 0.999 202 164 1.234 (1.070,1.416) .010 0.320 0.020
Other acquired deformities of limbs (736)
166 184 0.903 (0.771,1.051) .999 1.000 0.999 118 104 1.139 (0.943,1.364) .999 1.000 0.999 Curvature of spine (737) 376 384 0.979 (0.882,1.083) .999 1.000 0.999 685 676 1.013 (0.939,1.092) .999 1.000 0.999 Other acquired deformity (738) 349 405 0.861 (0.773,0.956) .010 0.320 0.023 525 519 1.011 (0.926,1.101) .999 1.000 0.999
allopathic lesions, not
elsewhere classified (739) 31 58 0.533 (0.362,0.756) .001 0.032 0.003 42 63 0.672 (0.484,0.908) .010 0.320 0.020
Abbreviations: FDR, false discovery rate; MSD, Musculoskeletal disorder.
TABLE 3
characteristic of prolonged standing as the FBSI workers, this might explain why female FBSI workers did not show an increased risk of peripheral vascular diseases, while male FBSI workers tended to experience prolonged standing and thus had higher risk of peripheral vascular diseases than the general population.
Conversely, female workers, but not male workers, had significantly higher risks of osteoarthrosis and allied disor-ders (ICD- 9 715); arthropathies (ICD- 9 716); disordisor-ders of joint (ICD- 9 719); disorders of muscle, ligament, and fascia (ICD- 9 728); other disorders of bone and cartilage (ICD- 9 733); and acquired deformities of toe (ICD- 9 735). A study reported that female workers showed higher muscular ac-tivity related to maximal voluntary contractions than male counterparts with identical repetitive tasks.26 Another study noted that female workers tended to have less opportunity to relax and exercise outside of work.27 More studies are needed to clarify gender difference in MSDs. The current study's findings would facilitate priority setup with regard to gender and anatomic sites.
Our study also presents sub- industrial- specific and cook-ing certificate type- specific SIRs of all- cause MSD to iden-tify the sub- segments or cooking certificate types at higher risk of MSDs. Regarding SIRs of sub- industrial segments, all segments showed significantly higher SIRs compared with the general population, except male workers in other food and beverage service. The interaction of gender and sub- segment was also assessed. Food stall workers of both gender had the highest SIRs. Unlike restaurant workers, food stall workers
had long working hours and working days due to less man-power, and may have little knowledge about MSDs,28 possi-bly leading to the highest risk. Male workers in non- alcoholic beverage shops had the second highest risk (SIR 1.387), while female workers ranked last (SIR 1.509) in this segment. Even though female workers in non- alcoholic beverage shops had the least risk of these segments, it was higher than in any segment for male workers (Table 4). Chen et al reported 12- month prevalence of MSDs among Taiwanese custom beverage vendors of 88.6%, with the highest rate for hand/ wrist disorders. Female workers had significantly higher risk than male counterparts regarding hand/wrist and low back/ waist disorders. They also found that the repetitive activity of beverage shaking for each wrist was as high as 4 times for 10 seconds for a cup preparation. Although the work does not require forceful movement, the repetitiveness, high frequency, and awkward wrist postures pose a great risk of hand/wrist disorders.29
Regarding SIRs of cooking certificate types, workers with certificates had higher risk than those without. This result was similar to that of a study investigating MSDs in New York City restaurants.12 The study found that workers in “back of the house” positions, eg, cooks and chefs, had higher MSD prevalence than those in “front of the house” positions, eg, waitresses/waiters and counter people, who are unlikely to have certificates, especially regarding hand (53% vs 40%), wrist (51% vs 40%), forearm (36% vs 27%), and elbow (27% vs 17%) disorders.12 All types of certificates showed significantly higher SIRs than the general population,
TABLE 4 Standard incidence ratio of all- cause MSDs in male and female workers in the food and beverage services industry (by sub-
industries categories and types of licenses) in Taiwan, 2000- 2014
Male Female
Observed Expected SIR (95%CI) Observed Expected SIR (95%CI)
All- cause MSDs 34 313 20 111 1.706 (1.688,1.724) 42 398 19 290 2.198 (2.177,2.219) Major sub- industrial categories
Restaurants 30 771 22 551 1.364 (1.349,1.380) 36 953 21 685 1.704 (1.687,1.722) Non- alcoholic
beverage services 3042 2192 1.387 (1.339,1.438) 4776 3166 1.509 (1.466,1.552) Food stall services 400 271 1.475 (1.334,1.627) 561 324 1.733 (1.593,1.883) Other food and
beverage services 100 84 1.187 (0.966,1.444) 108 70 1.553 (1.274,1.875) Types of cooking licenses
No 25 458 18 874 1.349 (1.332,1.366) 36 749 22 165 1.658 (1.641,1.675) Yesa 8855 6225 1.422 (1.393,1.452) 5649 3079 1.835 (1.787,1.883)
Chinese cuisine 8287 5819 1.424 (1.394,1.455) 5051 2709 1.865 (1.814,1.917) Baking 716 475 1.508 (1.400,1.623) 997 575 1.733 (1.627,1.844) Western cuisine 375 279 1.344 (1.212,1.487) 119 76 1.562 (1.294,1.869) Other cooking license 40 31 1.297 (0.927,1.766) 99 59 1.687 (1.371,2.054)
Abbreviations: CI, confidence interval; SIR, standardized for age and calendar year. aNot mutually exclusive.
except male workers with other cooking certificates. The two certificates with the highest risk were Chinese cuisine and baking. Xu et al noted that the work of cooks in Chinese restaurants requires more prolonged grasping of cooking utensils and tossing from a wok than work in western restau-rants.9 This forceful movement of hands, wrists, and forearms can increase the likelihood of MSDs. Regarding bakers, their work incudes manual dough handling, prolonged standing, and high repetitiveness, causing numerous MSDs especially hand/wrist, shoulder, and back.30,31
The strengths of this study were the long study period (15 years), inclusion of all MSDs and two other disease groups associated with work repetitiveness and overexer-tion, estimation of SIRs using the general population as a reference, and presentation of sub- industrial- specific and cooking- certificate- type- specific SIRs. These aspects were seldom investigated in previous studies, and they allowed for a comprehensive understanding of FBSI- related MSDs. This study's findings could facilitate priority setup regarding gen-der, anatomic site, sub- industrial type, and certificate type. MSDs were studied on a large scale (industry level), not a small scale (individual organization). Relevant policy and/or ergonomic improvements and interventions could be imple-mented on target populations at the pertinent body sites.
Several limitations of this study should be considered in result interpretation. First, given the limitation of health in-surance administrative claim database, information regard-ing the causes of MSDs, includregard-ing personal factors (diet, hobbies, and fitness), and work- related characteristics was not available. In addition, we may use ICD- 9- CM diagno-sis codes to identify the occurrence of MSDs, but may not be able to identify or analyze MSDs with stage of the sever-ity. Second, the reference population may include high- risk groups for certain MSDs. This could nullify the FBSI effect on MSDs. For example, female FBSI workers did not show an increased risk of other and unspecified peripheral vascular disease, since other occupations involving prolonged stand-ing, such as nurses and cleaners, employ many female work-ers. Understanding the work characteristics in each industry sector is important. Third, concern about discrepancy in the National Labor Insurance type and work task could bias our results. Some workers in the target population (FBSI) may perform other jobs, and some workers in the reference group performed jobs similar to FBSI jobs. Abiding by the Labor Insurance Law, most workers are insured under the industry to which they belong. Therefore, the proportions of these two subpopulations were small, and the effect was minor. Fourth, because the National Labor Insurance data did not consist the size of the enterprise information, we were not able to analyze if the sizes of the enterprise affect risks of MSDs. Finally, we only captured the first incident MSD event after the first date of National Labor Insurance Enrollment. The second or third and sequence prevalent MSD events may not
be included and estimated. This would be the potential lim-itation for underestimating the magnitude of MSD disease burden among workers in FBSI industry. Future study may investigate this issue thereafter.
5
|
CONCLUSION
Through use of five nationwide population- based databases, the present study estimated SIRs to characterize and under-stand WMSD risk for FBSI workers compared with the gen-eral population. The findings allowed for a comprehensive understanding of WMSDs in the FBSI sector, and showed that FBSI workers had increased risk of disorders of soft tissues and back. Food stall workers and workers with a Chinese cuisine or baking license were at higher risk among sub- industrial categories and certificate types, respectively. Gender differences were found in incidence rate, SIR, and anatomic site. This information helps identify the target pop-ulation and prioritize MSD problems. Relevant policy and/or ergonomic improvements and interventions could be imple-mented on the target population at pertinent body sites. ACKNOWLEDGMENTS
This study was supported by the Occupational Safety and Health, Ministry of Labor (ILOSH- 103- 3002, ILOSH- 105- 0007, and ILOSH- 106- 0012), and partially by the Ministry of Science and Technology grant (MOST 109- 2423- H- 037- 001- SS3). We thank the Center for Medical Informatics and Statistics of Kaohsiung Medical University for providing administrative and funding support. None of which had any role in study design, data collection and analy-sis, decision to publish, or preparation of the manuscript. DISCLOSURE
Ethical approval: This study was approved by the Institutional
Review Board at Kaohsiung Medical University Hospital (KMUHIRB- E(I)- 20170116). Informed consent: N/A; Registry
and the Registration No. of the study/Trial: N/A; Animal Studies: N/A; Conflict of Interest: We assure that each author
meets authorship requirements. We declare that none of the authors has any conflict of interest with regard to this manu-script. Financial Disclosure: The authors declare that they have no conflict of interest. (For Original Research Only) Specific
contributions: Conception or design of the work, the acquisi-tion, and analysis: HMH, CYP, MYL, and CHP; Interpretation of data for the work: HMH, CYP, CLW, and LJL; Revising it critically: HMH, CYP, CLW, LJL, CHP, and MTW; Final ap-proval: HMH, CYP, CLW, LJL, CHP, MTW, and MYL.
ORCID
Hui- Min Hsieh https://orcid.org/0000-0003-3286-7306
REFERENCES
1. HaS Executive. Work- related Musculoskeletal Disorders (WRMSDs) Statistics in Great Britain. 2017. Available at https://wwwhs egovu k/ stati stics/ causd is/msdpdf (Accessed on 2019/12/03) 2017
2. Eu- OSH. Work- related musculoskeletal disorder in the EU: Facts and Figures. 2010. Available at https://oshae uropa eu/en/publi catio ns/osh- figur es- work- relat ed- muscu loske letal - disor ders- eu- facts - and- figures (Accessed on 2020/12/11)
3. Centers for Disease Control and Prevention. Workplace Health in America 2017. Atlanta, GA: Services USDoHaH; 2018.
4. Ministry of Labor Repbulic of China. Statistics of Occupational Disease from the notification system; 2019.
5. Shiue HS, Lu CW, Chen CJ, et al. Musculoskeletal disorder among 52,261 Chinese restaurant cooks cohort: result from the National Health Insurance Data. J Occup Health 2008;50(2):163- 168.[pub-lished Online First: 2008/04/12]
6. Subramaniam S, Murugesan S. Investigation of work- related musculoskeletal disorders among male kitchen workers in South India. Int J Occup Saf Ergon. 2015;21(4):524- 531. https://doi. org/10.1080/10803 548.2015.1096063
7. Xu YW, Cheng AS. Prevalence and risk factors of work- related musculoskeletal disorders in the catering industry: a systematic review. Work (Reading, Mass). 2013;48(4):539- 545. https://doi. org/10.3233/wor- 131805
8. Xu YW, Cheng AS. An onsite ergonomics assessment for risk of work- related musculoskeletal disorders among cooks in a Chinese restau-rant. Work. 2014;48(4):539- 545. https://doi.org/10.3233/wor- 131805 9. Xu YW, Cheng AS, Li- Tsang CW. Prevalence and risk factors of
work- related musculoskeletal disorders in the catering industry: a systematic review. Work (Reading, Mass). 2013;44(2):107- 116. https://doi.org/10.3233/wor- 2012- 1375
10. Tomita S, Muto T, Matsuzuki H, et al. Risk factors for frequent work- related burn and cut injuries and low back pain among com-mercial kitchen workers in Japan. Ind Health 2013;51(3):297- 306. [published Online First: 2013/02/07]
11. Chyuan JY, Du CL, Yeh WY, et al. Musculoskeletal disorders in hotel restaurant workers. Occupational Med. 2004;54(1):55- 57. 12. Jayaraman S, Dropkin J, Siby S, et al. Dangerous dining: health and
safety in the New York City restaurant industry. J Occup Environ Med. 2011;53(12):1418- 1424.
13. Udaltsova N, Silverberg MJ. SAS® Macros for Standard Incidence Ratio Calculation.2014. Available at https://www.lexja nsen.com/ wuss/2014/33_Final_Paper_PDF.pdf (Accessed on 2017/10/12). 14. Gardner MJ, Altman DG. Estimating with confidence. In: Books
BMJ, ed. Statistics with confidence: Confidence intervals and sta-tistical guidelines. Great Britain; 1989.
15. Ulm K. A simple method to calculate the confidence inter-val of a standardized mortality ratio (SMR). Am J Epidemiol. 1990;131(2):373- 375.
16. Shaffer JP. Multiple hypothesis testing. Annu Rev Psychol. 1995;46:561- 584.
17. Dini M, Parks CB. Plantar fasciitis. Medical encyclopedia. Bethesda, MD: U.S. National Library of Medicine; 2018. https:// acces smedi cine.mhmed ical.com/conte nt.aspx?booki d=2683&-secti onid=22388 2062.
18. Vorvick LJ. Muscle aches. Medical encyclopedia. Bethesda, MD: U.S. National Library of Medicine; 2019. https://medli neplus.gov/ ency/artic le/003178.htm.
19. Starkebaum GA. Ankylosing spondylitis. Medical Encyclopedia. Bethesda, MD: U.S. National Library of Medicine; 2018.
20. Parot- Schinkel E, Descatha A, Ha C, et al. Prevalence of multisite musculoskeletal symptoms: a French cross- sectional working population- based study. BMC Musculoskelet Disord. 2012;13:122. https://doi.org/10.1186/1471- 2474- 13- 122
21. Joseph N, B A, Faizan Thouseef M, et al. A multicenter review of epidemiology and management of varicose veins for national guidance. Ann Med Surg (Lond). 2016;8:21- 27. https://doi. org/10.1016/j.amsu.2016.04.024
22. Capodaglio EM. Occupational risk and prolonged standing work in apparel sales assistants. Int J Ind Ergon. 2017;60:53- 59. https://doi. org/10.1016/j.ergon.2016.11.010
23. Jung S, Kim Y, Kang D, et al. Distribution of working position among workers with varicose veins based on the National Health Insurance and National Employment Insurance data. Annals Occupational Environmental Med. 2020;32:e21. https://doi. org/10.35371/ aoem.2020.32.e21
24. Huo Yung Kai S, Ferrières J, Carles C, et al. Lower limb venous and arterial peripheral diseases and work conditions: systematic review. Occup Environ Med. 2021;78(1):4- 14.
25. Tüchsen F, Hannerz H, Burr H, et al. Prolonged standing at work and hospitalisation due to varicose veins: a 12 year prospective study of the Danish population. Occup Environ Med. 2005;62(12):847- 850. https://doi.org/10.1136/oem.2005.020537
26. Nordander C, Ohlsson K, Balogh I, et al. Gender differences in workers with identical repetitive industrial tasks: exposure and musculoskeletal disorders. Int Arch Occup Environ Health. 2008;81(8):939- 947.
27. Strazdins L, Bammer G. Women, work and musculoskeletal health. Soc Sci Med. 2004;58(6):997- 1005.
28. Mukul Khutale AJ. Prevalence of musculoskeletal disorders in food stall workers. Indian J Public Health Res Develop. 2020;11(5):244- 248.
29. Chen Y- L, Ou Y- S. A case study of Taiwanese custom- beverage workers for their musculoskeletal disorders symptoms and wrist movements during shaking task. Int J Ind Ergon. 2020;80:103018. https://doi.org/10.1016/j.ergon.2020.103018
30. Chen Y- L, Zhong Y- T, Liou B- N, et al. Musculoskeletal disorders symptoms among Taiwanese Bakery Workers. Int J Environ Res Public Health. 2020;17(8):2960.
31. Mehrizi MM, Ebrahemzadih M, Tajvar A, et al. Survey of prev-alence and risk factors associated with upper extremity musculo-skeletal disorders by repetitive job activities methods in baker of Iran. Health. 2014;6:3030- 3036.
How to cite this article: Peng C-Y, Hsieh H- M, Li M- Y, et al. Gender differences and site- specific incident risks of musculoskeletal disorders among 224 506 workers in the food and beverage service industry in Taiwan: A 15- year Nationwide Population- Based Cohort Study. J Occup Health. 2021;63:e12214. https:// doi.org/ 10.1002/1348- 9585.12214