MBoC |
ARTICLE
Conformational plasticity of JRAB/MICAL-L2
provides “law and order” in collective cell
migration
ABSTRACT In fundamental biological processes, cells often move in groups, a process termed collective cell migration. Collectively migrating cells are much better organized than a ran-dom assemblage of individual cells. Many molecules have been identified as factors involved in collective cell migration, and no one molecule is adequate to explain the whole picture. Here we show that JRAB/MICAL-L2, an effector protein of Rab13 GTPase, provides the “law and order” allowing myriad cells to behave as a single unit just by changing its conformation. First, we generated a structural model of JRAB/MICAL-L2 by a combination of bioinformatic and biochemical analyses and showed how JRAB/MICAL-L2 interacts with Rab13 and how its conformational change occurs. We combined cell biology, live imaging, computational biology, and biomechanics to show that impairment of conformational plasticity in JRAB/ MICAL-L2 causes excessive rigidity and loss of directionality, leading to imbalance in cell group behavior. This multidisciplinary approach supports the concept that the conforma-tional plasticity of a single molecule provides “law and order” in collective cell migration.
INTRODUCTION
In biological processes such as embryonic morphogenesis, wound repair, and vascularization, cells often move in groups, a process termed collective cell migration (Friedl and Gilmour, 2009; Gray
Monitoring Editor Kozo Kaibuchi Nagoya University Received: May 26, 2016 Revised: Aug 19, 2016 Accepted: Aug 23, 2016 Ayuko Sakanea, Shin Yoshizawab, Masaomi Nishimurab, Yuko Tsuchiyac,†, Natsuki Matsushitad,‡,
Kazuhisa Miyakea, Kazuki Horikawae, Issei Imotof, Chiharu Mizuguchig, Hiroyuki Saitog,§,
Takato Uenoh, Sachi Matsushitad, Hisashi Hagah, Shinji Deguchii,||, Kenji Mizuguchic, Hideo Yokotab,
and Takuya Sasakia,*
aDepartment of Biochemistry, eDepartment of Optical Imaging, fDepartment of Human Genetics, Graduate School of
Medical Sciences, and gInstitute of Biomedical Sciences, Graduate School of Pharmaceutical Sciences, Tokushima
University, Tokushima 770-8503, Japan; bImage Processing Research Team, RIKEN Center for Advanced Photonics,
RIKEN, Wako 351-0198, Japan; cNational Institutes of Biomedical Innovation, Health and Nutrition, Ibaraki 567-0085,
Japan; dTranslational Research Center, Ehime University Hospital, Ehime 791-0295, Japan; hTransdisciplinary Life
Science Course, Faculty of Advanced Life Science, Hokkaido University, Sapporo 770-8503, Japan; iLaboratory for
Mechanobiology and Bioengineering, Graduate School of Engineering, Nagoya Institute of Technology, Nagoya 466-8555, Japan
et al., 2010; Mayor and Carmona-Fontaine, 2010; Rorth, 2012; Theveneau and Mayor, 2012). This phenomenon is also a common mechanism of cancer invasion (Sahai, 2005; Friedl et al., 2012).
This article was published online ahead of print in MBoC in Press (http://www .molbiolcell.org/cgi/doi/10.1091/mbc.E16-05-0332) on August 31, 2016. The authors declare no conflict of interest.
Present addresses: †Institute for Protein Research, Osaka University, Suita 565-0871, Japan; ‡Department of Biology, School of Medicine, Aichi Medical University, Aichi 480-1195, Japan; §Department of Biophysical Chemistry, Kyoto Pharmaceutical University, Kyoto 607-8414, Japan; ⃦Division of Bioengineering, Osaka University, Toyonaka 560-8531, Japan.
A.S. and T.S. conceived the research project and designed the experiments. A.S. performed most of the biochemical and cell biological analyses with assistance from K.M. and T.S. S.Y., M.N., and H.Y. performed the computational analyses. Y.T. and K.M. performed the bioinformatics analyses. S.D. performed the traction force experiments. C.M. and H.S. performed the ANS analysis. K.H. designed and prepared the JRAB indicator for FRET imaging analyses. S.M. and N.M. generat-ed lentivirus for gene expression. T.U. and H.H. performgenerat-ed 3D cell culture in
© 2016 Sakane et al. This article is distributed by The American Society for Cell Biology under license from the author(s). Two months after publication it is avail-able to the public under an Attribution–Noncommercial–Share Alike 3.0 Unported Creative Commons License (http://creativecommons.org/licenses/by-nc-sa/3.0). “ASCB®,” “The American Society for Cell Biology®,” and “Molecular Biology of the Cell®” are registered trademarks of The American Society for Cell Biology. Abbreviations used: ANS, 8-anilino-1-naphthalenesulfonic acid; CC, coiled coil; CDR, complementarity-determining region; CH, calponin homology; CT, C-terminal; FA, focal adhesion; His, hexahistidine; JRAB, junctional Rab13-binding protein; MICAL-L2, molecules interacting with CasL-like 2; PCA, principal compo-nent analysis; PDB, Protein Data Bank; WT, wild type.
collagen gel. I.I. performed the statistical analyses. A.S., S.Y., and T.S. primarily wrote the manuscript, and Y.T., K.M., H.S., SD, H.H., and K.H. assisted with this task. All authors commented on the manuscript.
the SF4 region and identified three: Rab3A–Rabphilin3A (PDBID: 1zbd), Rab27B–Slac2-1/melanophilin (2zet), and Rab27A–Slp2-a/ Exophilin4 (3bc1). The Rab-binding sites of all three effector pro-teins consist of several helices. A structural alignment of the three effector proteins was generated using Mustang (Konagurthu et al., 2006) to extract common structural features. We next generated a sequence alignment of JRAB/MICAL-L2 from seven species (UniProt ID: Q8IY33 [Homo sapiens], G5BUG1 [Heterocephalus glaber], Q3TN34 [Mus musculus], G3GVG4 [Cricetulus griseus], D3ZEN0 [Rattus norvegicus], L5KC08 [Pteropus alecto], and L8Y7J9 [Tupaia chinensis]) using ClustalW (Thompson et al., 1994). Alignment of the effectors with the JRAB C-terminal fragments (corresponding to aa 880–1009 in mouse) was generated using Fugue (Shi et al., 2001), based on the structural alignment of the three effector proteins and their amino acid sequence information and on the sequence align-ment of JRAB/MICAL-L2 from the seven species. In this alignalign-ment, the helical regions of the three effectors are aligned well with those of JRAB/MICAL-L2 predicted earlier, although the sequence simi-larities between JRAB/MICAL-L2 and the other effector proteins are low, suggesting that helices 2, 3, and 5 and loop 4 have the poten-tial to bind to Rab13 (Supplemental Figure S1E).
To corroborate the prediction from the bioinformatic analysis, we performed biochemical experiments. First, we prepared several de-letion mutants of JRAB-C containing the putative helical regions in various combinations according to the secondary structure predic-tion described earlier. Pull-down assays using JRAB-C mutants revealed that helices 2–5 and part of loop 4 (following helix 5) are required for binding of JRAB-C to activated Rab13 (Rab13DA∆C3 was used as a dominant-active mutant; Materials and Methods; Supplemental Figure S1D and Figure 1A), consistent with the pre-dicted result, and that JRAB-N (calponin homology [CH] + LIM) in-teracts with JRAB-C via helices 1 and 2 and the first half of helix 3 (Figure 1B). Finally, we built a rough model of how the structures of JRAB-C, JRAB-N (LIM), and Rab13 could be arranged in three-dimensional (3D) space (Figure 1C) in a manner consistent with all the data from the biochemical experiments and additional predic-tion results (Materials and Methods). Our final model shows that the hydrophobic or negatively charged regions of JRAB-C (enclosed by solid and dotted lines, respectively, in Figure 1C) are involved in the interactions with JRAB-N (LIM) and Rab13, respectively.
Our present structural model of JRAB-C indicates that JRAB-N (CH + LIM) and Rab13 competitively bind to helices 2 and 3 of JRAB-C, although our previous data showed that JRAB-N interacts with the region indicated as coiled coil (CC; aa 806–912) in JRAB-C, whereas Rab13 associates with JRAB-C via the C-terminal (CT; aa 913–1009), the region just after CC (Sakane et al., 2010). To verify our new prediction, we performed pull-down assays. The presence of either hemagglutinin (HA)-Rab13DA or hexahistidine (His)-tagged Rab13DA∆C3 recombinant protein inhibited the interaction be-tween green fluorescent protein (GFP)–JRAB-C and glutathione S-transferase (GST)–JRAB-N (CH + LIM; Figure 1, D and E), indicating that activated Rab13 displaces JRAB-N (CH + LIM). In other words, the intramolecular interaction between JRAB-N and JRAB-C is dis-rupted competitively by the binding of Rab13 to JRAB-C.
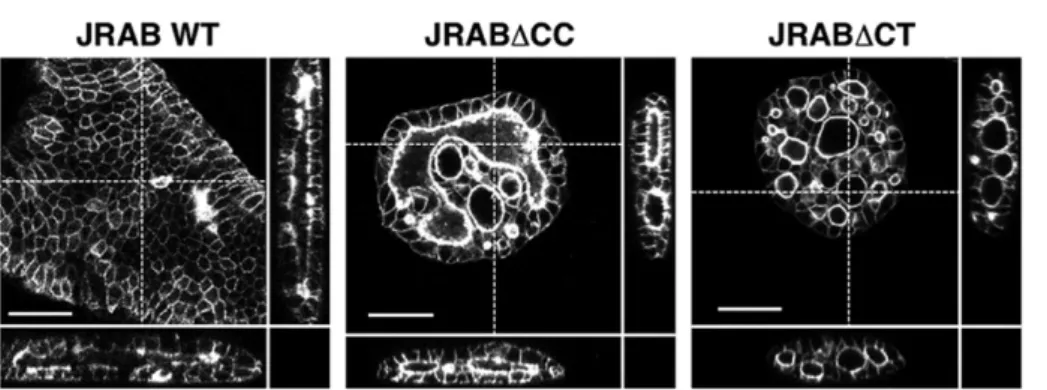
JRAB/MICAL-L2 conformational mutants, JRAB∆CT and JRAB∆CC, adopt a closed and an open form, respectively
We previously developed two deletion mutants of JRAB/MICAL-L2: JRAB∆CT, which lacks the CT domain (aa 913–1009), and JRAB∆CC, which lacks the CC domain (aa 806–912; Sakane et al., 2010). In this study, we found that CT does not cover the full region associated with Rab13, that is, JRAB∆CT maintains a part of Rab13-binding Collectively migrating cells are much better organized than a
random assemblage of individual cells. Therefore some factor or factors must impose a certain “law and order” that allows myriad cells to behave as a single unit. Many molecules, including compo-nents of diverse signaling pathways, have been identified as factors in collective cell migration. However, we are far from understanding the whole picture.
Here we focus on the conformational plasticity of a single mole-cule, junctional Rab13-binding protein (JRAB)/molecules interacting with CasL-like 2 (MICAL-L2), to explain the complexity in collectively migrating cells. JRAB/MICAL-L2 is an effector protein of Rab13, a member of the Rab family of small GTPases (Rabs), which serve as molecular switches in the regulation of membrane trafficking (Takai et al., 2001; Zerial and McBride, 2001; Hutagalung and Novick, 2011). Rab13–JRAB/MICAL-L2 is involved in transport of cell adhe-sion molecules and regulation of cell−cell adheadhe-sion in epithelia (Zahraoui et al., 1994; Marzesco et al., 2002; Morimoto et al., 2005; Terai et al., 2006; Yamamura et al., 2008; Sakane and Sasaki, 2015). In addition, JRAB/MICAL-L2 spatiotemporally regulates actin dy-namics (Sakane et al., 2012).
In this study, we use a multidisciplinary approach combining cell biology, live imaging, computational biology, and biomechanics to show that conformational plasticity of JRAB/MICAL-L2 is critical for the “law and order” underlying integrated collective cell migration. We also provide a structural model for JRAB/MICAL-L2 and eluci-date the basis of its conformational change via a combination of bioinformatic and biochemical analyses.
RESULTS
Structural modeling of JRAB/MICAL-L2 via a combination of bioinformatic and biochemical analyses
Previously we used biochemical analyses to propose a model in which JRAB/MICAL-L2 adopts the closed form via intramolecular interaction and the conformation can be changed into the open form by interaction with activated Rab13 (Sakane et al., 2010). To further support our hypothesis (and since crystallization of recombi-nant JRAB/MICAL-L2 has been challenging), we sought to build a structural model of JRAB/MICAL-L2 in complex with Rab13 by a combination of bioinformatic and biochemical analyses.
Secondary structure prediction (PSIPRED; Jones, 1999) and dis-order prediction (POODLE-S; Shimizu et al., 2007) of the C-terminal portion of JRAB-C (amino acids [aa] 806–1009) suggested that both ends of JRAB-C are intrinsically disordered and the intervening se-quence contains three helical regions (Supplemental Figure S1, A and B). For convenience, we divided the last two helical regions, which are long (∼50 residues), into two parts based on the second-ary structure prediction, separating JRAB-C into five putative helices (helix 1, aa 843–872; 2, aa 880–900; 3, aa 901–928; 4, aa 937–960; and 5, aa 961–984) and four loop regions (loop 1, aa 806–842; 2, aa 873–879; 3, aa 929–936; and 4, aa 985–1009; Supplemental Figure S1, A and B).
Generally, five Rab family (RabF) regions distinguish Rab proteins from other proteins of the Ras superfamily, and four Rab subfamily– specific (RabSF) regions are highly conserved within each of the Rab subfamilies, that is, clusters of related Rab proteins (Pereira-Leal and Seabra, 2000). We found that the C-terminal RabSF4 region of Rab13 is involved in binding to JRAB/MICAL-L2, its effector (Sup-plemental Figure S1, C and D; Materials and Methods). We then hypothesized that the structure of other Rab–effector complexes, in which the SF4 region of Rab interacts with the effector, may be simi-lar to that of Rab13-JRAB/MICAL-L2. We searched the Protein Data Bank (PDB) for structures of Rab–effector complexes associated via
region (aa 877–912). Therefore we sought to examine whether JRAB∆CT and JRAB∆CC exhibit closed and open forms, respectively, as we expected.
First, we performed pull-down assays us-ing GST-JRAB-C, as reported in our previous study (Sakane et al., 2010; Figure 2A). As expected, GFP-JRAB∆CC was pulled down by GST-JRAB-C, whereas GFP-JRAB∆CT was not. GFP-JRABwt (wild type) was also pulled down by GST-JRAB-C but less effi-ciently than GFP-JRAB∆CC. Next we puri-fied the recombinant His-tagged JRABwt and mutants from HEK293 cells and applied them to a gel filtration column that sepa-rates proteins according to their molecular size—larger proteins elute in earlier frac-tions. Although the molecular weights of JRAB∆CC and JRAB∆CT are almost the same and both are smaller than JRABwt, as clearly shown by SDS–PAGE, JRAB∆CC eluted in an earlier fraction than JRABwt and JRAB∆CT (Figure 2B). JRAB∆CC may pass through the column faster because it is in an open conformation, resulting in a larger apparent molecular size than the other proteins.
Last, we analyzed the purified proteins by 8-anilino-1-naphthalenesulfonic acid (ANS) fluorescence. The fluorescence emis-sion of ANS increases when it is bound to an accessible hydrophobic surface or cavity of a protein (Stryer, 1965). JRAB∆CC in-duced a slight enhancement in ANS fluo-rescence relative to JRABwt and JRAB∆CT (Figure 2C), indicating that it has more hy-drophobic surface accessible to ANS than the other two proteins. Together these results demonstrate that JRAB∆CT and JRAB∆CC adopt closed and open forms, respectively.
Inhibition of JRAB/MICAL-L2 conformational plasticity alters the “dancing style” of cell groups during wound healing
To examine the involvement of JRAB/ MICAL-L2 conformational plasticity in col-lective cell migration, we confirmed that there is no great difference in expression level between MTD-1A cells stably ex-pressing GFP-tagged JRABwt, JRAB∆CC,
FIGURE 1: Computational structural model of the JRAB-C-JRAB-N and JRAB-C-Rab13 complex based on biochemical and bioinformatic analyses. (A, B) HEK293 cell lysates containing indicated GFP-tagged JRAB C-terminal deletion mutants were subjected to pull-down assays using GST-Rab13DA∆C3 (A) or GST-JRAB-CH + LIM (B). The pulled-down proteins were detected by Western blotting (WB) using an anti-GFP antibody. The schema indicates each mutant, the position of each helix structure (h), and its affinity for Rab13DA∆C3 (A) or JRAB-CH + LIM (B). **GFP-JRAB-C; *GFP-JRAB-CC. The amount of purified recombinant protein, GST-Rab13DA∆C3 (A) or GST-JRAB-CH + LIM (B), attached to glutathione-Sepharose beads was analyzed by SDS–PAGE, followed by Coomassie brilliant blue (CBB) staining. Arrowhead indicates GST-JRAB-CH + LIM. (C) Computational structural models of JRAB-C–Rab13 and JRAB-C–JRAB-N (LIM) based on biochemical data and the structure of three Rab–effector complexes registered in the PDB (Rab3A–Rabphilin-3A [PDBID:1zbd], Rab27B–Slac2-1/melanophilin [2zet], and Rab27A– Slp2-a/Exophilin4 [3bc1]). The electrostatic positive and negative regions on molecular surfaces are blue and red, respectively, whereas hydrophobic residues are yellow. The square indicated by the solid line is the LIM-binding site, and the square indicated by the dashed line is the Rab13-binding site. Note that LIM is the minimum domain of the JRAB/MICAL-L2 N-terminal region responsible for the interaction with the JRAB/MICAL-L2 C-terminal region. (D, E) Activated Rab13 releases the intramolecular interaction of JRAB/MICAL-L2. (D) HEK293 cell lysates containing GFP-tagged JRAB-C or -CC with HA-Rab13DA (dominant-active mutant) or HA were subjected to pull-down assays using GST-JRAB-CH + LIM. GFP-JRAB-CC, which lacks a part of the Rab13-binding region, was used as a negative control. The amount of GST-JRAB-CH + LIM attached to glutathione-Sepharose beads was analyzed by SDS–PAGE, followed by CBB staining. Double asterisks and arrowhead indicate GFP-JRAB-C and GST-JRAB-CH + LIM, respectively. (E) HEK293 cell lysates containing GFP-JRAB-C were mixed with His-Rab13DA∆C3 or His-Rab13DN∆C3
(dominant-negative mutant) and subjected to pull-down assays using GST-JRAB-CH + LIM. Pulled-down proteins were detected by WB using an anti-GFP antibody. Amount of GST-JRAB-CH + LIM attached to glutathione-Sepharose beads was analyzed by SDS–PAGE followed by CBB staining. Arrowhead, GST-JRAB-CH + LIM.
the cell cluster expressing JRAB∆CC rather than the others (Sup-plemental Videos S1–S3). We supposed that prominent ruffles without thick F-actin bundles and a zigzag front line of the cluster caused by JRAB∆CC might result in such an appearance.
We also performed a wound-healing assay using MTD-1A cells expressing either Venus-tagged Rab13DA or Venus alone. The be-havior of the cell population expressing Venus-Rab13DA is similar to that of the cell group expressing GFP-JRAB∆CC rather than the and JRAB∆CT previously prepared (Sakane et al., 2012;
Supple-mental Figure S2) and then subjected them to a wound-healing assay, visualized by time-lapse confocal microscopy (Figure 3A and Supplemental Videos S1–S3). Groups of cells expressing GFP-JRAB∆CT migrated strongly in a fixed direction. By contrast, in groups expressing JRAB∆CC, cells formed ruffles one by one and moved in random directions. Clusters of cells expressing GFP-JRABwt exhibited an intermediate phenotype. Note that significant dissociation of cell–cell contact based on E-cadherin was not ob-served in three cell populations (Supplemental Figure S3), although cell–cell contact at the moving front seems to dissociate easily in
FIGURE 2: JRAB/MICAL-L2 conformational mutants, JRAB∆CT and JRAB∆CC, adopt a closed and an open form, respectively. (A) HEK293 cell lysates containing GFP-tagged JRAB variants (WT, ∆CC, ∆CT) were subjected to pull-down assays using GST-JRAB-C. The pulled-down protein, open-form JRAB/MICAL-L2, was detected by WB using an anti-GFP antibody. The amount of GST-JRAB-C attached to
glutathione-Sepharose beads was analyzed by SDS–PAGE, followed by CBB staining. Schematic indicates the putative conformation of JRAB variants. (B) Gel filtration column chromatography. Top, His-tagged recombinant JRAB variants were subjected to SDS–PAGE, followed by CBB staining. Bottom, His-JRAB variants (20 μg) were subjected to Superdex200 PC3.2/8 gel filtration column chromatography. The starting material (or) and fractionated proteins (#3–12) were subjected to SDS–PAGE, followed by CBB staining. The results shown are representative of at least three independent experiments. (C) Top, representative fluorescence emission spectra of ANS bound to His-JRAB variants. Fluorescence spectrum of free ANS in buffer is shown for comparison. Bottom, relative ANS fluorescence intensities of JRAB variants. Values are compared with those of His-JRABwt. For multiple group comparisons, one-way ANOVA followed by the Tukey’s post hoc test was used. Note that His-JRAB∆CC exhibits more enhanced ANS fluorescence than His-JRAB∆CT and -JRABwt, indicating that His-JRAB∆CC adopts a conformation with more hydrophobic surfaces exposed to the solvent.
FIGURE 3: Inhibition of JRAB/MICAL-L2 conformational change alters the “dancing style” of cell groups during wound healing. (A) Confluent monolayers of MTD-1A cells expressing GFP-JRABwt, GFP-JRAB∆CT, or GFP-JRAB∆CC were scratched, followed by observation under a time-lapse microscope for >12 h. Each image was captured at the indicated time (minutes). Scale bar, 50 μm. Video images are shown in Supplemental Videos S1–S3. (B) Volume rendering of MTD-1A cells expressing GFP-JRABwt, GFP-JRAB∆CC, or GFP-JRAB∆CT was prepared using VoTracer software and shown as 3D images consisting of two spatial (XY) axes and one time-lapse (T) axis. Cross-sections of XY and XT planes of the top right 3D image are shown together. (a) GFP-JRABwt, (b) GFP-JRAB∆CT, (c) GFP-JRAB ∆CC. Schematic illustrates the “dancing style” of cells expressing GFP-JRAB∆CT (precision dancing) or GFP-JRAB∆CC (awa-odori). Video images are shown in Supplemental Videos S4–S6.
involvement of Rab13 in the conformational change of JRAB/ MICAL-L2.
We next visualized three sets of time-lapse images of the wound-healing assay (hereafter, JRABwt, JRAB∆CC, and JRAB∆CT) using volume rendering (Figure 3B and Supplemental Videos S4– S6) as 3D images consisting of two spatial (XY) axes and one time-lapse (T) axis. Our visualization revealed notable spatiotemporal dynamics of each group. The rendering results of JRAB∆CC were usually complex, and it was difficult to extract a common denomi-nator from the image set (Figure 3Bc); roughly speaking, they were closer to random than those of JRAB∆CT and JRABwt. The XT-image of JRAB∆CC also revealed the complex dynamics of the population behavior over time (in particular, the boundary
be-tween the population and wound regions). The rendering results and the XT-images of JRAB∆CT and JRABwt contain a layered geometry of gentle slopes, which were geometrically close to a straight line (Figure 3B, a and b), suggesting that their speeds of population movement were close to constant. The main difference be-tween the populations of JRAB∆CT and JRABwt was that the slopes of JRABwt con-tained several holes (Figure 3Ba)—black/ dark regions compared with distinctive slope lines in spatiotemporal space, which are generated by the JRAB∆CC-type be-havior. In other words, the phenotype of JRAB∆CC sometimes breaks into that of JRAB∆CT (the slope of a straight line), resulting in the disruption of the slope. Collectively two conformational mutants exhibit distinctive “dancing styles”; the be-havior of the cell population expressing GFP-JRAB∆CT is akin to precision dancing, whereas that of the cell population ex-pressing GFP-JRAB∆CC resembles awa-odori, Japanese traditional dance (as the song goes, “Dancing fools and watching fools are fools both the same, so why not dance?”; schematics in Figure 3B, b and c). Clusters of cells expressing GFP-JRABwt exhibited an intermediate phenotype (Figure 3Ba).
Roles of the open and closed forms of JRAB/MICAL-L2 in cell clusters during wound healing
To elucidate how the open and closed forms of JRAB/MICAL-L2 exhibit distinctive “danc-ing styles,” we examined in more detail the differences between cell clusters expressing JRAB∆CT and JRAB∆CC. First, we catego-rized the thickness of the actin bundle at the free edge into four classes (++, +, ±, −; ex-amples in Figure 4A) and then counted the number of cells belonging to each class. Statistical analyses revealed that expression of GFP-JRAB∆CT increased the propor-tion of cells in the ++ class, whereas expression of GFP-JRAB∆CC increased the proportion of cells in the − class (Figure 4A, others (Supplemental Figure S4A). In addition, we examined the
conformational change of JRAB/MICAL-L2 under the effect of acti-vated Rab13 in the MTD-1A cell cluster. For this purpose, we pre-pared the GST-tagged JRAB-CC5 (aa 806–960), which is expected to bind to JRAB-CH + LIM but not to Rab13DA according to our model (Figure 1). Pull-down assays using GST-JRAB-CC5 indicated that GST-JRAB-CC5 interacts with GFP-JRAB-CH + LIM but not with GFP-Rab13DA, whereas GST-JRAB-C interacts with both proteins (Supplemental Figure S4B). The same pull-down assays revealed that the expression of Venus-Rab13DA increases the open form of endogenous JRAB/MICAL-L2 in the cluster of MTD-1A cells com-pared with the cluster of the cells expressing Venus-Rab13DN (Supplemental Figure S4C). These observations validated the
FIGURE 4: Roles of the open or closed forms of JRAB/MICAL-L2 in cell clusters during wound healing. (A) Left, classification of the quality of F-actin bundles (++, +, ±, –). Right, histogram showing the proportion of cells in each class. A one-way ANOVA followed by Tukey’s post hoc test was used for multiple group comparisons. Differences were assessed using a two-sided test and considered significant when p < 0.05. (B) Superresolution images of F-actin at the edges of the cell clusters. MTD-1A cells expressing either GFP-JRAB∆CC or GFP-JRAB∆CT were stained with rhodamine–phalloidin (red). Note that cells expressing GFP-JRAB∆CT show several F-actins radiating out from the thick F-actin bundles, whereas cells expressing GFP-JRAB∆CC contain a fine meshwork of F-actin. Boxes, 36.41 × 36.41 × 2.10 μm. (C) Confocal microscopic images of focal adhesion in MTD-1A cells expressing GFP-JRABwt, GFP-JRAB∆CC, or GFP-JRAB∆CT stained with an anti-vinculin antibody (red). Right, enlarged images. Dots and arrowheads indicate premature and mature focal adhesion, respectively. Scale bars, 20 μm. (D) Cell contraction assay visualizes traction forces as wrinkles that appear on the substrate along the borders of colonies. Scale bar, 100 μm. (E) Quantitation of traction force index, defined as the number of wrinkles parallel to colony borders. All differences are statistically significant (means ± SD, the number of analyzed lines drawn perpendicular to different cell colony borders, n = 107, independent experiment number, N = 4–6, p < 0.001; ANOVA followed by Tukey’s post hoc test). (F) Schematic side view of the GFP-JRAB∆CT cell, which induces wrinkles particularly strongly.
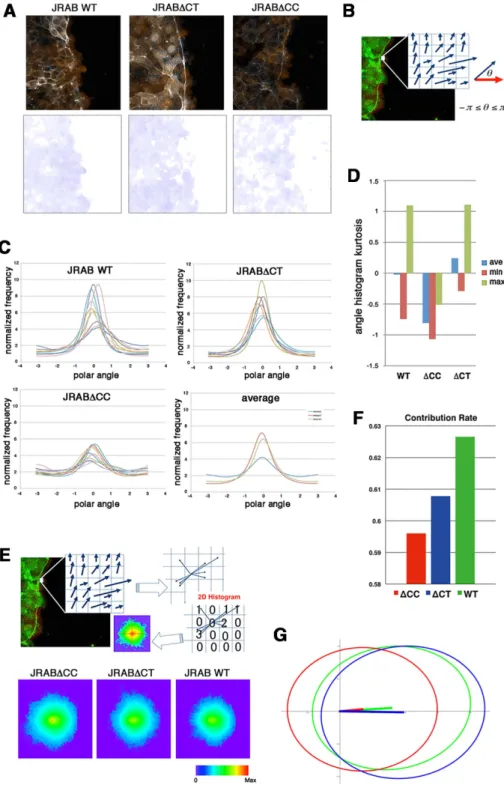
To extract directional characteristics of local motion for each, we examined the angle histogram and its kurtosis (Figure 5, B–D). Most graphs of the histograms were close to a Gaussian distribution, with the exception of a few JRAB∆CC graphs that had another peak located opposite the Gaussian peak (Figure 5C). This pattern indi-cates that the majority of their local motions were in a particular direction, corresponding to the peak of the graph (distribution mean). The JRAB∆CT and JRABwt graphs possess distinctively higher peak values and lower variances than the JRAB∆CC graphs, which are close to flat (Figure 5C). Because the variance of the dis-tribution represents how their directions deviated from the mean, this pattern implies that the JRAB∆CT and JRABwt populations moved anisotropically, whereas the JRAB∆CC population moved more isotropically/randomly. According to the average graphs (Figure 5C), the order of decreasing anisotropy was JRAB∆CT, JRABwt, and JRAB∆CC. The kurtosis graph corroborates these re-sults (Figure 5D). The average kurtosis of JRABwt was very close to zero, and the direction of JRABwt population movement corre-sponded approximately to a Gaussian distribution. All kurtosis values within the JRAB∆CC graphs were less than zero; thus the JRAB∆CC population moved more randomly than the JRAB∆CT and JRABwt populations. The average kurtosis of the JRAB∆CT population was greater than that of JRABwt because the maximum kurtosis was the same but the minimum kurtosis was close to zero; thus the movement of the JRAB∆CT population is more anisotropic than that of the JRABwt population.
Although the angle histogram revealed interesting dynamic features of each cell population (JRAB∆CC, JRAB∆CT, and JRABwt), this analysis used only directional information of speed vectors. Therefore we generated a two-dimensional (2D) motion (median) histogram of the time-varying speed field (Figure 5E and Supplemental Figure S6) and performed principal compo-nent analysis (PCA) in order to simultaneously characterize the speed and direction for each population type. PCA, a multidi-mensional generalization of variance, provides a set of linearly uncorrelated directions and their corresponding magnitudes (eigenanalysis). In other words, the PCA provides information about the distribution of the speed vectors in the spatial domain defined by two unit axes and their corresponding magnitudes. We also used the PCA contribution rate Cr, which evaluates the anisotropy of population dynamics in our case. Here Cr is defined
by λ1/(λ1 + λ2), where the PCA eigenvalues (λ1, λ2) were calcu-lated based on the 2D median histograms using the equations shown in Materials and Methods. The 2D median histograms can be understood as an ellipse with major and minor axes: the two unit PCA axes (eigenvectors) with their corresponding magni-tudes (square root of λ1 and λ2).
Figure 5F shows the PCA contribution rate Cr of the 2D median histograms (Figure 5E, bottom) for each population. If Cr is close to
0.5 (or 1), the population dynamics is isotropic (or anisotropic). Figure 5G illustrates the PCA ellipses for each population. Roughly speaking, the horizontal and vertical axes approximate how the speed and angle of local motions are distributed, respectively. This Cr-based analysis reveals that the JRABwt population was the most efficient (in this study, we consider that a population is efficient if it tends to undergo anisotropic motions), followed by the JRAB∆CT and JRAB∆CC populations. Supplemental Figure S7A shows Cr with
respect to the speed vector averaged over all population types and its corresponding PCA ellipses (see Figure 5, F and G, for compari-son with the in-population PCA results). Although the difference between the JRAB∆CT and JRABwt populations is smaller than those in Figure 5F, the conclusion is the same.
histograms). These results indicate that formation of thick actin bun-dles at the free edge is enhanced by the closed form of JRAB/MI-CAL-L2 but inhibited by the open form.
We next examined the detailed structure of cells at the free bor-der using superresolution microscopy. Superresolution images re-vealed the fine meshwork of filamentous actin (F-actin) generated by JRAB∆CC (Figure 4B, top). In cells expressing GFP-JRAB∆CT, several F-actins radiated from the thick bundle and seemed to project onto the growth surface adjacent to the cell (Figure 4B, bottom).
Therefore we analyzed structures involved in the cell–matrix ad-hesion, that is, focal adhesions (FAs). Cell clusters expressing JRAB∆CT exhibited prominent staining of long, vinculin-positive structures at the free edge, whereas those expressing JRAB∆CC exhibited punctate staining of shorter structures (Figure 4C). Long and short vinculin-positive structures indicate mature and imma-ture FAs, respectively. These results suggest that closed JRAB/ MICAL-L2 may form mature FAs at the tip of F-actins radiating from the thick F-actin bundle. It is conceivable that the traction force is generated in GFP-JRAB∆CT–expressing cell clusters via FAs. To identify the traction force regulated by JRAB/MICAL-L2, we developed silicone elastomer–coated dishes and visualized the traction force as wrinkles (Saito et al., 2014). Prominent wrinkles parallel to the edge were observed around the edges of GFP-JRAB∆CT–expressing cell clusters (Figure 4D). By contrast, wrinkles were seldom observed at the edges of GFP-JRAB∆CC–expressing cell clusters (Figure 4D). According to the traction force index cal-culated from the number of the wrinkles, the constructs could be ranked in order of decreasing strength as follows: JRAB∆CT, JRABwt, and JRAB∆CC (Figure 4E). These data suggest that the closed form of JRAB/MICAL-L2 may be involved in generation of traction force through F-actins radiating outward from the thick bundle in order to pull the cell group (Figure 4F).
Next we investigated the rear cells of each group. At the junc-tional level, the sizes of individual cells (i.e., the areas surrounded by F-actin) were larger in groups expressing GFP-JRAB∆CT than in those expressing GFP-JRAB∆CC or controls (Supplemental Figure S5A). At the basal level, the stress fibers were rarely observed in groups expressing JRAB∆CC; however, expression of GFP-JRAB∆CT enhanced formation of stress fibers (Supplemental Figure S5B). Such actin cytoskeletal regulation mediated by GFP-JRAB∆CT at the basal level may impair the formation of stable cell–cell adhe-sion, resulting in expanded cell area at the junctional level. To con-firm this, we examined spheroid formation by cells expressing each JRAB variant using the hanging-drop culture method (Yonemura, 2014). Cells expressing GFP-JRAB∆CT formed smaller spheroids than those expressing GFP-JRAB∆CC (Supplemental Figure S5C), suggesting that cells expressing the closed form of JRAB/MICAL-L2 have difficulty in maintaining clusters.
Statistical motion analysis of cell populations expressing JRABwt or conformational mutants
To corroborate the significance of conformational plasticity of JRAB/ MICAL-L2 in collective cell migration, we quantitatively analyzed the dynamics of JRAB∆CC, JRAB∆CT, and JRABwt populations using an optical flow approach.
For a given time-lapse image set, the optical flow produced a speed vector field at each time point (i.e., a time-varying speed field), such that the vector at each pixel represented the local motion of cell population (speed and direction; Figure 5A and Supplemental Videos S7–S9). Then the following statistical analyses of these fields were applied to characterize the behavior of each population.
At first glance, the JRAB∆CT population might be expected to be more efficient than the JRABwt population because the former had the highest kurtosis based on our angle analysis (Figure 5, C and D). On the other hand, the speed vector magnitudes, which were not considered in the angle analysis, cause the JRABwt population to have the highest Cr. Therefore we hypothesized that large movements (high-speed local mo-tions) of the JRABwt population would be more concentrated in one direction (i.e., more ordered) than those of the JRAB∆CT population.
Conformational plasticity of JRAB/ MICAL-L2 makes the cell population more efficient in terms of anisotropy in high-speed motions
To test the hypothesis, we first analyzed the speed distributions of each population via a speed histogram (Figure 6A) in which each bin contained the frequency (0–100%) of speed vectors according to magnitude. In Figure 6A, three frequency curves (red, green, and blue, corresponding to
FIGURE 5: Computational analyses of group behavior of cells expressing JRABwt, JRAB∆CC, or JRAB∆CT during wound healing, using an optical flow approach. (A) Speed vector field at each time point. The vector at each pixel represents speed and direction. Video images are shown in Supplemental Videos S7–S9. (B) Directional analysis. The angle is given by the normalized speed vector (blue) and the unit x-axis vector (red). (C) Angle histogram. The horizontal and vertical axes of the angle histogram present angle range (polar angle) and its normalized frequency,
respectively. The angle histogram of different data sets within each population type is indicated by different colors. The angle histogram of the average for GFP-JRABwt, GFP-JRAB∆CC, and GFP-JRAB∆CT is indicated by green, blue, and red, respectively. (D) Kurtosis of angle histogram. The kurtosis of angle histogram was calculated as described in Materials and Methods. The minimum (min; red), maximum (max; green), and average (ave; blue) kurtosis values of the angle histogram within each population type were examined. For a graph of a given function, kurtosis measures its peakedness, which represents sharpness (or bluntness) relative to a Gaussian function. A perfect Gaussian distribution gives ku = 0, and positive (negative) ku corresponds to a
sharper (blunter) shape. (E) Top, 2D motion histogram. For a given time-varying speed vector
field, let the starting points of all vectors be the origin (the center of the 2D histogram). The 2D motion histogram was calculated by counting the vectors whose endpoint was located at each pixel. The 2D motion histograms for all data sets of each population type are shown in Supplemental Figure S6. Bottom, 2D median histogram. The histogram value was converted into a probability distribution by dividing its frequency total in order to normalize the difference in the time length of the data. The median histogram consists of the median values of all motion histograms of each population type and excludes outliers of speed vectors. The spatial space was quantized by intervals of 0.1 (0.1 subpixel). The median histogram is visualized using a pseudocolor image in which color at the pixel xik is given by a Hue color function whose value is equal to log (1+ )fik 1/5. (F) PCA contribution rate Cr. The PCA of the 2D
median histogram for each population with respect to each population average was computed as described in Materials and Methods. Consider the PCA principal values λ1, λ2 ∈ R, λ1 ≥ λ2, and their corresponding principal axes e1, e2 ∈ R2, which are defined
by the eigensystem of a 2 × 2 covariance matrix. The contribution rate of PCA is defined by Cr = λ1/(λ1 + λ2), where 0.5 ≤ Cr
≤ 1. If Cr is close to 0.5 (or 1), then histogram
probabilities are isotropically (or
anisotropically) distributed. (G) PCA ellipses of each population. PCA ellipse consists of the eigenvector and singular values ( λ) of the PCA. Red, JRAB∆CC; green, GFP-JRABwt; blue, GFP-JRAB∆CT.
JRAB∆CC, JRABwt, and JRAB∆CT, respec-tively) closely intersect each other, and we estimated that the JRAB∆CC and JRAB∆CT population frequencies interchanged around a speed of 2, with the JRABwt fre-quency located between them.
According to the speed histogram (Figure 6A), we divided the speed interval into four groups (0 <v ≤0.25, 0.25 <v ≤ 2,
v
2 < ≤3, and 3 <v) of the 2D median histogram, where v is the magnitude of the speed. Figure 6B shows the ratio of speed distributions within each population; as expected, the JRAB∆CT and JRABwt pop-ulations produced much larger movements than did the JRAB∆CC population.
We applied PCA to four speed intervals of the 2D median histogram. Figure 6, C and D, illustrates the PCA contribution rate Cr and the corresponding PCA ellipse for
each speed interval. The Cr of large move-ments ( 2 <v ≤3 and 3 <v) in the JRABwt population were smaller than those of JRAB∆CT (Figure 6C). Note that the major PCA axes of large movements (Figure 6D) are almost orthogonal to those of Figure 5G. Thus smaller Cr (close to 0.5) represents lower variance in movement direction, in contrast to Figure 5G. This observation im-plies that the large local motions in the JRABwt population were more concen-trated in one direction than those of JRAB∆CT (i.e., our hypothesis holds). Sup-plemental Figure S7B corresponds to Figure 6, C and D, and the interpretation remains the same. In fact, further angle analysis (Figure 6E) for each interval revealed the highest kurtosis value in the interval (3 <v) of the JRABwt population. Simultaneous analysis of speed and direction (PCA) showed that large movements, which occu-pied 35–45% of movements according to our speed analysis (Figure 6B), characterize the JRABwt and JRAB∆CT populations. Consequently the JRABwt population is more efficient than the JRAB∆CT popula-tion in terms of anisotropy of high-speed motions (see also Supplemental Figure S7B). Taken together, these data strongly support the idea that conformational plas-ticity of JRAB/MICAL-L2 is required for effi-cient collective cell migration, namely the open or closed form of JRAB/MICAL-L2 alone is insufficient (Figure 6F).
Collective cell migration in collagen gels
Finally, to determine the physiological sig-nificance of JRAB/MICAL-L2 structural plas-ticity in collective cell migration, we used a lentiviral expression system to generate Madin–Darby canine kidney (MDCK) cells
FIGURE 6: PCA for local motion of JRABwt, JRAB∆CC, and JRAB∆CT populations. (A) Speed histogram indicating the frequency (0–100%) of speed vectors in each bin according to magnitude. Inset, zoom at 2. Red, GFP-JRAB∆CC; blue, GFP-JRAB∆CT; green, GFP-JRABwt. (B) Probability of speed vector within four speed intervals. v is the speed magnitude. Blue,
v
0 < ≤0.25; red, 0.25 <v ≤ 2; green, 2 <v ≤3; yellow, 3 <v. (C) PCA contribution rate Cr for each speed interval. Blue, 0 <v ≤0.25; red, 0.25 <v ≤ 2; green, 2 <v ≤3; yellow,
v
3 < . (D) PCA ellipses of each population within four speed intervals. Blue, 0 <v ≤0.25; red, 0.25 <v ≤ 2; green, 2 <v ≤3; yellow, 3 <v. (E) Kurtosis within four intervals:
v
0 < ≤0.25, 0.25 <v ≤ 2, 2 <v ≤3, and 3 <v. Red, JRAB∆CC; blue, GFP-JRAB∆CT; green, GFP-JRABwt. (F) Working model of collective cell migration regulated by JRAB/MICAL-L2 conformational plasticity. The cell population expressing JRAB∆CT exhibits excessive rigidity, whereas the one expressing JRAB∆CC loses directionality. For efficient collective cell migration, JRAB/MICAL-L2 must be able to change its conformation freely depending on the situation. The arrows indicate how each cell population is constrained in terms of its movement (note that these are not speed vectors).
probably via formation of radial F-actins ex-tending from the thick actin bundle fol-lowed by the maturation of FAs (Figure 4F), whereas JRAB∆CC impairs the generation of such force at the edge. The distinctive modes of collective cell migration caused by either JRAB∆CC or JRAB∆CT revealed by volume rendering and kurtosis analysis could be partly explained by such differ-ences. In addition, given the results ob-tained from the PCA contribution rate Cr,
the heterogeneity of the traction force in the cells at the front, which depends on the con-formational plasticity of JRAB/MICAL-L2, may be required for efficient collective cell migration (Figure 6F). We do not know the detailed molecular mechanism allowing the closed form of JRAB/ MICAL-L2 to promote the maturation of FAs. However, there are several possibilities. First, we found several actin-binding proteins (actinin-1, actinin-4, and filamins) preferentially interacting with the open form of JRAB/MICAL-L2. Such interplay between them may keep FAs from being mature. Conversely, the closed form of JRAB/ MICAL-L2, without effects of the association with actinin-1, ac-tinin-4, and filamins, may enhance the formation of FAs. Second, linkage between JRAB/MICAL-L2 and Rho family protein, which is one of the representative regulatory systems of actin cytoskeletal rearrangement, should not be excluded. There may be switching of the activation of Rho family protein, depending on the conforma-tional change of L2; the closed form of JRAB/MICAL-L2 may generate a thick actin bundle with radial F-actins leading to maturation of FAs via activated RhoA, whereas activated Rac may increase focal contact rather than FAs under the effect of the open form of JRAB/MICAL-L2. These possibilities need to be pursued elsewhere.
Next we examined the follower cells and found that JRAB∆CT increased cell size at the junctional level and enhanced the forma-tion of stress fibers at the basal level. The relaforma-tionship between these two effects is unclear, but one possible explanation is that it is difficult for cells expressing JRAB∆CT to maintain stable cell–cell adhesions because the actin cytoskeleton undergoes a spatial shift from cell–cell adhesion to cell–matrix adhesion, as previously re-ported (Maruthamuthu et al., 2011), thereby increasing the area of the cell at the junctional level. On the contrary, the open form of JRAB/MICAL-L2 regulates the actin cytoskeleton to maintain appro-priate cell area at the junctional level (i.e., stable cell–cell junctions), and therefore JRAB∆CC generates fewer stress fibers than JRAB∆CT. The results of the hanging-drop culture assay also suggest that JRAB∆CC maintains more stable cell–cell adhesion, resulting in larger spheroids than those formed by control cells or those ex-pressing JRAB∆CT. We previously showed several lines of evidence suggesting that open-form JRAB/MICAL-L2 maintains more stable cell–cell adhesion than closed-form JRAB/MICAL-L2; actinin-4 pref-erentially interacts with JRAB∆CC, and the interaction between actinin-4 and JRAB∆CC mutually inhibits F-actin bundling activity; and stabilization of F-actin mediated by JRAB-N is impaired by JRAB-C (Sakane et al., 2012). Collectively these findings support our hypothesis.
Finally, we demonstrated the physiological importance of JRAB/ MICAL-L2 conformational plasticity. In general, under 3D condi-tions, cell sheets turn up at the edges, followed by formation of a single lumen. MDCK cell sheets expressing GFP-JRABwt formed flat single lumens, whereas cell sheets expressing GFP-JRAB∆CC or expressing GFP-JRABwt, GFP-JRAB∆CC, or GFP-JRAB∆CT and
performed collagen gel overlay culture (Ishida et al., 2014) with them. Using this method, we observed collective migration from the periphery toward the center of the sheet based on the folding of the sheet of MDCK cells, ultimately resulting in the formation of a lumen structure within the collagen gel. MDCK cells expressing JRABwt formed a lumen as expected, whereas expression of GFP-JRAB∆CC or GFP-JRAB∆CT resulted in formation of multiple lumens (Figure 7). These results demonstrate that deficiency in JRAB/MICAL-L2 conformational plasticity is disadvantageous for collective cell movement in a 3D environment.
DISCUSSION
In this study, we demonstrated that “law and order” in the moving cell population could be provided simply by the conformational plasticity of single molecule, JRAB/MICAL-L2, contrary to all expec-tations. Our accumulated data supported a model in which JRAB/ MICAL-L2 is induced to undergo a conformational change by Rab13; however, definitive proof was lacking, and the mode of inter-play between them remains elusive. Because the recombinant pro-tein of JRAB/MICAL-L2 was extremely hard to crystallize, we verified the model through a combination of bioinformatic and biochemical analyses. Our structural models of complexes (JRAB-C–Rab13 and JRAB-C–JRAB-N) revealed that Rab13 and JRAB-N compete for binding with JRAB-C and that this competition leads to a release of the intramolecular interaction. Consistent with this, wound-healing assays using cells expressing a JRAB/MICAL-L2 fluorescence reso-nance energy transfer (FRET) probe indicated the conformational plasticity of JRAB/MICAL-L2 in populations of moving cells (Supple-mental Figure S8 and Supple(Supple-mental Video S10). Previously we es-tablished two deletion mutants, JRAB∆CC and JRAB∆CT (Sakane et al., 2010). Our present results demonstrated that JRAB∆CT and JRAB∆CC adopt a closed and open form, respectively, based on results from several methods (pull-down assay, ANS analysis, and gel filtration chromatography). Live images of cell sheets revealed that groups of cells expressing GFP-JRAB∆CC or GFP-JRAB∆CT exhibited distinctive movements—awa-odori (Japanese dance–like carnival dance in Rio) or orderly precision dancing, respectively. The results of optical flow followed by kurtosis and PCA analysis demon-strated that in order to achieve well-balanced and efficient migra-tion of cell groups, JRAB/MICAL-L2 must be able to change its con-formation without limitation.
Our detailed investigations of cell populations expressing GFP-JRAB∆CC or GFP-JRAB∆CT revealed the roles of the open and closed forms of L2. The closed form of JRAB/MICAL-L2 generates a traction force at the free edge of the cell population,
FIGURE 7: Three-dimensional collective cell migration in collagen gel. Cross-sectional views, XZ- and YZ-plane are shown together. Scale bars, 50 μm. The results shown are representative of at least three independent experiments.
as previously described, except that GST-JRAB-MID1 (aa 261–393) was used as an antigen (Sakane et al., 2010). Cy3-conjugated sec-ondary antibodies and horseradish peroxidase–coupled secsec-ondary antibodies were obtained from Invitrogen and Jackson Immuno-Research, West Grove, PA, respectively.
Cell culture
MTD-1A cells and MDCK cells were kind gifts from S. Tsukita and W. Birchmeier (Max-Delbrück-Center for Molecular Medicine, Berlin, Germany), respectively. Both cells were cultured in DMEM with 10% fetal bovine serum (FBS), 100 U/ml penicillin, and 100 μg/ml strep-tomycin. HEK293 cells were cultured in DMEM with 5% FBS, 1 mM sodium pyruvate, 100 U/ml penicillin, and 100 μg/ml streptomycin. These cells were maintained at 37°C in a water-saturated atmo-sphere of 95% air and 5% CO2.
Recombinant retrovirus preparation and infection
The pMX-EGFP vector containing JRAB/MICAL-L2 or its mutant, the pMX-JRAB indicator, the pMX-Venus vector containing Rab13DA or Rab13DN, or the pMX-Venus vector alone were transfected into PLAT-E cells as described previously (Morita et al., 2000). After a 48-h transfection, each culture supernatant was collected and fil-trated through a 0.45-μm filter before infection. MTD-1A cells were infected with each recombinant retrovirus separately. After a 48-h culture, cells were subjected to further experiments. For imaging analyses, MTD-1A cells expressing GFP-tagged or Venus-tagged protein or JRAB indicator were selected based on fluorescence intensity and isolated by single-cell sorting on a JSAN desktop cell sorter (Bay Bioscience, Kobe, Japan).
Lentiviral vector–mediated gene expression
A self-inactivating lentiviral expression vector and two packaging-vector plasmids were obtained from the RIKEN BioResource Center (Ibaraki, Japan; Miyoshi et al., 1998). Using the lentiviral expression vector plasmid, lentiviral particles were prepared by standard trans-fection procedures using packaging-plasmid DNAs (pCAG-HIVgp and pCMV-VSV-G-RSV-Rev; RIKEN BioResource Center), and the resulting viral particles were used to introduce the transgene into MDCK cells. After transduction of the transgenes at a multiplicity of infection of 1–2, pools of the cultured cells resistant to blasticidin (20 μg/ ml) were selected and used for experiments. For imaging analyses, MDCK cells expressing GFP-tagged protein were selected based on fluorescence intensity and isolated by single-cell sorting on a JSAN desktop cell sorter (Bay Bioscience).
Wound-healing assay and live-cell imaging
Cells were seeded at a density of 4 × 10⁵ cells on 35-mm glass-based dishes (Matsunami Glass Ind., Kishiwada, Japan) and grown to confluence over 48 h. Wound edges were generated by scratch-ing with a yellow pipette tip. After scratchscratch-ing, cells were washed three times with phosphate-buffered saline (PBS) and refed with cul-ture medium. Live-cell images were obtained by an A1 confocal la-ser-scanning microscope using an inverted microscope (Ti; Nikon, Tokyo. Japan) equipped with a 40×/numerical aperture 0.95 Plan Apo objective (Nikon) and a stage-top incubator system (37°C, 5% CO2; Tokai Hit, Fujinomiya, Japan).
Pull-down assays
HEK293 cells were seeded at a density of 5 × 10⁵ cells on 60-mm dishes and transfected the next day with an appropriate amount of each plasmid using PEI-Max transfection reagent (Reed et al., 2006). After a 48-h incubation at 37°C, the cells were washed once and GFP-JRAB∆CT formed multiple lumens. Although the difference
between the phenotypes of JRAB∆CC and JRAB∆CT is subtle com-pared with the that observed in the 2D wound-healing assay, we found that lumens generated by cells expressing GFP-JRAB∆CC seemed to be closer to fusion than those generated by cells ex-pressing GFP-JRAB∆CT. Given that multiple lumens initially form and then fuse with one another in the process of forming a single lumen, both JRAB∆CC cells and JRAB∆CT cells fail in the formation of a single lumen, but their endpoints seem to be different. In any case, we showed the importance of JRAB/MICAL-L2 conformational plasticity in the physiological environment. However, we do not know how a disturbance in the conformational change of JRAB/MI-CAL-L2 confers a disadvantage on collective migration in the 3D environment. To obtain more definitive conclusions on 3D lumen formation, further investigation will be needed.
MATERIALS AND METHODS
Plasmid construction
Mouse JRAB/MICAL-L2 mutants; CT1 (aa 901–1009), CT2 (aa 895– 1009), CT3 (aa 877–984), CT4 (aa 877–1009), CT5 (aa 877–960), CC1 (aa 806–900), CC2 (aa 806–876), CC3 (aa 877–930), CC4 (aa 840– 930), and CC5 (aa 806–960) were amplified by PCR using pCIneo-HA-JRAB/MICAL-L2 as a template. To generate enhanced GFP (EGFP) constructs, the JRAB-C (aa 806–1009), CC (aa 806–912), CT (aa 913–1009), CH + LIM (aa 1–260), and JRAB mutants were sub-cloned into pEGFP-C1. pEGFP-JRABwt, -JRAB∆CC, and -JRAB∆CT were generated as reported previously (Sakane et al., 2010). For pro-duction of the His-tagged recombinant proteins, cDNA encoding JRABwt, JRAB∆CC, or JRAB∆CT was subcloned into pcDNAHisMax. pGEX-6P-1-JRAB-CH + LIM and -JRAB-C have been previously de-scribed (Sakane et al., 2012), and pGEX-6P-1-JRAB-CC5 was gener-ated in the same way. cDNAs encoding the dominant-active and dominant-negative mutants of mouse Rab13 (Rab13DA, Q67L and Rab13DN, T22N) were subcloned into pCIneo-HA, pRSET-A, or pEGFP-C1. Rab13DA∆C1, ∆C2, and ∆C3 (the character of these mu-tants is described later) were subcloned into pGEX-6P-1. To produce retrovirus-expressing, GFP-tagged proteins, we generated pMX-EGFP-JRABwt, -JRAB∆CC, and -JRAB∆CT as previously described (Kitamura et al., 2003; Sakane et al., 2012). pMX-Venus was prepared by PCR from pcDNA3-Venus obtained from A. Miyawaki (RIKEN Brain Science Institute), and cDNA encoding Rab13DA or Rab13DN fragment was subcloned into the vector. Each of JRABwt, GFP-JRAB∆CC, and GFP-JRAB∆CT fragments was individually inserted into the lentivirus transfer plasmid DNA, CSII-CMV-MCS-IRES-Bsd, described previously (Shikata et al., 2012). FRET-based JRAB indica-tor was constructed by assembling cDNA fragments encoding Venus, full-length JRAB, and cp173ECFP (Mizutani et al., 2010) into pRSET-B (Invitrogen, Thermo Fisher Scientific, Waltham, MA). To avoid unintentional recombination, humanized and Aequoria victoria–derived cDNA was used for Venus and cp173ECFP, respec-tively. cDNA of JRAB indicator was subcloned into pcDNA4-HMB (Invitrogen) and pMX (Kitamura et al., 2003) for mammalian expres-sion and retrovirus preparation, respectively. All plasmids con-structed in this study were sequenced using an ABI Prism 3100 genetic analyzer (Applied Biosystems, Thermo Fisher Scientific).
Antibodies
Rabbit anti-GFP antibody and rhodamine-phalloidin were from Invitrogen; mouse anti-vinculin antibody was from Sigma-Aldrich, St. Louis, MO; rat anti-E-cadherin antibody was from Takara; mouse anti–glyceraldehyde-3-phosphate dehydrogenase antibody was from Applied Biosystems. Rabbit anti-JRAB antibody was prepared
scraped from the dishes in PBS. The cells were lysed in 300 μl of buffer A (10 mM Tris-HCl, pH 8.0, 1 mM EDTA, 1% [wt/vol] Nonidet P-40, 150 mM NaCl, and 10 μM p-APMSF [p-amidophenyl)methyl-sulfonyl fluoride). The cell lysates were centrifuged at 4°C for 5 min at 16,100 × g, and each supernatant was incubated with the respec-tive purified GST-JRAB mutant or GST-Rab13DA∆C3 (see later de-scription) attached to glutathione-Sepharose beads and incubated for 90 min at 4°C. The beads were then washed with buffer A three times and resuspended in SDS sample buffer. Comparable amounts of the proteins that remained associated with the beads were sepa-rated by SDS–PAGE. The fraction of target protein bound to the af-finity column was determined by Western blotting using an anti-GFP antibody.
Preparation of Rab13DA truncation mutants
To assess the interaction between Rab13 and JRAB/MICAL-L2, we first prepared recombinant Rab13DA protein. However, the expres-sion level of full-length Rab13DA (aa 1–202) was not sufficient for repeated experiments, regardless of whether it was GST or His tagged. To increase the expression level, we prepared C-terminal– truncated mutants such as those used previously for crystallization of other small G proteins. All small G proteins contain switch I and switch II regions, whose spatial positions change drastically between GTP- and GDP-bound forms, as well as an interswitch region. Cross-species mammalian sequence analyses have revealed five RabF re-gions within the sequence that distinguish Rab proteins from other Ras superfamily members and four RabSF regions that are highly conserved within each Rab subfamily (Pereira-Leal and Seabra, 2000). In addition, complementarity-determining regions (CDRs) 1–3 are believed to be exposed to the surface in the 3D structure. Re-garding Rab–effector complexes, there are three types of combina-tions of Rab protein interaction sites: 1) switch and interswitch, 2) type 1 plus CDR1 and CDR3, and 3) type 1 plus CDR1, CDR2, and CDR3 (Wu et al., 2005; Stein et al., 2012). Multiple alignments of Rab13 and other Rab proteins revealed the position of CDR3 (SF4), as shown in Supplemental Figure S1C. On the basis of this align-ment, we prepared three Rab13DA truncation mutants: Rab13DA∆C1 (aa 1–166), Rab13DA∆C2 (aa 1–180), and Rab13DA∆C3 (aa 1–190). Among these mutants, only Rab13DA∆C1 lacks CDR3 (SF4). In the pull-down assay, GFP-Rab13DA∆C2 and GFP-Rab13DA∆C3 bound to GST-JRAB-C, whereas GFP-Rab13DA∆C1 and GFP-Rab13DN did not (Supplemental Figure S1D). These results indicate that CDR3 (SF4) is required for the Rab13–JRAB/MICAL-L2 interaction. We measured the expression level of recombinant Rab13DA∆C2 and Rab13DA∆C3 and found that the Rab13DA∆C3 was much more highly expressed than Rab13DA full-length or Rab13DA∆C2. There-fore, in this article, we used Rab13DA∆C3 for further analysis.
Establishment of a structural model of JRAB-C and models of the JRAB-C–JRAB-N and JRAB-C–Rab13 interactions
Structures of an ideal α-helical conformation of putative helices 1–5 and of random conformations for loops 1–4 were constructed by SYBYL-X, and the electrostatic potentials and hydrophobic proper-ties on the molecular surfaces of the structures were calculated us-ing eF-surf (Kinoshita and Nakamura, 2004).
Helices 1 and 2 and the first half of helix 3 are involved in the interaction between JRAB-N and JRAB-C, indicating that these three helices should be located near each other. Coiled-coil predic-tion (McDonnell et al., 2006) revealed that helix 1 has the potential to form a coiled-coil within itself or with other helices, such as helix 3 or 5. Therefore we positioned helices 1–3 so that helices 1 and 2 and the first half of helix 3 were located close together and the
hydrophobic regions of helices 1 and 3 contacted each other to form a coiled-coil–like conformation. On the other hand, helices 2–5 and loop 4 are involved in the interaction between Rab13 and JRAB-C. In addition, the features of the three effector proteins that we used in the structural alignment revealed that in general, two antiparallel helices are involved in Rab-binding via hydrophobic and electrostatically negative regions. On the basis of these observa-tions, we positioned helices 4 and 5 so that helices 2 and 3 and he-lices 4 and 5 were antiparallel and located close together; conse-quently the surface properties of the putative Rab-binding site on JRAB-C resemble those in the three aligned effector proteins (Figure 1C). To construct a model of the interaction between JRAB-C and JRAB-N (LIM) or Rab13, we modeled the structures of JRAB-N (LIM) and Rab13 by comparative modeling (Fugue [Shi et al., 2001] and Modeller [Eswar et al., 2006]) and calculated their surface properties (eF-surf [Kinoshita and Nakamura, 2004]). The structural model of LIM was placed on the JRAB-C model such that the protein-binding residues in LIM predicted by PSIVER (Murakami and Mizuguchi, 2010) were in contact with the putative LIM-binding regions in the JRAB-C model. The Rab13 model was placed on JRAB-C based on the known structures of the three Rab–effector complexes.
ANS fluorescence spectra measurement
Fluorescence emission spectra of ANS were collected from 400 to 600 nm at an excitation wavelength of 395 nm with a Hitachi F-4500 fluorescence spectrophotometer (Hitachi High-Technologies, Tokyo, Japan) at 25°C. Protein and ANS concentrations were 30 μg/ml and 250 μM, respectively.
Volume rendering
Volume rendering is a popular computer graphics technique for visualizing 3D images and has been used in many scientific fields (Engel et al., 2004). Basically, volume rendering generates a 2D im-age on a view plane relative to a given view (camera position and direction) by integrating 3D image intensity according to a given transfer function that defines opacity and pseudocolor values. We used the VoTracer software for volume rendering (Ijiri, 2013). We focused on GFP fused to JRABwt, JRAB∆CC, or JRAB∆CT by manu-ally adjusting a multidimensional transfer function (Kniss et al., 2002; intensity and its gradient field) implemented in the VoTracer.
Local motion estimation
We used an optical flow approach to extract local motions. Optical flow is a popular motion analysis approach in computer vision and video analysis, and many different optical flow models have been proposed. We initially examined three popular models (Horn and Schunck, 1981; Lucas and Kanade, 1981; Farnebäck, 2003) and their parameters implemented in OpenCV (Bradski, 2000). We selected Farnebäck’s (2003) algorithm with a Gaussian filter option (and window size is equal to 35) because of its high stability and robust-ness on our data.
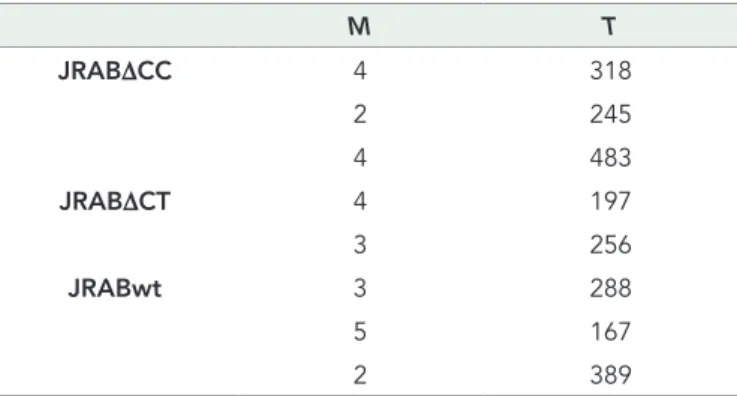
For the optical flow approach, the motion orientations of all time-lapse images were aligned from left to right; that is, flopped images were used if the original images captured cell population movement from right to left. The JRAB∆CC, JRAB∆CT, and JRABwt data consist of 10, 7, and 10 time-lapse image sets, respectively. The spatial domain image size of all images is equal to 512 × 512 pixels. The temporal domain image sizes are given in Table 1,
Directional analysis
For a given time-varying speed field, an angle histogram was calcu-lated; the angle is given by the normalized speed vector and the
In-population PCA
The PCA of the 2D median histogram for each population with re-spect to each population average was computed using the following equations. Consider the PCA principal values λ1, λ2 ∈R, λ1 ≥ λ2, and their corresponding principal axes e1, e2 ∈R2 which are defined by the eigensystem of a 2 × 2 covariance matrix. In our case, the covariance matrix A of the histogram is given by
A a a a a F f x y F f , i, 1 i N i i i N 11 12 21 22 1 1 x
∑
∑
= = = = = a F1 f x xi( i) , a F1 f y yi( i) , i N i N 11 2 22 2 1 1∑
∑
= − = − = = a a F1 f x x y yi( i)( i), i N 12 21 1∑
= = − − =where N = Nk is a number of bins, f f
i= ik is the probability at the pixel coordinates ( , )x yi i =xik of each population, k indicates a JRAB population group (∆CC, ∆CT, and WT), F is a probability sum (note that it is not equal to 1 because of our median strategy), and ( , )x y is a probability-weighted average of xik. For calculating the eigen-system of A, we used the QR factorization algorithm (Francis, 1961) implemented in the linear algebra software package LAPACK (Anderson et al., 1999).
PCA contribution rate
The contribution rate of PCA is defined by Cr = λ1/(λ1 + λ2), where 0.5 ≤ Cr ≤ 1. If λ1 = λ2, then Cr = 0.5, and λ2 = 0 gives Cr = 1.
PCA with all-population average
In our analysis, we used the PCA via the average speed vector within each population type. Here we present another PCA result that con-sists of the speed vector averaged over all population types. The PCA of the 2D median histogram for each population with respect to the all-population average is computed by the same equations used in covariance matrix A, except for the average vector:
x y fik ik f i N k ik i N k 1 1 k k x
∑
∑
∑
∑
= = =where k indicates a JRAB population group (∆CC, ∆CT, and WT).
Statistical analysis
One-way analysis of variance (ANOVA) followed by Tukey’s post hoc test was used for multiple group comparisons (Figures 2C and 4, A and E, and Supplemental Figure S8C). When assumptions of nor-mality of the distribution or homogeneity of variances were not veri-fied (Supplemental Figure S5A), Kruskal–Wallis ANOVA followed by Steel–Dwass post hoc test was used. Differences were assessed with a two-sided test and considered significant when p < 0.05.
Cell traction force assay
Relative magnitude of cell traction forces of clusters of MTD-1A cells expressing GFP-JRABwt, GFP-JRAB∆CC, or GFP-JRAB∆CT was eval-uated using a modified version of a method originally developed to visualize cell traction forces based on wrinkling of deformable silicone cell substrates (Harris et al., 1980, 1981; Chrzanowska-Wodnicka and Burridge, 1996; Hinz et al., 2001; Castella et al., 2010). In the previous method, prepolymer silicone fluid was coated on a culture dish and polymerized by passing it through a burner flame for a few seconds so that wrinkles were generated on the originally planar substrate unit x-axis vector because the orientations of the time-lapse images
were aligned from left to right. The horizontal and vertical axes of the angle histogram present angle range and its normalized frequency, respectively. The angle range was equally quantized by N histogram bins (N = 64 in our experiments) with a periodic boundary condition. The average angle histograms for each population type were also calculated by shifting histogram peaks to match them.
The kurtosis of angle histogram was calculated using the follow-ing equations. For a given angle histogram with N bins, let xi ∈ R
and fi = f(xi) ∈ (0, 1), i = 1, 2, 3..., N be the ith interval center of the
histogram bin and its corresponding frequency, respectively. The histogram kurtosis is given by
ku F1 f m xi i 3, i N 1 4
∑
= −σ − = F i f ,i N 1∑
= = m F f x1 i i, i N 1∑
= = F f m x 1 i N i i 2 1 2∑
(
)
σ = − =where F is a frequency sum, m is a frequency-weighted average of xi, and σ is the variance of the histogram. The minimum (min),
maxi-mum (max), and average (ave) kurtosis values of the angle histogram within each population type are examined.
Two-dimensional median histogram
Consider a 2D histogram that is equivalent to a grayscale image quantizing a spatial 2D space; thus each histogram bin becomes an image pixel. Assume that the coordinate origin is located at the cen-ter of the 2D histogram (Figure 5E). For a given time-varying speed vector field, let the starting points of all vectors be the origin (the center of the 2D histogram). The 2D motion histogram was calculated by counting the vectors whose endpoint is located at each pixel. Then the histogram value was converted into a probability distribution by dividing its frequency total in order to normalize the difference in the time length of the data. To obtain robust statistical results, we used 2D median histograms as shown in Figure 5E, bottom, and Supple-mental Figure S6. The median histogram consists of the median val-ues of all motion histograms of each population type. The median histogram excludes outliers of speed vectors. In our experiments, we quantized the spatial space by intervals of 0.1 (0.1 subpixel).
For a given 2D histogram with Nk bins, let x y, R
ik ik ik 2
x =
(
)
∈ and xxfik=f
( )
ik ∈(0,1) be the ith pixel center coordinates and itsproba-bility in each population, where k indicates a JRAB population group (∆CC, ∆CT, and wild type [WT]).
M T JRAB∆CC 4 318 2 245 4 483 JRAB∆CT 4 197 3 256 JRABwt 3 288 5 167 2 389
M and T, numbers of data sets and temporal size (i.e., number of images in a time-lapse data set), respectively. Total number of speed vectors was 2,025,586,688.