For Peer Review
Life-course monitoring of endogenous phytohormone levels under field conditions reveals diversity of physiological
states among barley accessions.
Journal: Plant and Cell Physiology Manuscript ID PCP-2019-E-00618.R1 Manuscript Type: Special Issue - Regular Paper Date Submitted by the
Author: 03-Mar-2020
Complete List of Authors: Hirayama, Takashi; Okayama Univ., IPSR
SAISHO, Daisuke; Okayama University, Institute of Plant Science and Resources
Matsuura, Takakazu; Okayama Univ., IPSR
Takahagi, Kotaro; Yokohama City University, Kihara Institute for Biological Research
Okada, Satochi; Okayama Univ., IPSR
Kanatani, Asaka; Riken Yokohama Institute, Center for Sustainable Resource Science
Ito, Jun; Yokohama City University, Kihara Institute for Biological Research
Ikeda, Yoko; Okayama University, Institute of Plant Science and Resources
Tsuji, Hiroyuki; Yokohama City University, Kihara Institute for Biological Research
Mochida, Keiichi; Riken Yokohama Institute, Center for Sustainable Resource Science
For Peer Review
Life-course monitoring of endogenous phytohormone levels under field
conditions reveals diversity of physiological states among barley
accessions
Takashi Hirayama1*, Daisuke Saisho1, Takakazu Matsuura1, Satoshi Okada1, Kotaro
Takahagi2, Asaka Kanatani2, Jun Ito3, Hiroyuki Tsuji3, Yoko Ikeda1, and Keiichi
Mochida1,2,3*
1 Institute of Plant Science and Resources, Okayama University, 2-20-1 Chuo, Kurashiki,
Okayama 710-0046, Japan
2 RIKEN Center for Sustainable Resource Science, 1-7-22 Suehirocho, Tsurumiku,
Yokohama, Kanagawa 230-0045, Japan
3 Kihara Institute for Biological Research, Yokohama City University, 641-12 Maiokacho,
Totsukaku, Yokohama, Kanagawa 244–0813, Japan
Running title: Life-course hormone profiling of field barley
*Corresponding authors: Takashi Hirayama
Institute of Plant Science and Resources, Okayama University, 2-20-1 Chuo, Kurashiki, Okayama 710-0046, Japan.
e-mail: [email protected]
Keiichi Mochida
RIKEN Center for Sustainable Resource Science, 1-7-22 Suehirocho, Tsurumiku, Yokohama, Kanagawa 230-0045, Japan
For Peer Review
Abstract
Agronomically important traits often develop during the later stages of crop growth as consequences of various plant–environment interactions. Therefore, the temporal physiological states that change and accumulate during the crop’s life course can significantly affect the eventual phenotypic differences in agronomic traits among crop varieties. Thus, to improve productivity, it is important to elucidate the associations between temporal physiological responses during the growth of different crop varieties and their agronomic traits. However, data representing the dynamics and diversity of physiological states in plants grown under field conditions is sparse. In this study, we quantified the endogenous levels of five phytohormones—auxin, cytokinins, abscisic acid, jasmonate, and salicylic acid—in the leaves of eight diverse barley (Hordeum vulgare) accessions grown under field conditions sampled weekly over their life course to assess the ongoing fluctuations in hormone levels in the different accessions under field growth conditions. Notably, we observed enormous changes over time in the development-related plant hormones, such as auxin and cytokinins. Using 3 RNA-seq-based transcriptome data from the same samples, we investigated the expression of barley genes orthologous to known hormone-related genes of Arabidopsis throughout the life course. These data illustrated the dynamics and diversity of the physiological states of these field-grown barley accessions. Together our findings provide new insights into plant– environment interaction, highlighting that there is cultivar diversity in physiological responses during growth under field conditions.
For Peer Review
Introduction
Field-grown crops continuously sense and respond to environmental changes throughout their life courses (Mochida et al., 2015). Seasonal environmental changes play important roles in regulating developmental stage transitions of crops, while abiotic and biotic stresses often cause quality and quantity losses. Projections of future global climate suggest that global climate change will negatively affect growth and cause production shortfalls in various crop species (Vermeulen et al., 2012, Rosenzweig et al., 2014, Fodor et al., 2017). Therefore, the development of crops tolerant of, and resilient to, adverse environmental conditions has become an important issue for climate change mitigation and adaptation (Hirayama and Shinozaki, 2010, Varshney et al., 2011).
Agronomic traits in crops often appear late in the growth period as the consequences of various plant–environment interactions. Therefore, molecular dissection of the gene– environment interactions in crops throughout their growth periods will help clarify the relationships between genetic variation and the diverse environmental responses that influence agronomic traits in crops (Mochida et al., 2015). Moreover, describing the genetic associations with crop environmental responses will help identify potentially useful genetic variations enabling researchers to redesign environmental responses at different developmental stages, and provide clues toward effective interventions in agricultural management (Roy et al., 2011). However, despite the importance of the physiological states in crops throughout their growth under field conditions, there is currently relatively little information representing the dynamics and diversity of the physiological states of plants grown in the field.
Because biological processes are usually composed of hierarchically and temporally related phenomena, longitudinal time-series studies provide important opportunities to identify key events that are decisive for later processes (Pearlin et al., 2005, Hayman et al., 2011, Sarup et al., 2014). For example, a long-term analysis of the effect of high temperature on maize pollen development revealed that moderate heat stress at a critical stage of meiosis causes male sterility (Begcy et al., 2019). Transcriptome analyses of chronological samples from plants and crops grown under field conditions have illustrated temporal and seasonal responses in gene expression throughout their growth periods (Nagano et al., 2012, Nagano et al., 2019). However, the diversity of temporal
For Peer Review
and seasonal responses in crop species under agronomically practical conditions remains largely elusive.
Plant hormones play crucial roles in the regulation of almost all biological processes, including development and physiological responses throughout the plant life cycle (Scheres and van der Putten, 2017). The chemical substances currently recognized as plant hormones are auxin, cytokinin (CK), abscisic acid (ABA), jasmonic acid (JA), salicylic acid (SA), gibberellins, ethylene, brassinosteroids, strigolactones, and their derivatives (Santner et al., 2009, Asami and Nakagawa, 2018). Numerous studies have revealed the structures, synthetic pathways, receptors, physiological functions, and molecular components of the signaling systems for each plant hormone. In response to harsh or abiotic stress conditions, plants rapidly accumulate ABA, which in turn induces the expression of genes whose products enhance stress tolerance (Sah et al., 2016); this pattern occurs in field-grown crops as well as in those grown in the laboratory (for a recent review, Shanker et al., 2014). SAacts as an endogenous signal mediating defense gene expression, leading to resistance to pathogenic attacks by infectious bacteria and fungi (Vlot et al., 2009, Hayat et al., 2010), and its synthetic analogs, such as BTH, are widely used to protect crops from diseases (for example, Görlach et al., 1996). Auxin regulates the developmental processes of most plant tissues (see reviews by Benjamins and Scheres, 2008, and Vanneste and Friml, 2009), in which its local production and movement through plant cells regulate cell fates (Friml et al., 2002, Brunoud et al., 2012, Hayashi et al., 2014). CKs regulate the plant cell division cycle and developmental processes (see reviews by Hwang et al., 2012, and Schaller et al., 2015). Although these examples of the functions of plant hormones imply that plant hormone profiling should be a means to illustrate plant physiological states, most information about plant hormones has been obtained from studies of plants grown under artificial and controlled conditions. In addition to the function of each plant hormone, the interactions (cross-talk) among them through interconnected pathways form a complex network of signaling systems (Ross et al., 2011, Wilkinson et al., 2012, Vanstraelen and Benková, 2012, Yang et al., 2013, Wani et al., 2016). The interconnections between plant hormone pathways have been repeatedly illustrated through interference with the transcriptional regulation of genes involved in hormonal responses (Jaillais and Chory, 2010, Depuydt and Hardtke,
For Peer Review
2011, Yang et al., 2018). For example, in addition to their well-known cross-talk, auxin and CKs are both implicated in stress tolerance under field conditions (Peleg and Blumwald, 2011, Rahman, 2013, Ha et al., 2012), pointing to the complexity of plant hormone action due to various additional factors such as developmental stages, temporal, and seasonal environments, as well as genotypes, in practical agronomic situations. However, there is limited information on the actions of plant hormones under practical field conditions or throughout the plant life course. We reasoned that simultaneous longitudinal profiling of plant hormones would enable us to unlock the complexity of plant hormone action in crops as well as potentially providing useful clues toward improving their productivity through genetic breeding and improved agricultural management.
In this study, we investigated the dynamics of physiological states and their diversity between eight different barley accessions grown under field conditions through precise simultaneous measurement of the endogenous levels of six plant hormones—auxin, two CKs, ABA, JA, and SA—in leaf samples taken from germination to flowering. We measured the levels of each hormone by liquid chromatography/tandem mass spectrometry (LC/MS/MS). Our data reveal previously undocumented fluctuation patterns in the course of plant growth, as well as highlighting the physiological diversity among the barley accessions. Moreover, our combinatorial analysis of the hormone profile datasets with field-transcriptome datasets from the same leaf samples enabled us to describe direct links between fluctuations in hormone levels and in the expression levels of hormone-related genes, along with dynamic changes in developmental and physiological states under field conditions. Together our findings detail, for the first time, physiological dynamics and characteristics during the life course of an annual crop species grown under field conditions, providing unprecedented insight into plant adaptation to the continuously changing environment.
Results
Experimental design
We grew eight barley races, J064, H602, E612, I304, I626, J247, J647, and K735, including occidental, oriental, wild, and domesticated races (Figure S1, Table S1), in a
For Peer Review
test field in Kurashiki, Japan, from November 2016 to May 2017, corresponding to the period from germination to grain ripening. The growth rates and heading dates of these barley accessions varied (Figure S1, Table S1). Each week during this test period, we collected the latest expanded leaves (n = 3) from separate plants (using previously unsampled plants to avoid the secondary effects of the sampling process) of each accession at 12:00 noon local time, and immediately froze them in liquid nitrogen. At the same time, we obtained several morphological data points, such as leaf length and height, for each accession and collected environmental data for the field, such as air temperature, wind direction and speed, daylight hours, and precipitation, using monitoring equipment (Figure S2). We also obtained the weather data for the local region where the test field is located from the weather database of the Meteorological Agency of Japan. We used the obtained leaf samples for both hormone profiles and transcriptome analyses. After grinding the samples, we measured the plant hormones indole acetic acid (IAA), trans-zeatin (tZ, a cytokinin), N6-isopentenyladenine (iP, also a cytokinin), dihydrozeatin (DHZ,
also a cytokinin), ABA, gibberellin A1 (GA1), GA4, jasmonic acid (JA), and salicylic acid (SA) from one sample using LC/MS/MS. To obtain precise hormone levels, each hormone measurement was standardized by adding stable-isotope-labeled plant hormones to each sample before hormone extraction.
We sowed all eight accessions at the same time (Nov. 17, 2016). They grew slightly differently, especially in the later growth stages, and flowered on different dates (Figure S3, Table S1). J247 (Japanese cultivar), J064 (Japanese landrace), E612 (Ethiopian landrace), and I304 (Indian landrace) grew fastest and flowered earliest, while I626 (Syrian landrace) and J647 (Japanese landrace) had intermediate growth and flowering times, and K735 (Korean landrace) and H602 (wild barley from the Caspian Sea region) grew slowest and flowered latest. The difference in flowering time between the earliest (J247) and latest (K735) was 17 days.
Overview of the life-course plant hormone profile data of eight barley accessions
We previously established an experimental procedure for plant hormone measurements, consisting of plant hormone extraction followed by LC/MS/MS analysis (Mikami et al., 2016). In that approach, SA was handled separately from other acidic hormones such as
For Peer Review
IAA and ABA. To enhance the efficiency of the analysis, we improved the steps for reverse-phase solid-phase extraction of plant hormones from barley leaf samples so that all of the acidic hormones were extracted together and analyzed using an improved liquid chromatography procedures. Using this procedure, we reduced the run time for each sample from 38 min to 21 min for acid samples and 34 min to 20 min for cytokinin samples, including the column wash process in each run (Figure S4). All barley samples were analyzed with this improved method.
As mentioned earlier, we analyzed the IAA, tZ, iP, DHZ, ABA, GA1, GA4, JA, and SA contents of each leaf sample. Among these hormones, the amounts of DHZ, GA1 and GA4 were always below detectable levels throughout the life course in all barley accessions we tested, indicating that barley leaves contain fairly low levels of gibberellins. The remaining hormones were all detected consistently in almost all samples. After flowering, the levels of some hormones declined to below the detection limit, while those of others increased significantly.
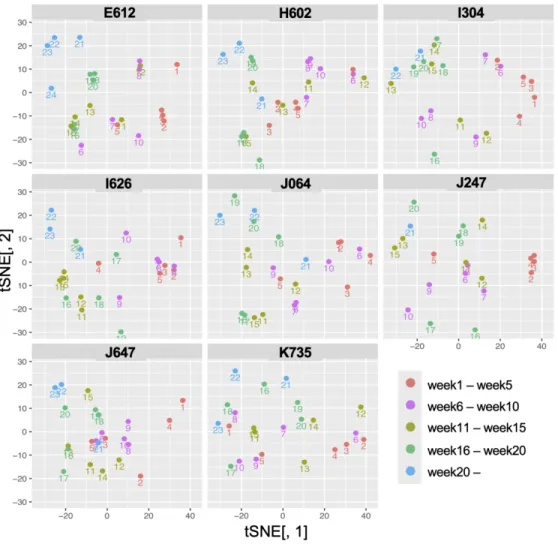
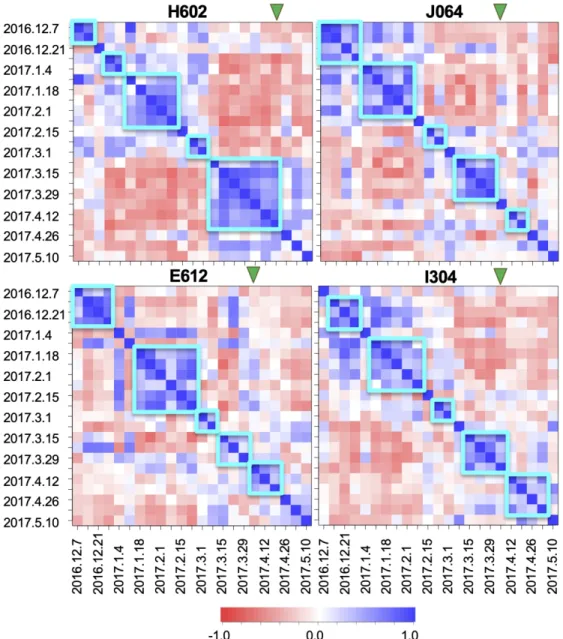
To obtain an overview of the data structure of the life-course hormone profile data, we performed t-distributed stochastic neighbor embedding (tSNE) analysis. When all the data for all eight accessions were analyzed together, the hormone profile data were separated according to sample dates rather than accessions, suggesting that the divergence of hormone responses among accessions is not very significant. For example, in Figure 1, showing the results of tSNE of each accession separately in a two-dimensional space, data for the 1st-week sample to the 20th-week sample move roughly continuously from the lower right to the upper left for each accession. This suggests that the changes in plant hormone contents were driven primarily by developmental processes and variations in the environmental conditions in the field in which the plants were all grown. Figure 2 shows the correlation maps of hormone profile data of four accessions (H602, J064, E612, and I304)). Comparing these hormone profile data through the life course, we determined that these could be classified into 5 or 6 stages, within which the hormone profiles did not change significantly. Although the lengths of each stage differed among accessions, these stages seem to correspond to the early growth, middle growth, before heading, and after heading stages. These data suggest that hormone profile data contain important information on the physiological or developmental state of the field barley.
For Peer Review
Fluctuation pattern of each plant hormone throughout the life course
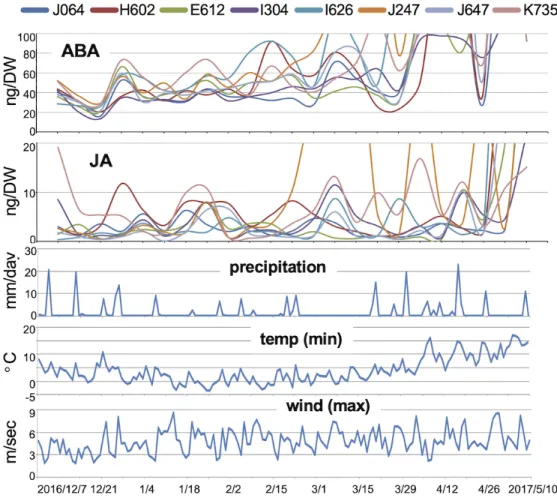
Figure 3 shows the overall trajectories of the IAA, tZ, iP, ABA, JA, and SA levels of all the accessions throughout the life course. As expected, the endogenous plant hormone levels fluctuated significantly, presumably in conjunction with particular developmental processes or changes in environmental conditions. Although the trends of the hormone level changes over the life course were similar among barley accessions, the steady-state level and fluctuation pattern of each hormone differed among accessions. For example, H602 had considerably lower tZ levels but higher iP levels than other accessions throughout its life course, and JA and SA levels in J247 fluctuated significantly, implying that this accession is more sensitive to environmental stimuli.
IAA was consistently detected in all barley leaf samples. Overall, the endogenous IAA level was relatively higher in the early growth stages and decreased gradually until the 7th to 9th week, after which it increased again until approximately the vernal equinox (March 20) or a little later. The IAA level fluctuated considerably throughout the life course in all accessions. Since the trajectories of the IAA levels did not overlap among accessions, presumably environmental factors are not the major determinants of these fluctuations. Notably, the wave patterns of the IAA fluctuations were similar among accessions. The trajectories of IAA in three accessions (J064, J647, and J247) chosen as examples are shown in Figure 4A. It was difficult to find any linkage between the IAA fluctuations in these three accessions and the field environmental data. Interestingly, however, the trajectories of J064 and J647 seem to overlap for at least the first two-thirds of the life course, although their IAA levels were different. In addition, the IAA level of J247 seems to fluctuate one week earlier than those of J064 and J647. To address this possibility, we examined the correlations between the chronological IAA data and the one-week shifted chronological IAA data. In several accessions, IAA data showed a higher correlation with the one-week-shifted data for another accession (eg, J647-J247, E304-E612) (Figure 4C). These data suggest that the IAA fluctuations were, as expected, caused mainly by developmental factors. The plant growth states estimated from the morphology of the aboveground parts of the plants did not differ among accessions (Figure S3). Thus, the IAA data could potentially be used to discriminate the
For Peer Review
developmental stages of each accession.As cytokinins are also involved in plant development, we similarly examined their fluctuations in detail. Overall, the levels of tZ gradually decreased along the life course of field barley, whereas those of iP did not change (Figure 4B). Remarkably, the tZ levels fluctuated significantly in a periodic fashion in all accessions, particularly during the early growth stages. The patterns of tZ fluctuations seem to be synchronized among accessions, implying that environmental factors were the major determinant of these fluctuations. Supporting this idea, comparison with the one-week-shifted data did not improve the correlations (Figure 4C). When we compared the trajectories of J064, J647, and H602 with the data on environmental factors, dates with precipitation seem to correlate with the timing of tZ level elevation in the early growth stages (Figure 4B). Thus, tZ production in barley under field conditions might be affected by precipitation, although there are no previous reports either of this effect or of an obvious mechanism that could cause it.
ABA, JA, and SA are considered to be involved in the responses to environmental stresses, abiotic stresses, injury, and infectious stresses. Therefore, we expected the levels of these hormones to fluctuate significantly in field barley. In fact, however, except for the flowering period, the overall levels of these hormones were largely unchanged throughout the life course in almost all the accessions (Figure 3). One exception was that, in all accessions, ABA levels decreased in the first two weeks and then became transiently elevated. Presumably this synchronized change was caused by environmental stimuli; however, none of the environmental data we obtained, including the minimum daily temperature, consistently explained these fluctuations in ABA level (Figure 5). In addition, some of the fluctuations in the JA levels seem to be synchronized among accessions. However, there was again no clear correlations between these fluctuations and any of the environmental data. The correlation analysis with one-week-shifted data also did not suggest any growth- or development-dependent regulation of any of the plant hormones we tested (Figure S5). These observations imply that the levels of these plant hormones change in response to physiological states of the plant that are affected by both inner and outer environmental conditions. Also noteworthy is that some of the J247 samples had higher levels of JA and SA, and we noticed that J247 tended to be infected by viruses or bacteria during this season, implying that these changes might have been
For Peer Review
part of a response to infection.Combinatorial analysis with transcriptome data
To fully elucidate the regulation of hormone levels, it is necessary to assess the expression of the genes involved in their synthesis, catabolism, signaling, and responses. To obtain information about the transcription of the barley genes involved in hormone actions, we annotated barley genes on the basis of their similarity with Arabidopsis hormone-related genes, whose information we obtained from the literature or from Arabidopsis resource databases such as TAIR and ATTEDII (Obayashi et al., 2018). To obtain a reliable list of barley gene orthologs of Arabidopsis genes, we conducted reciprocal blast searches to discriminate the relationships among homologous genes between barley and Arabidopsis. From this we identified 265 putative barley orthologs for Arabidopsis hormone-related genes involved in IAA, cytokinin, ABA, JA, and SA metabolism (Figure 6, Table S2).
We conducted transcriptome analysis using the same leaf samples that we used for hormone profile analysis throughout the life course for all accessions, selecting the transcriptome data for the putative barley ortholog genes for analysis (Figure 6 and Figure S6). These transcriptome data were selected with their expression levels (total RPKM of 60 RNA-seq data >60) (Table S3) and compared among accessions after normalization in each accession (Table S3). Figure 7 shows several representative profiles of the relative expression of barley hormone-related genes.
Interestingly, the expression of some of these genes fluctuated synchronously among accessions. For example, the expression of HORVU5Hr1G014290, a putative ortholog of the Arabidopsis auxin-responsive gene At1g04240 (encoding IAA3, a transcription factor involved in the auxin response) increased significantly at Feb. 1st (9th week) in all eight accessions (Figure 7, Figure S7). Comparing these expression patterns with the IAA levels showed that the peaks of HORVU5Hr1G014290 expression almost overlapped with the starting points of IAA accumulation, namely Feb. 1st and Feb. 22th. The transcript levels of another gene, HORVU5Hr1G062720, the ortholog of the auxin-responsive Arabidopsis At5g20820 gene, also fluctuated synchronously in all accessions, although its expression pattern over the life course differed from those of HORVU5Hr1G014290. HORVU3Hr1G075920 is the ortholog of Arabidopsis
For Peer Review
AT1G75450, encoding CKX5, which catabolizes cytokinin. The expression of this gene in all accessions seemed to oscillate with the tZ level, although the patterns did not correlate precisely. The expression of HORVU3Hr1G050770, an ortholog of the Arabidopsis LOG4 encoding a cytokinin riboside 5-monophosphate phosphoribohydrolase that converts inactive cytokinin derivative to active ones, seems to fluctuate synchronously with the tZ levels throughout the life course (Figure S7). The transcript levels of the putative ABA-related genes HORVU4Hr1G055220 and HORVU0Hr1G016780, orthologous to the Arabidopsis ABA-receptor-coding gene PYL2 and the ABA-catabolizing-enzyme-coding gene CYP707A3, respectively, were also synchronously regulated among accessions (Figure 7). Finally, the increased expressions of the PYL2 ortholog seem to correlate with ABA accumulation, while those of the CYP707A ortholog seem to correlate with falling ABA levels (Figure S7). However, these changes in transcript levels did not coincide with any environmental changes in the field. Nonetheless, overall, these relationships between transcriptome data and hormone profile data suggest that the physiological state of barley in the field changes dynamically throughout the life course.
Discussion
In this study we obtained the life-course hormone profiles of eight barley accessions with diverse genetic backgrounds under field conditions. Among the eight plant hormones measured using LC/MS/MS analysis, six, namely IAA, tZ, iP, ABA, JA, and SA, were continuously detected. As far as we know, such chronological data for the plant hormone levels of a field-grown crop throughout its life course have not previously been reported. Moreover, our novel life-course hormone profile data provided several important pieces of information.
First, both the levels and fluctuation patterns of the plant hormones differed among these eight barley accessions, which were expected to, and did, have distinct growth patterns and environmental responses (Figure 1, 2, 6). These observations strongly suggest that the hormone profile data can be useful indicators of the developmental states and physiological conditions of field plants throughout their life courses. Plants under field conditions pass through various developmental stages and physiological states, and
For Peer Review
it is important to take those into consideration so as to understand the associations between temporal physiological states during crop growth and agronomic traits, which will allow us to improve crop productivity.
Second, the levels of all plant hormones in barley leaves fluctuated vigorously throughout the life course (Figure 3, 4). The levels of hormones involved in development and growth regulation, such as auxin and cytokinins, were expected to be relatively constant throughout the life course. In fact, however, the levels of the cytokinin tZ fluctuated periodically in all barley accessions. Interestingly, the expression of the barley gene HORVU3Hr1G050770, which is orthologous to Arabidopsis LOG4, seemed to correlate with these fluctuations in tZ level. Arabidopsis has nine LOG genes, which encode enzymes that activate cytokinins (Kuroha et al., 2009), and our survey showed that barley possesses at least three LOG orthologs, specifically of LOG3, LOG4, and LOG8 (Table S3). The expression profiles of the LOG4 ortholog was different from those of the LOG3 and LOG8 orthologs, suggesting that these barley LOG enzymes are regulated separately and have different physiological functions. The barely LOG4 ortholog may have important function in leaves or shoots, as Arabidopsis LOG4 is expressed highly in shoots (Kuroha et al., 2009). The level of tZ seemed to fluctuate synchronously among accessions, implying the presence of causal environmental factors. Among our field environmental data, we noticed that during the early growth stage, the timing of precipitation seemed to correlate with increases in tZ. This correlation might reflect the systemic transport of cytokinins, because it is well known that cytokinins are synthesized in roots and transported to shoots, and this transport process can be enhanced by water transport from roots to shoots after precipitation. There has been no previous report of such a relationship; however, tZ is known to translocate from roots to shoots via the xylem (Kudo et al., 2010, Ko et al., 2014), and therefore precipitation might plausibly enhance tZ accumulation in shoots by activating xylem trafficking. Given the lack of past reports clearly supporting a relationship between precipitation and tZ accumulation, further experiments will be required to confirm this observation.
The fluctuations in IAA levels were not synchronized among accessions, suggesting that the IAA level is affected by the developmental progress of each accession. Interestingly, however, the IAA levels started to increase in the 8th week (Feb. 1st) in all
For Peer Review
accessions, accompanied by increased expression of the IAA5 ortholog. Auxin is reported to be implicated in cold stress response in plants (Rahman, 2013). The air temperature of the field in 2017 was lowest before this date and started to increase at around this point. The onset of IAA accumulation might thus have been triggered by this environmental cue.
Fluctuations in hormone levels would be expected to be accompanied by changes in the transcript levels of genes involved in their synthesis or catabolism. However, the transcript levels of several genes encoding rate-limiting steps of hormone synthesis, such as the yucca genes for auxin, the NCED genes for ABA, and the IPT genes for cytokinin, did not correlate with hormone level fluctuations, especially inthe earlier growth stages, and in fact did not change significantly during these stages (Table S3). These genes might be regulated at post-transcriptional levels. Alternately, the hormone levels may have been controlled using stored hormone derivatives, such as sugar-conjugated hormones.
Finally, we would like to highlight the usefulness of life-course multi-omics analyses such as that in this study. We obtained transcriptome data along with hormone profile data from each sample throughout the life course and conclude that this is a strong analytical method for field plants. Our data showed that the transcript levels of some hormone-related genes are correlated with fluctuations in hormone levels but that, as discussed above, many genes for hormone biosynthesis were not regulated concomitantly with changes in hormone levels. The functions of hormone-related genes have been widely studied in model plants, such as Arabidopsis or rice, grown under artificial environmental conditions. Therefore, counterparts of those hormone-related genes in barley may spatio- temporally represent different functions through specific signaling and regulatory networks, which could underlie some of the discrepancies between the levels of hormones and expression of hormone-related genes. Monitoring the levels of both hormones and hormone-related gene expression simultaneously in this study has naturally led us to consider that the gaps observed between plants’ behavior during their life course under laboratory as compared to field conditions can be considerably wider than is often assumed, as was also pointed out in Nelissen et al., 2014. Since hormone profile and transcriptome data can compensate for each other in the vertically inter-related omics planes (Mochida and Shinozaki, 2010, 2011), their integration will provide clues to
For Peer Review
understanding the physiological responses underlying plants’ behavior under fluctuating field conditions. Coupling quantitative genetics approaches to exploring genetic association with assessments of the variations in hormone levels and gene expression among genotypes, genetics-based integration of omics spectra across multiple molecular spaces will provide opportunities to the identify genetic and environmental factors associated with temporal physiological responses as well as terminal phenotypes in crop plants, which would help us to optimize crop production with respect to particular field conditions.
Materials and Methods
Plant materials
Seven domesticated barley (Hordeum vulgare) accessions and one wild barley (Hordeum spontaneum) accession, representing several biogeographical origins, were used for this study. All the accessions used were obtained from the domesticated barley collection preserved at the Institute of Plant Science and Resources, Okayama University, and from the publicly available barley database (http://www.shigen.nig.ac.jp/barley). The identifiers, common names, and historical data for the barley accessions are summarized in Supplementary Figure S1 and Table S1. All eight barley accessions were sown in a test field located in Kurashiki City, Japan (34.59E, 133.77N) on November 17th, 2016. Starting on December 7th, 2016, the most expanded leaf was taken weekly at 12:00 noon (n = 3) and the samples were frozen immediately in liquid nitrogen. The barley leaf samples were ground to powder using a multi-bead shocker.The environmental data for the test field were obtained using Filed Mini FMB (Field Pro Col Ltd. Tokyo, Japan) and the local weather data from the database of the Japan Meteorological Agency.
Quantification of plant hormones in whole seeds
ABA, IAA, JA, salicylic acid (SA), gibberellin A1 (GA1), gibberellin A4 (GA4),
trans-zeatin (tZ), dihydrotrans-zeatin (DHZ), and isopentenyladenine (iP) were extracted and purified by solid-phase extraction, and contents of these hormones were quantified with liquid chromatography-electrospray tandem mass spectrometry (LC-ESI-MS/MS). About 100 mg of leaf powder was extracted with 80% acetonitrile supplemented with
For Peer Review
internal standards and incubated at 4°C for 1 hour. Stable isotope-labeled compounds used as internal standards were: D2-IAA (CDN Isotopes, Pointe-Claire, Canada); D6
-ABA, D2-GA1, D2-GA4, D4-SA, D5-tZ, D3-DHZ, and D6-iP (Olchemim, Czech); and D2
-JA (Tokyo Chemical Industry Co., Tokyo). The supernatant was collected after centrifugation at 3,000 g for 10 min at 4°C. The pellet was rinsed with 4 mL of the extraction solvent without internal standards. After a centrifugation, supernatants were combined, evaporated with a centrifugal evaporator to yield plant hormones dissolved in 1% aqueous acetic acid solution, and loaded into a pre-equilibrated Oasis HLB 1cc cartridge (30 mg, Waters Corporation, Milford, MA, USA). After washing the cartridge with 1 mL water containing 1% acetic acid, plant hormones were eluted with 2 mL of acetonitrile/water (4:1) containing 1% acetic acid. The acetonitrile in the eluate was evaporated to leave water containing 1% acetic acid. Extracts were then applied to a pre-equilibrated Oasis MCX 1-cc cartridge (30 mg, Waters Corporation). After washing with 1 mL water containing 1% acetic acid, acidic fractions containing GA1, GA4, IAA, ABA,
JA, and SA were eluted with 2 mL of 1% acetic acid in acetonitrile/water (4:1). The MCX cartridge was further washed with 5% (v/v) ammonium/water, and the basic fraction containing tZ and iP was eluted with 2 mL of 5% ammonia in 2:3 (v/v) acetonitrile/water. The basic fraction was evaporated to dryness and reconstituted in 50 µL of 1% acetic acid in water, and then its tZ and iP contents were quantified by LC-ESI-MS/MS. Acetonitrile in the acidic fraction was removed by centrifugal evaporation, and the remaining acidic aqueous portion was then applied to a pre-equilibrated Oasis WAX 1cc cartridge (30 mg, Waters Corporation). After being washed with 1 mL of water containing 1% acetic acid and 2 mL of 1:1 (v/v) acetonitrile/water without acetic acid, the acidic hormones were eluted with 2 mL of 3% formic acid in acetonitrile. This fraction was dried and reconstituted with 1% acetic acid in water. Contents of analytes were quantitatively analyzed by LC-ESI-MS/MS (with an Agilent G6410B triple-quadrupole mass spectrometer and 1260 high-performance LC) equipped with a ZORBAX Eclipse XDB-C18column. The liquid chromatography conditions and the mass-to-charge ratio (m/z) transitions of analytes were described previously (Mikami et al., 2016). Contents of plant hormones were normalized to the weight of residues of leaf extract.
For Peer Review
Transcriptome analysisTotal RNA was obtained from powdered barley leaf sample using a MagMAX RNA isolation kit according to the manufacturer’s instructions (Thermo Fisher Scientific K.K. Tokyo, Japan). The quality of RNA was confirmed with a TapeStation (Agilent K.K. Tokyo, Japan). Using these RNA samples, the QuantSeq 3 mRNA sequencing technique was conducted and stranded-paired RNA sequencing (RNA-seq) data were obtained.
Libraries for stranded RNA-seq were constructed using the Quant-seq 3 RNA-seq kit (Illumina) according to the manufacturer’s instructions and assessed using an Agilent 2100 Bioanalyzer (Agilent Technologies). Clonal clusters of the libraries were generated using cBot with the TruSeq PE Cluster Kit (Illumina) and sequenced on the HiSeq 4000 platform (Illumina) using a TruSeq SBS Kit (Illumina) and the paired-end sequencing method to obtain 100 bp sequences. Quality checks of RNA-seq reads, mapping of reads to the reference genomes, homoeologous read sorting, and read counting followed the methods described in Takahagi et al. (2018) with minor modifications. Briefly, the RNA-seq reads were trimmed using Trimmomatic (v0.32) (Bolger et al., 2014) with the parameters LEADING:20, TRAILING:20, SLIDINGWINDOW:4:15, and MINLEN:36. Trimmed reads from barley were mapped to the barley Golden Promise genome using TMAP (https://github.com/iontorrent/TMAP) with the mapall, stage1, and map4 commands. Read counts were obtained using featureCounts (v.1.4.6) (Liao et al., 2014). The pseudotime predictions were performed with Monocle3 (Cao et al., 2019)
Acknowledgements
We thank all the members of the TH, SD, and KM laboratories. All the barley materials used in this study were provided by Institute of Plant Science and Resources, Okayama University with support in part by the National Bio-Resource Project of the MEXT, Japan.
Funding
The work was supported by Core Research for Evolutionary Science and Technology (CREST) of the Japan Science and Technology Agency (JST) (JPMJCR16O4).
For Peer Review
Conflict of interest statement. None declared.References
Asami, T., and Nakagawa, Y. (2018) Preface to the Special Issue: Brief review of plant hormones and their utilization in agriculture. J Pestic Sci. 43: 154–158.
Begcy, K., Nosenko, T., Zhou, L.-Z., Fragner, L., Weckwerth, W., and Dresselhaus, T. (2019) Male Sterility in Maize after Transient Heat Stress during the Tetrad Stage of Pollen Development. Plant Physiology. 181: 683–700.
Benjamins, R., and Scheres, B. (2008) Auxin: The Looping Star in Plant Development. Annual Review of Plant Biology. 59: 443–465.
Bolger, A.M., Lohse, M., and Usadel, B. (2014) Trimmomatic: a flexible trimmer for Illumina sequence data. Bioinformatics. 30: 2114–2120.
Breeze, E., Harrison, E., McHattie, S., Hughes, L., Hickman, R., Hill, C., et al. (2011) High-Resolution Temporal Profiling of Transcripts during Arabidopsis Leaf Senescence Reveals a Distinct Chronology of Processes and Regulation. The Plant Cell. 23: 873– 894.
Brunoud, G., Wells, D.M., Oliva, M., Larrieu, A., Mirabet, V., Burrow, A.H., et al. (2012) A novel sensor to map auxin response and distribution at high spatio-temporal resolution. Nature. 482: 103–106.
Cao, J., Spielmann, M., Qiu, X., Huang, X., Ibrahim, D.M., Hill, A.J., et al. (2019) The single-cell transcriptional landscape of mammalian organogenesis. Nature. 566: 496– 502.
Depuydt, S., and Hardtke, C.S. (2011) Hormone Signalling Crosstalk in Plant Growth Regulation. Current Biology. 21: R365–R373.
Fodor, N., Challinor, A., Droutsas, I., Ramirez-Villegas, J., Zabel, F., Koehler, A.-K., et al. (2017) Integrating Plant Science and Crop Modeling: Assessment of the Impact of Climate Change on Soybean and Maize Production. Plant Cell Physiol. 58: 1833–1847.
For Peer Review
Friml, J., Wiśniewska, J., Benková, E., Mendgen, K., and Palme, K. (2002) Lateral relocation of auxin efflux regulator PIN3 mediates tropism in Arabidopsis. Nature. 415: 806–809.
Görlach, J., Volrath, S., Knauf-Beiter, G., Hengy, G., Beckhove, U., Kogel, K.H., et al. (1996) Benzothiadiazole, a novel class of inducers of systemic acquired resistance, activates gene expression and disease resistance in wheat. The Plant Cell. 8: 629–643. Hayashi, K., Nakamura, S., Fukunaga, S., Nishimura, T., Jenness, M.K., Murphy, A.S., et al. (2014) Auxin transport sites are visualized in planta using fluorescent auxin analogs. PNAS.
Hayat, Q., Hayat, S., Irfan, Mohd., and Ahmad, A. (2010) Effect of exogenous salicylic acid under changing environment: A review. Environmental and Experimental Botany. 68: 14–25.
Hayman, L.L., Helden, L., Chyun, D.A., and Braun, L.T. (2011) A Life Course
Approach to Cardiovascular Disease Prevention. European Journal of Cardiovascular Nursing. 10: S20–S31.
Hirayama, T., and Shinozaki, K. (2010) Research on plant abiotic stress responses in the post-genome era: past, present and future. The Plant Journal. 61: 1041–1052.
Hwang, I., Sheen, J., and Müller, B. (2012) Cytokinin Signaling Networks. Annual Review of Plant Biology. 63: 353–380.
Jaillais, Y., and Chory, J. (2010) Unraveling the paradoxes of plant hormone signaling integration. Nat Struct Mol Biol. 17: 642–645.
Kim, J., Chang, C., and Tucker, M.L. (2015) To grow old: regulatory role of ethylene and jasmonic acid in senescence. Front Plant Sci. 6.
Ko, D., Kang, J., Kiba, T., Park, J., Kojima, M., Do, J., et al. (2014) Arabidopsis ABCG14 is essential for the root-to-shoot translocation of cytokinin. PNAS. 111: 7150– 7155.
For Peer Review
Kudo, T., Kiba, T., and Sakakibara, H. (2010) Metabolism and Long-distance Translocation of Cytokinins. Journal of Integrative Plant Biology. 52: 53–60.
Kuroha, T., Tokunaga, H., Kojima, M., Ueda, N., Ishida, T., Nagawa, S., et al. (2009) Functional Analyses of LONELY GUY Cytokinin-Activating Enzymes Reveal the Importance of the Direct Activation Pathway in Arabidopsis. The Plant Cell. 21: 3152– 3169.
Liao, Y., Smyth, G.K., and Shi, W. (2014) featureCounts: an efficient general purpose program for assigning sequence reads to genomic features. Bioinformatics. 30: 923– 930.
Mikami, K., Mori, I.C., Matsuura, T., Ikeda, Y., Kojima, M., Sakakibara, H., et al. (2016) Comprehensive quantification and genome survey reveal the presence of novel phytohormone action modes in red seaweeds. Journal of Applied Phycology. 28: 2539– 2548.
Mochida, K., and Shinozaki, K. (2010) Genomics and Bioinformatics Resources for Crop Improvement. Plant Cell Physiol. 51: 497–523.
Mochida, K., and Shinozaki, K. (2011) Advances in Omics and Bioinformatics Tools for Systems Analyses of Plant Functions. Plant Cell Physiol. 52: 2017–2038.
Mochida, K., Saisho, D., and Hirayama, T. (2015) Crop improvement using life cycle datasets acquired under field conditions. Front Plant Sci. 6.
Nagano, A.J., Kawagoe, T., Sugisaka, J., Honjo, M.N., Iwayama, K., and Kudoh, H. (2019) Annual transcriptome dynamics in natural environments reveals plant seasonal adaptation. Nature Plants. 5: 74–83.
Nagano, A.J., Sato, Y., Mihara, M., Antonio, B.A., Motoyama, R., Itoh, H., et al. (2012) Deciphering and Prediction of Transcriptome Dynamics under Fluctuating Field
Conditions. Cell. 151: 1358–1369.
Obayashi, T., Aoki, Y., Tadaka, S., Kagaya, Y., and Kinoshita, K. (2018) ATTED-II in 2018: A Plant Coexpression Database Based on Investigation of the Statistical Property
For Peer Review
of the Mutual Rank Index. Plant Cell Physiol. 59: e3–e3.Park, S.-Y., Fung, P., Nishimura, N., Jensen, D.R., Fujii, H., Zhao, Y., et al. (2009) Abscisic Acid Inhibits Type 2C Protein Phosphatases via the PYR/PYL Family of START Proteins. Science. 324: 1068–1071.
Pearlin, L.I., Schieman, S., Fazio, E.M., and Meersman, S.C. (2005) Stress, Health, and the Life Course: Some Conceptual Perspectives. J Health Soc Behav. 46: 205–219. Rahman, A. (2013) Auxin: a regulator of cold stress response. Physiologia Plantarum. 147: 28–35.
Rosenzweig, C., Elliott, J., Deryng, D., Ruane, A.C., Müller, C., Arneth, A., et al. (2014) Assessing agricultural risks of climate change in the 21st century in a global gridded crop model intercomparison. PNAS. 111: 3268–3273.
Ross, J.J., Weston, D.E., Davidson, S.E., and Reid, J.B. (2011) Plant hormone interactions: how complex are they? Physiologia Plantarum. 141: 299–309. Roy, S.J., Tucker, E.J., and Tester, M. (2011) Genetic analysis of abiotic stress tolerance in crops. Current Opinion in Plant Biology. 14: 232–239.
Sah, S.K., Reddy, K.R., and Li, J. (2016) Abscisic Acid and Abiotic Stress Tolerance in Crop Plants. Front Plant Sci. 7.
Santner, A., Calderon-Villalobos, L.I.A., and Estelle, M. (2009) Plant hormones are versatile chemical regulators of plant growth. Nat Chem Biol. 5: 301–307.
Sarup, P., Sørensen, P., and Loeschcke, V. (2014) The long-term effects of a life-prolonging heat treatment on the Drosophila melanogaster transcriptome suggest that heat shock proteins extend lifespan. Experimental Gerontology. 50: 34–39.
Schaller, G.E., Bishopp, A., and Kieber, J.J. (2015) The Yin-Yang of Hormones: Cytokinin and Auxin Interactions in Plant Development. The Plant Cell. 27: 44–63. Scheres, B., and van der Putten, W.H. (2017) The plant perceptron connects
For Peer Review
Shanker, A.K., Maheswari, M., Yadav, S.K., Desai, S., Bhanu, D., Attal, N.B., et al. (2014) Drought stress responses in crops. Funct Integr Genomics. 14: 11–22.
Takahagi, K., Inoue, K., Shimizu, M., Uehara-Yamaguchi, Y., Onda, Y., and Mochida, K. (2018) Homoeolog-specific activation of genes for heat acclimation in the
allopolyploid grass Brachypodium hybridum. Gigascience. 7.
Vanneste, S., and Friml, J. (2009) Auxin: A Trigger for Change in Plant Development. Cell. 136: 1005–1016.
Vanstraelen, M., and Benková, E. (2012) Hormonal Interactions in the Regulation of Plant Development. Annual Review of Cell and Developmental Biology. 28: 463–487. Varshney, R.K., Bansal, K.C., Aggarwal, P.K., Datta, S.K., and Craufurd, P.Q. (2011) Agricultural biotechnology for crop improvement in a variable climate: hope or hype? Trends in Plant Science. 16: 363–371.
Vermeulen, S., Zougmoré, R., Wollenberg, E., Thornton, P., Nelson, G., Kristjanson, P., et al. (2012) Climate change, agriculture and food security: a global partnership to link research and action for low-income agricultural producers and consumers. Current Opinion in Environmental Sustainability., Open issue 4: 128–133.
Vlot, A.C., Dempsey, D.A., and Klessig, D.F. (2009) Salicylic Acid, a Multifaceted Hormone to Combat Disease. Annu Rev Phytopathol. 47: 177–206.
Wani, S.H., Kumar, V., Shriram, V., and Sah, S.K. (2016) Phytohormones and their metabolic engineering for abiotic stress tolerance in crop plants. The Crop Journal. 4: 162–176.
Wilkinson, S., Kudoyarova, G.R., Veselov, D.S., Arkhipova, T.N., and Davies, W.J. (2012) Plant hormone interactions: innovative targets for crop breeding and
management. J Exp Bot. 63: 3499–3509.
Yang, D.-L., Yang, Y., and He, Z. (2013) Roles of Plant Hormones and Their Interplay in Rice Immunity. Molecular Plant. 6: 675–685.
For Peer Review
Yang, T., Lv, R., Li, J., Lin, H., and Xi, D. (2018) Phytochrome A and B Negatively Regulate Salt Stress Tolerance of Nicotiana tobacum via ABA–Jasmonic Acid Synergistic Cross-Talk. Plant Cell Physiol. 59: 2381–2393.
Figure legends
Figure 1. Overall structure of life-course hormone profile data of field barley.
The hormone profile data for the eight accessions throughout the life course (from germination to heading) were analyzed with tSNE and visualized individually. Spots indicate each sample (n = 3), and the numbers below them indicate the sampling weeks.
Figure 2. Transitions of hormone profile structure along with the growth progress.
Correlation maps of hormone profile data (IAA, tZ, iP, ABA, JA, and SA, n = 3) throughout the life course of accessions H602, J064, E612, and I304 are shown. Correlations among the hormone profiles in the life-course samples were calculated and are shown in heat maps (blue high, red low). Cyan squares indicate more highly correlated samples (average of the correlation coefficient of the samples in the row or column except samples on the diagonal line >0.25). Green triangles indicate the heading dates for each accession.
Figure 3. Fluctuations of phytohormones in field barley.
Fitted curves of the levels of IAA, tZ, iP, ABA, JA, and SA (average of three independent samples) of the eight accessions plotted along the life course.
Figure 4. IAA levels were affected mainly by developmental status, whereas tZ levels may have been influenced by environmental factors.
A, B) Comparison of the fluctuations in IAA levels among J064, J647, and J247 (A) and tZ levels among J064, H602, and J647 (B) with environmental data (amount of precipitation, average daily air temperature, maximum daily wind speed) for the field. C) Correlation map of IAA data (left panel) and tZ data (right panel) among accessions
For Peer Review
throughout the life course (1st to 20th weeks). The right half of each panel shows the correlations with one-week-shifted data (2nd to 21nd weeks) for each accession.
Figure 5. Changes in ABA and JA levels do not seem to be associated with field environmental factors.
Comparison of the fluctuations of the ABA and JA levels of the eight accessions with environmental data (amount of precipitation, minimum daily air temperature, maximum daily wind speed) for the field.
Figure 6. Identification of barley orthologs to Arabidopsis hormone-related genes.
A) Mapping of the barley orthologs of Arabidopsis genes reported to be involved in auxin, cytokinin, ABA, JA, and SA action to barley chromosomes. The center circle with bar graph indicates the gene numbers of the chromosome positions. From the center to the outermost ring, the positions of barley orthologous genes implicated in cytokinin (green), SA (blue), JA (red), ABA (green), and auxin (blue) are indicated. B) Overview of the transcriptome data for the barley orthologs of Arabidopsis auxin- (upper panel) or cytokinin-related (lower panel) genes. Transcriptome data for each gene were normalized with all samples of all accessions.
Figure 7. Expression profiles of several hormone-related gene orthologs of barley under field conditions.
Transcriptome data for the barley genes orthologous to Arabidopsis hormone-related genes. Among them, the transcripts with synchronized fluctuations among accessions throughout the life course (Dec. 7th, 2016, to April 5th, 2017) were further selected and are shown here. The transcriptome data (average of three biological replicates per sample) for each gene were standardized throughout the life course and are colored blue to red.
Supplemental data.
For Peer Review
accessions.Table S2: List of the hormone-related genes investigated.
Table S3: Transcriptome data of putative hormone-related genes of field barley. Figure S1: Map of the origins of barley accessions used in this study.
Figure S2: Environmental data for the test field used in this study from Dec. 2016 to May 2017. The environmental data were obtained with a field monitor and the local weather data from the database of the Japan Meteorological Agency.
Figure S3: Growth rates (cumulative leaf sheath length) of each barley accession in the test field.
Figure S4: Improvement in LC/MS method for hormone analysis. Shown are chromatograms of LC/MS/MS analysis of standard hormone samples using the previous (upper panel) and improved methods (lower panel). Peaks corresponding to each hormone are indicated.
Figure S5: Correlation map of ABA data (top panel), JA data (middle panel), and SA data (bottom panel) throughout the life course (1st to 20th weeks) for the eight accessions. The right half of each panel shows the correlations with one-week-shifted data (2nd to 21nd weeks) for each accession.
Figure S6: Overview of the transcriptome data for barley orthologs to Arabidopsis ABA- (top), JA- (center) or SA-related (bottom) genes. Transcriptome data for each gene were normalized with all samples of all accessions.
For Peer Review
The expression profiles of the barley genes orthologous to IAA3, LOG4, and PYL2, and CYP7073A are shown along with the levels of related hormones and several types of environmental data.
For Peer Review
Figure 1. Overall structure of life-course hormone profile data of field barley.
The hormone profile data for the eight accessions throughout the life course (from germination to heading) were analyzed with tSNE and visualized individually. Spots indicate each sample (n = 3), and the numbers
below them indicate the sampling weeks. 139x134mm (300 x 300 DPI)
For Peer Review
Figure 2. Transitions of hormone profile structure along with the growth progress.
Correlation maps of hormone profile data (IAA, tZ, iP, ABA, JA, and SA, n = 3) throughout the life course of accessions H602, J064, E612, and I304 are shown. Correlations among the hormone profiles in the life-course samples were calculated and are shown in heat maps (blue high, red low). Cyan squares indicate more highly correlated samples (average of the correlation coefficient of the samples in the row or column except samples on the diagonal line >0.25). Green triangles indicate the heading dates for each accession.
For Peer Review
Figure 3. Fluctuations of phytohormones in field barley.
Fitted curves of the levels of IAA, tZ, iP, ABA, JA, and SA (average of three independent samples) of the eight accessions plotted along the life course.
For Peer Review
Figure 4. IAA levels were affected mainly by developmental status, whereas tZ levels may have been influenced by environmental factors.
A, B) Comparison of the fluctuations in IAA levels among J064, J647, and J247 (A) and tZ levels among J064, H602, and J647 (B) with environmental data (amount of precipitation, average daily air temperature,
maximum daily wind speed) for the field. C) Correlation map of IAA data (left panel) and tZ data (right panel) among accessions throughout the life course (1st to 20th weeks). The right half of each panel shows
the correlations with one-week-shifted data (2nd to 21nd weeks) for each accession. 83x126mm (300 x 300 DPI)
For Peer Review
Figure 5. Changes in ABA and JA levels do not seem to be associated with field environmental factors. Comparison of the fluctuations of the ABA and JA levels of the eight accessions with environmental data
(amount of precipitation, minimum daily air temperature, maximum daily wind speed) for the field. 83x74mm (300 x 300 DPI)
For Peer Review
Figure 6. Identification of barley orthologs to Arabidopsis hormone-related genes.
A) Mapping of the barley orthologs of Arabidopsis genes reported to be involved in auxin, cytokinin, ABA, JA, and SA action to barley chromosomes. The center circle with bar graph indicates the gene numbers of the
chromosome positions. From the center to the outermost ring, the positions of barley orthologous genes implicated in cytokinin (green), SA (blue), JA (red), ABA (green), and auxin (blue) are indicated. B) Overview of the transcriptome data for the barley orthologs of Arabidopsis auxin- (upper panel) or
cytokinin-related (lower panel) genes. Transcriptome data for each gene were normalized with all samples of all accessions.
For Peer Review
Figure 7. Expression profiles of several hormone-related gene orthologs of barley under field conditions. Transcriptome data for the barley genes orthologous to Arabidopsis hormone-related genes. Among them, the transcripts with synchronized fluctuations among accessions throughout the life course (Dec. 7th, 2016,
to April 5th, 2017) were further selected and are shown here. The transcriptome data (average of three biological replicates per sample) for each gene were standardized throughout the life course and are colored
blue to red.