DOCTORAL DISSERTATION
GIS-BASED SOCIAL COST ANALYSIS ON INTEGRATED URBAN
WATER MANAGEMENT: A CASE STUDY OF SPONGE CITY IN
HARBIN
Graduate Programs in Environmental Systems
Graduate School of Environmental Engineering
The University of KITAKYUSHU
XUEZHOU FAN
[2021.03]
CONTENTS
CONTENTS i
ACKNOWLEDGEMENTS iii
LIST OF TABLES iv
List of figure v
LIST OF SYMBOLS AND ABBREVIATIONS vi
SUMMARY vii
Chapter 1. Introduction 1
1.1 Urban Flood 1
1.2 Urban Flood Countermeasures 3
1.2.1 Enhancing of Drainage Capacity Project 3
1.2.2 Integrated water resources management (IWRM) and Integrated urban water
management(IUWM) 4
1.2.3 Sponge City and its technologies 5
CHAPTER 2. Previous Studies and OBjectives 9
2.1 Previous studies 9
2.2 Objectives 11
CHAPTER 3. Methodology 12
3.1 Urban storm-inundation model 12
3.2 Social cost analysis model 13
CHAPTER 4. Social Cost-Benefit Analysis on Sponge City project from life cycle perspective 15
4.1 Simplified inundation model 15
4.1.1 Surface runoff calculation 16
4.1.2 Inundation result simulation 18
4.3 Calculation of Critical Precipitation without building Sponge City 28 4.4 Calculation of Critical Precipitation with building Sponge City Scenario 32 4.4.1 Detailed investment amount, construction area, and construction plan. 32
4.4.2 Extensive Green Roofs technology 34
4.4.3 Calculation of critical precipitation in scenario with sponge city 34
4.5 Cost–Benefit Analysis 35 4.5.1 Private costs 36 4.5.2 Private benefits 36 4.5.3 External costs 37 4.5.4 External benefits 38 4.5.5 Other categories 40 4.6 Results 42
CHAPTER 5. Social Cost-effectiveness analysis on drain replacement and Sponge city
project from life cycle perspective 44
5.1 Design of Corresponding two projects 44
5.1.1 Design and cost estimating basis of two projects 44
5.1.2 Design of two projects 44
5.2 Cost-effective analysis on drain replacement and sponge city project 47
5.2.1 private costs for Drain replacement Project 49
5.2.2 Private costs for sponge city project 49
5.2.3 External costs for drain replacement project 50
5.2.4 External costs for Sponge City project 52
5.3 Results 53
CHAPTER 6. Discussion and Conclusion 56
6.1 Discussion 56
6.2 Conclusion 59
APPENDIX: Table of CN value 61
REFERENCES 62
ACKNOWLEDGEMENTS
I would like to express my gratitude to my Supervisor Professor Toru Matsumoto, for his kindly guidance through the development of this thesis and give me the opportunity to study here.
I also want to offer my sincere thanks to Researcher Yong Liu Henan University, to give me a chance to collect the data; Professor Guoyun Zhou Nishinippon Institute of Technology, for his GIS lecture and Professor Shanghong Zhang North China Electric Power University for his hydrologic model advises.
I am deeply thankful to my wife, my parents and my friends for their love, inspiration and support.
LIST OF TABLES
Table 4.1 Specifications of car tire list. ... 23
Table 4.2 Data used in practical storm event simulation. ... 29
Table 4.3 Data used or obtained in assumed storm simulation. ... 31
Table 4.4 Simulated inundation results of assumed storm; (The depth values shown here are adjusted depth value, not the proper simulated depth). ... 31
Table 4.5 Previous researches on Extensive Green Roofs. ... 33
Table 4.6 Inventory shown in private and external separated way. ... 36
Table 4.7 Claims for Vehicle Wading Insurance from PING AN and PICC Insurance companies. ... 39
Table 4.8 Private costs (RMB/m2) and benefits (RMB/m2) only took place at the start time in life cycle from Extensive Green Roofs. ... 40
Table 4.9 Private costs (RMB/m2. year) and benefits (RMB/m2. year) took place on every year in life cycle from Extensive Green Roofs. ... 40
Table 4.10 External costs (RMB/m2) and benefits (RMB/m2) ) only took place at the start time in life cycle from Extensive Green Roofs. ... 41
Table 4.11 External costs (RMB/m2. year) and benefits (RMB/m2. year) took place on every year in life cycle from Extensive Green Roofs. ... 41
Table 5.1 Unit maintenance fee by drain diameter ... 49
Table 5.2 Traffic data in two links (target traffic time zone is from 7:00 am to 7:00 pm, 12 h, in one direction) ... 52
Table 5.3 Unit time value ... 52
Table 5.4 Unit cost for drain replacement project ... 53
LIST OF FIGURE
Figure 1.1 Waterlogged community by urban flood. ... 2
Figure 1.2 Open cut way for sewer pipe replacement project. ... 4
Figure 1.3 Imagination of sponge city prevalent technologies ... 8
Figure 4.1 Schematic diagram of water balance theory ... 17
Figure 4.2 Workflow for inundating simulation ... 22
Figure 4.3 Image of water-invaded car ... 23
Figure 4.4 Location of Nangang District, Harbin City in China (red part). ... 25
Figure 4.5 DEM of Nangang district, Harbin City. ... 26
Figure 4.6 Hydrology analysis results and boundary extracted result by ArcGIS... 27
Figure 4.7 Target area (green) and Renhe, Dacheng depressions... 27
Figure 4.8 Comparison between simulated and measured results in practical storm at Dacheng streets and Renhe Street. ... 31
Figure 4.9 The relationship curve between Total runoff and inundation depth ... 32
Figure 4.10 Construction location and detailed construction plan (Renhe Street is located in right of figure, Dacheng Street is located in top of figure) . ... 33
Figure 4.11 Extensive Green Roof technology (Approved desk introduced in this study is plastic tanker, which is lightweight and could be moved easily). ... 34
Figure 4.12 Boundary and inventory for sponge city cost–benefit analysis in life cycle ... 35
Figure 4.13 Ratio of each benefit in all benefits. ... 42
Figure 4.14 Comparison analysis results from two perspectives, private and social. ... 43
Figure 5.1 Location of target area and planning for drain replacement project (target area was divided into 10 sub-catchments, S1, S2…S10) ... 45
Figure 5.2 Planning for Sponge City (map scale is 1:15,000, green areas are green roofs and grey circles are sand ponds) ... 47
Figure 5.3 Boundary and inventory for drain replacement project ( inventory in circle are private cost) ... 48
Figure 5.4 Boundary and inventory for Sponge City project ( inventory in circle are private cost) ... 48
Figure 5.5 Comparison between two projects... 54
LIST OF SYMBOLS AND ABBREVIATIONS
DEM Digital Elevation Model GIS Geography Information System
IWRM Integrated Water Resources Management IUWM Integrated Urban Water Management
LCA Life Cycle Assessment LID Low Impact Development NPV Net Present Value
SCS-CN Soil Conservation Service Curve Number SWMM Storm Water Management Model
SUDS Sustainable Urban Drainage Systems UDSs Urban Drainage Systems
WSUD Water Sensitive Urban Design
SUMMARY
The recent increase in rainstorm waterlogging disasters has acutely threatened sustainable urban development in China. Traditional strategy to solve this problem was drainage capacity enhancing project, which aims at enlarging the discharge of rainwater. However, there is a new countermeasure emerged in Chinese cities: “sponge city”, which aims at enlarging the absorption of rainwater by increasing the curves of urban land.
This thesis endeavors to make an effectiveness analysis on this new countermeasure from life cycle perspective. A novel framework is built to analyze flood risk control benefit of sponge city by 3D simulating urban inundation result. The district of Nangang, Harbin city located in Northeast China was chosen as a case study area. We have come to the conclusion that by building a sponge city in the target area, when inundation depth need to be controlled below a target depth (300mm), maximum precipitation cannot be over 49.82 mm/h. Furthermore, though the assumed sponge city project is not effective from a private perspective, it is effective from a social perspective.
We also conducted a cost-effective analysis between traditional countermeasure and sponge city project. By building a framework to design and analyze the private and social costs of them in life cycle, in which two countermeasures have the same rainwater control capacity, we have come to the conclusion only considering private cost, sponge city unit cost is higher than traditional countermeasure project unit cost, whereas with considering external cost, sponge city was verified as competitive not only from an economical perspective but also from an environmental perspective.
CHAPTER 1. INTRODUCTION
From the 1980s until now, China has experienced a rapid urbanization increasing phase. In such a rapid process of urbanization, land use change from natural landscape (e.g., green spaces, vegetation areas, forestry, and soil surfaces) to urban land-use (e.g., commercial, residential, and industrial) has been unprecedented. In this way then, a reduction in permeable surfaces and rainfall infiltration has resulted in a lower retention capacity for storm water in urban areas and less recharge of underlying groundwater. Increasing of intense storms and climate change may further enhance these fluctuations and flood risks. Meanwhile, the upgrading of urban drainage systems lags behind these increasing risks. Many urban drainage systems in Chinese cities operate in exceedance of conditions for which they were initially designed [1]. For instances in Shenzhen, the urban runoff discharge increased by 12.9% from the 1990s to the 2010s, whereas in the same period runoff coefficient increased 13.4% which could make overflow occurs [2]; in Harbin, municipal drainage pump stations provide a drainage capacity of 135 m3/s, however according to standards to protect against moderate rainfall (25 mm/h), the city requires a drainage capacity of 185 m3/s [3].
1.1 Urban Flood
Urban flood is a major problem in many parts of the world and it is one of the most natural disastrous event which takes place every year. Flood mentioned here is not what happens when a river overflows its banks or when a hurricane drives a storm surge across a coastal neighborhood. Instead, it’s caused by excessive runoff in developed areas where the water doesn’t have anywhere to go (Figure 1.1). Urban flood can be linked to a major disaster, like hurricane and trillions gallons of rainfall. But more often it happens during more routine circumstances, appearing in the form of wet basements and sewer backups. Even small amounts of rain can overwhelm the deteriorated or inadequate infrastructure found in many neighborhoods, especially in impoverished, neglected, and socioeconomically isolated urban communities. The International Disaster Database shows from 1900 to 2017, the world has suffered 12,547 major natural disasters with a total of 22,989,400 deaths and economic losses of up to $290.28 billion [4]. Among these disasters, the flood disaster occurred the most frequently, resulting in the highest number of deaths and economic losses. It can be said that flood disaster is one of the most serious natural disasters affecting human society. In
2012, Hurricane Sandy caused widespread flooding of road networks in New York City, where firefighting vehicles could not reach fire sites and 122 houses were burned. In 2017, Hurricane Irma hit Florida, resulting in 123 deaths in the state, including 14 from a local nursing home. The hurricane has also caused large-scale rescue interruptions and power outages. In July 2018, big storm hit West Japan, there were 23 deaths and 2 people missing only in Hiroshima city. Disasters occurred in China similarly. On 21 and 22 July 2012, Beijing suffered the most severe storm and flood disaster in 61 years. The average rainfall in the city was 170 mm, and that in the city center was 215 mm. The storm caused 79 deaths, 10,754 cars were submerged, and 10,660 houses collapsed. In 2014, Guangzhou City in Guangdong Province suffered an extreme rainfall event, which caused many streets to become inundated and led to severe transport interruptions [5]. In 2016, Wuhan City in Hubei Province encountered a heavy rainstorm, in which 14 people died, 1 person went missing, and 32,160 ha of crops and vegetables were destroyed [6,7]. On 13 June 2018, Shenzhen, China, recorded its historically greatest rainfall, which caused serious floods with tremendous economic losses. Six people were killed, and more than 20,000 people were forced to evacuate.
1.2 Urban Flood Countermeasures
Urban flood, being a natural disaster, cannot be avoided; however, the losses occurring due to flooding can be prevented by proper flood mitigation planning. As such, it is necessary to have a proper estimation of flood extent and flood hazard for the different flow conditions so that proper flood evacuation and disaster management plan can be prepared in advance. Urban flood is a complex phenomenon which may occur in various forms such as: urban flooding due to high intensity rainfall; due to inadequate drainage and flooding caused by overtopping in the channels or rivers. Under the same disaster conditions, the flood control capacity determines the magnitude of the city’s losses in a flood disaster. The higher the city’s flood control capacity is, the smaller the damage caused by flooding. The disaster prevention capability of flood disasters is mainly determined by two aspects: the flood control capacity and the comprehensive response capacity. The former refers to the construction of disaster prevention infrastructures and drainage engineering measures, while the latter refers to the city’s ability to respond to disaster risks, which is related to the urban socio-economic level and the level of municipal facilities. In this research, we focus on the former aspect, in which the enlargement of drainage or storage of rain water is our targets.
1.2.1 Enhancing of Drainage Capacity Project
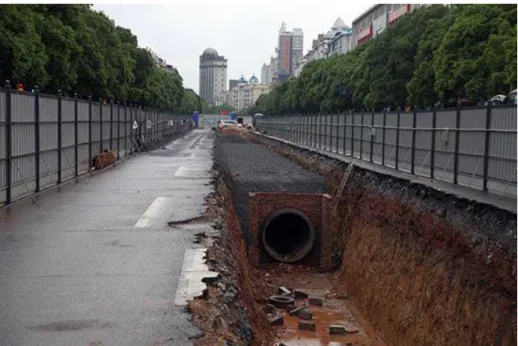
Traditionally, storm water systems, comprising storm water drainpipes, curb inlets, manholes, minor channels, roadside ditches and culverts, are designed to remove storm water from sites as quickly as possible to a main river channel or nearest large body of water to reduce on-site flooding. As described above, many urban drainage systems in Chinese cities operate in exceedance of conditions for which they were initially designed. Therefore, enhancing of drainage capacity project, in other words, enlarged or upgraded project of drainage pipe is required in these cities. Trenchless technology is a familiar construction method, materials and equipment that can be used for the installation of new, or rehabilitation of existing, underground utility systems with minimal surface disruption and destruction resulting from the excavation, however, high unit cost limits its utilization. In contrast, open-cut method could cause significant disruptions to traffic and adjacent commercial and industrial activities. however, owning to its low direct cost, open-cut method is used widely. In this research, we do not discuss the difference between these two construction ways, we designed our project executed in open-cut way during the following work (Figure 1.2).
Figure 1.2 Open cut way for sewer pipe replacement project.
1.2.2 Integrated water resources management (IWRM) and Integrated urban water management(IUWM)
Sustainability of vital ecosystems and the environment become important recently. Integrated water resources management (IWRM) is a well-established framework in the water sector which has been adopted by governments in all regions and at all levels of economic development. Defined by the Global Water Partnership as “a process which promotes the coordinated development and management of water, land and related resources, in order to maximize the resultant economic and social welfare in an equitable manner without compromising the sustainability of vital ecosystems”, it takes into account both human and ecological needs [8]. The city is a promising level for the adoption of IWRM both theoretically and practically as it corresponds to existing administrative and political units and to the spatial reach of much existing water infrastructure. Indeed, integrated approaches in the urban water sector are the focus of a growing body of literature. Concept has been proposed and considered for adoption, notably, Integrated Urban Water Management (IUWM) [9]. IUWM is an approach that includes: interventions over the entire urban water cycle; reconsideration of the way water is used (and reused); and greater application of natural systems for water and wastewater treatment. It provides an alternative to the
conventional approach for an effective and efficient management of scarce water resources. The global challenges of rapid urbanization and climate change adaptation in the midst of growing water scarcity is driving the need for a paradigm shift to Integrated Urban Water Management (IUWM). Besides, the term “Sustainable Urban Drainage Systems” (SUDS) used to describe storm water technology, was coined first by Jim Conlin of Scottish Water (October 1997) and a sustainable drainage triangle (quantity, quality, habitat) was initially set out by D’Arcy (1998) [10]. In practical application, there are Water Sensitive Urban Design (WSUD) in Australia, and Low Impact Development (LID) in the US and Water Circulation Regeneration Plan in Japan are similar concepts. While these concepts have different emphases, they are all linked to the principles of IUWM and are driven by a common concern to shift water management from traditional, centralized engineering-focused approaches towards water management as steering a partly self-organizing system.
1.2.3 Sponge City and its technologies
In recent years, IUWM has played a significant role in solving urban water-related problems, and the importance of IUWM is increasingly recognized by many countries, especially in the context of global urbanization and climate change. With the appearance of negative impacts of rapid urbanization and climate change on urban water system, it is high time for China to propose its own strategy of IUWM suitable to its own realities. Thus, by imitating, absorbing, and adapting the best practices from the strategies and programs mentioned above, and thereby incorporating special Chinese characteristics, the “sponge city” strategy was set forth in China eventually [11].
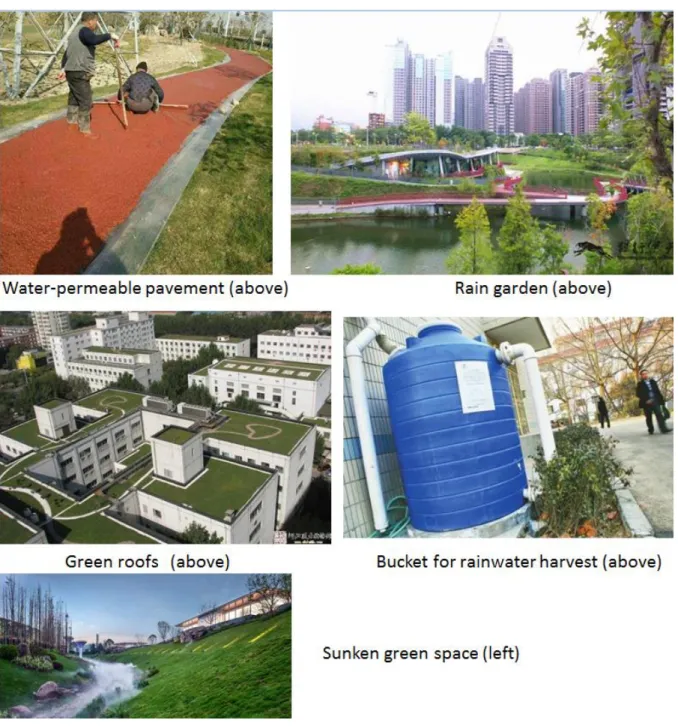
The sponge city concept aims to transform the urban planning process whilst promoting the conservation and creation of greener landscapes in urban areas and will engage more effectively with future land-use and spatial planning and also improves urban ecosystem diversity and social wellbeing. A “sponge city” refers to Integrated Urban Water Management (IUWM), which combines the management of water supply, groundwater, wastewater, and storm water in cities. Some prevalent technologies are applied in sponge city construction—such as water-permeable pavement, rain garden, green roofs and vegetative swales.
Water-permeable pavement is a method of paving vehicle and pedestrian pathways to enable infiltration of storm water runoff. Water-permeable pavement surfaces typically
include pervious concrete, porous asphalt, paving stones and interlocking pavers. Unlike traditional impervious paving materials, permeable paving systems allow storm water to percolate and infiltrate through the pavement and into the aggregate layers and/or soil below. In addition to reducing surface runoff, permeable paving systems can trap suspended solids, thereby filtering pollutants from storm water. The goal is to control storm water at the source, reduce runoff and improve water quality by filtering pollutants in the subsurface layers. Water-permeable pavement surfaces are made of either a porous material that enables storm water to flow through it or nonporous blocks spaced so that water can flow between the gaps. Storm water flows into and is stored in an underlying stone reservoir. Water-permeable pavement is commonly used on roads, paths and parking lots subject to light vehicular traffic, such as cycle-paths, service or emergency access lanes, road and airport shoulders, and residential sidewalks and driveways (Figure 1.3).
Rain garden, also called bio-retention facility, is one of a variety of practices designed to treat polluted storm water runoff. Rain garden is designed landscape sites that reduce the flow rate, total quantity, and pollutant load of runoff from impervious urban areas like roofs, driveways, walkways, and parking lots, and compacted lawn areas. Rain garden relies on plants and natural or engineered soil medium to retain storm water and increase the lag time of infiltration, while remediating and filtering pollutants carried by urban runoff. Rain garden provides a method to reuse and optimize any rain that falls, reducing or avoiding the need for additional irrigation. A benefit of planting rain garden is the consequential decrease in ambient air and water temperature, a mitigation that is especially effective in urban areas containing an abundance of impervious surfaces that absorb heat in a phenomenon known as the heat-island effect. Rain garden plantings commonly include wetland edge vegetation, such as wildflowers, sedges, rushes, ferns, shrubs and small trees. These plants take up nutrients and water that flow into the rain garden, and they release water vapor back to the atmosphere through the process of transpiration. Deep plant roots also create additional channels for storm water to filter into the ground. Root systems enhance infiltration, maintain or even augment soil permeability, provide moisture redistribution, and sustain diverse microbial populations involved in bio-filtration. Microbes help to break down organic compounds (including some pollutants) and remove nitrogen. Rain garden can improve water quality in nearby bodies of water and recharge depleted groundwater supply. Rain garden also reduces the amount of polluted runoff that enters the storm sewer system, which discharges directly to surface waters and causes erosion, water pollution and flooding. Rain
garden also reduces energy consumption by decreasing the load on conventional storm water infrastructure (Figure 1.3).
A green roof is a roof of a building that is partially or completely covered with vegetation and a growing medium, planted over a waterproofing membrane. It may also include additional layers such as a root barrier and drainage and irrigation systems. Container gardens on roofs, where plants are maintained in pots, are not generally considered to be true green roofs, although this is debated. Rooftop ponds are another form of green roofs which are used to treat greywater. Vegetation, soil, drainage layer, roof barrier and irrigation system constitute green roof. Green roofs serve several purposes for a building, such as absorbing rainwater, providing insulation, creating a habitat for wildlife, increasing benevolence and decreasing stress of the people around the roof by providing a more aesthetically pleasing landscape, and helping to lower urban air temperatures and mitigate the heat island effect. Green roofs are suitable for retrofit or redevelopment projects as well as new buildings and can be installed on small garages or larger industrial, commercial and municipal buildings. They effectively use the natural functions of plants to filter water and treat air in urban and suburban landscapes. There are two types of green roof: intensive roofs, which are thicker, with a minimum depth of 12.8 cm, and can support a wider variety of plants but are heavier and require more maintenance, and extensive roofs, which are shallow, ranging in depth from 2 cm to 12.7 cm, lighter than intensive green roofs, and require minimal maintenance. Rainwater harvesting facilities for both technologies could be the same like plastic bucket or sand pond (Figure 1.3).
Sunken green space, also called bio-swales, are shallow open channels lined with dense vegetation designed to treat, attenuate, and convey excess runoff. Sunken green space can replace curb or gutter systems and although they require more space, they manage runoff better. It is an accepted and commonly implemented sustainable urban drainage system in the built urban environment. Laboratory and field research has defined the effectiveness of a Sunken green space in sediment detention during a single rainfall-runoff event. Event mean concentrations of suspended and bed load sediment have been calculated using current best analytical practice, providing single runoff event specific sediment conveyance volumes through the swale (Figure 1.3). Sunken green space was verified as a kind of rainwater harvesting and utilization measure with functions of landscape, flooding peak reduction and
rainwater purification. Besides, sunken green space is more powerful than flat or raised green space in terms of rainwater harvesting and utilization.
CHAPTER 2.
PREVIOUS STUDIES AND OBJECTIVES
In this chapter, previous studies on sponge city and objectives in this study would be introduced.
2.1 Previous studies
As a new countermeasure to mitigate urban flood disaster, numerous studies have been conducted on analyzing the social benefits of sponge city or its technologies. For instance, Mentens et al. [12] showed that extensive roof greening (one type of green roofs) on just 10% of the buildings would result in a runoff reduction of 2.7% for that region and of 54% for the individual buildings. Furthermore, if 50% of regional builds roof were covered with extensive green, a reduction of 7.5% of the total runoff for the whole region could be achieved. Therefore, green roofs can be a useful tool for reducing urban rainfall runoff. Elizabeth et al. [13] showed that by building green roofs with the layer thickness between 50 and 150 mm, the runoff could be prevented if the precipitation is less than 25 mm in Auckland, New Zealand. Shao et al. [14] performed this benefits analysis by combining the primary technologies used in the construction of a sponge city in Xiamen City. Their quantitative analysis suggested that urban greening can reduce carbon emissions by 66,266.7 t/y, and the lake and river wetlands can reduce it by 962.8 t/y. Furthermore, the use of rainwater resources in this sponge city can reduce carbon emissions by 2719.1 t/y. Lin et al. [15] showed that in Shanghai city, after building sponge city facilities in target residential communities, the accumulated carbon sink after 18.8 years can equal the total amount of carbon emissions. Additionally, in the subsequent lifespan, these sponge city facilities can function as carbon emission reduction system by absorbing greenhouse gases. In the last 11 years of the 30year life cycle, the amount of net carbon emission absorbing benefit was calculated to be 25.4 t/y. Zhang [16] showed that in Beijing City, 2494 m3/ hm2 overflow was reduced by designed green spaces and a total volume of 154 million m3 rainwater was stored in these urban green spaces and the total economic benefit was estimated to be 1.34 billion RMB (RMB: Chinese currency, US$1 = RMB 6.83 present exchange rate, the same below).
There are also social costs–benefits analysis studies on this new countermeasure. Carter et al. [17] mentioned that green roofs can provide both private and social benefits and concluded that the average social benefit from using green roofs totaled $34.95/m2 and
private benefit was $26.70/m2 in Tanyard Branch watershed, Athens GA. Bianchini [18] concluded that from a social perspective, the total cost for building 600,000 m2 green roofs with a lifespan of 40 years would be 8,200–31,300 thousand RMB, and the total economic benefit would be 18,700–430,100 thousand RMB, and it would take six years for the investment to be paid back . From a personal perspective, the total cost for building 100 m2
green roofs with a lifespan of 40 years would be 43.4–368.1 thousand RMB, and total benefit would be 760–6700 thousand RMB, and it would take fourteen years for the investment to be paid back.
Then there are also many studies on social cost assessment of traditional urban flood countermeasure-urban drainage infrastructure. By identifying the eight most important social cost categories, Matthews et al. [19] calculated two pipe replacement projects in California US and Kessel-Dorp, Belgium separately, and concluded that for two cases the inclusion of social costs in the project cost estimate could make trenchless technology more advantageous in comparison with open-cut construction, and they also mentioned that these results are especially true for high density urban areas. Iwashita et al. [20] calculated appropriate renewal time by considering breakage risk and social costs for sewer pipe replacement project construction in open-cut way, which includes internal costs and external costs, and concluded that the renewal time has been extended when considering social costs, compared to only considering internal costs. Wang et al. [21] calculated and compared directed cost and social cost of drainage pipe rehabilitation projects in open cut way and non-open cut way respectively, and arrived at the conclusion that considering indirect costs, social costs of rehabilitation projects of the non-cut way are competitive with the cut way in Shanghai urban area.
However, benefits from sponge city or its technologies are mainly analyzed from overflow controlling volume calculation, greenhouse gases absorbing, rainwater retention, air pollution removal, and energy reduction etc. Benefits analyzing from reducing flood inundation depth (flood control perspective) is insufficient, in which benefits are brought from reduction of flooding loss for local residents (Bianchini has calculated a storm flood risk reduction benefit from a large scale of England and Wales national flooding loss perspective). Besides, on these two kinds of countermeasures, many studies of social cost analysis have been done individually, the comparative analysis between them based on same capacity of storm water control is insufficient.
2.2 Objectives
In this study, firstly we tried to estimate the sponge city effect on the decrease of inundation depth in micro-scale by using a hydrologic model and GIS (Geographic Information System) simulating model and analyze the costs and benefits from private and social perspectives in life cycle to figure out its effectiveness. Secondly by considering the local context, accounting for environmental, economic, and social factors we also tried to add a new parameter - precipitation to optimize sponge city building policy making—for urban designers to refer to. Thirdly we tried to build a framework to design and conduct comparative analysis on two kinds of project (two urban flood countermeasures based on same capacity of storm water reduction) from a case study in life cycle and propose the measuring method when making a project selection decision.
Therefore, in Chapter 4 we would design a sponge city project from a case study to analyze its cost and benefit and in Chapter 5 we designed two projects to conduct the comparative analysis between them. The framework of this research was as follows.
CHAPTER 3.
METHODOLOGY
As described in Chapter 2, benefit analysis from reducing flood inundation depth, which is from flood control perspective is insufficient. Therefore, in this study we tried to propose a framework to estimate the exactly reducing flood inundation depth and its benefit and conduct the social cost-benefit analysis from life cycle perspective. Methodology proposed in this study consists two parts. One is urban flood inundation model and one is social cost analysis model. Both of these two models would be conducted in Chapter 4 and only social cost analysis model would be conducted in Chapter 5.
3.1 Urban storm-inundation model
Urban storm-inundation models can be classified into three categories based on calculation algorithm, i.e., hydrologic, hydrodynamic, and simplified models. Common hydrologic models used to simulate urban flooding include the SWMM (Storm Water Management Model), UCURM (University of Cincinnati Urban Runoff Model), RRLM (Road Research Laboratory Model), ILLUDAS (Illinois Urban Drainage Area Simulator), TRRL (Transport and Road Research Laboratory), and others (Zhang, et al). Established by the US Environmental Protection Agency in the 1870s, SWMM is a typical urban storm-flooding hydrologic model [22]. It considers precipitation and runoff mechanisms in urban regions to simulate the process of rainfall runoff, and primarily simulates a single storm or successive rainfall events in an urban area. Many researches have been done on urban inundation with this model [23, 24]. There are also many case studies on urban storm inundation using hydrodynamic models [25, 26]. One-dimensional or two-dimensional hydrodynamic models have been used to simulate urban flooding process, and these models have been validated using urban storm flood data from Beijing, Shanghai, Tianjin, and Nanjing in China [27, 28], as well as other cities around the world. However, these models require large amounts of data such as on topography, sewer conveyance, and infiltration conditions, and some of these data can be difficult to obtain [29]. For instance, sewer system data of an urban region, including detailed locations, depths and pipe diameters, are often a challenge to collect. In addition, because of the complex morphology and boundary conditions of river and pipe networks, establishing physically-based models can be difficult, and a simplification process is necessary for an intricate underground pipe network. Further,
correlative calculation in storm-inundation simulation is complicated and requires substantial time to execute.
Owing to lack of data, the inundation simulating method introduced in this paper contains a simplified hydrologic model. This simulating method is mentioned by Zhang et al., and it consists of two parts, runoff calculation part and inundation result simulation part. This model is suitable to simulate pluvial not fluvial flooding such as breach break flooding. This simulation helps us to find the most flood-risky place and the optimal sponge city building location. For pluvial flood, the reduction of risk analysis is usually estimated from people’s safety risk, private property (including building and vehicle) and infrastructure loss perspective. In case of flood occurring, people are warned to stay at home when possible. However, analysis of flood loss has shown that people move in the surrounding of their home while pluvial flood is occurring; in particular, walking and driving in floodwaters are identified as the main danger during floods.
3.2 Social cost analysis model
Social cost mentioned in this study is the total cost to society for a project. It includes private costs plus external costs. Private costs refer to direct costs to the producer for producing the good or service. External costs are the costs incurred by an individual, firm or community as a result of an economic transaction which they are not directly involved in. Social cost includes these private costs and the additional costs (or external costs) associated with the production of the good for which are not accounted for by the free market. In short, when the consequences of an action cannot be taken by the initiator, we will have external costs in the society. We will have private costs when initiator can take responsibility for agent's action.
Specifically, in this study, the costs associating with the project’s building, operating and disposing directly are defined as private costs, otherwise, they would be defined as external costs. For instance, in Chapter 5, reduction of cooling energy consumption cost is private cost and the mitigation of heat island by green roof is considered as external effect (in fact, owning to lack of reliable data, mitigation of heat island by green roof was not calculated in this study). Additionally, social benefit, private benefit and external benefit are defined in the same way. For instance, in Chapter 4, rainwater harvesting is considered as private benefit and aesthetics is defined as external benefit.
In social cost (benefit) analysis model, costs and benefits mentioned in this research are listed in life cycle, which include material production, construction, operation, and disassembly phase. In Chapter 4, Cost-benefit analysis is used to make effectiveness analysis in which benefit-cost ratio (B/C) was defined as the ratio of benefits to costs, exceeding 1 is judged to be effective. Besides, two scenarios (with and without external costs) are assessed in life cycle, life span is set at 40 years and owing to the directive discount rate put forth by the Central Bank of PRC is between 3% and 4%; Net Present Value (NPV) in this study was calculated by discount rate at 4%. In Chapter 5, Cost-effectiveness analysis is used to determine the competitive countermeasure, in which to obtain the same overflow control effect the lower cost one could be the defined as the competitive countermeasure and this is expected to help urban designers to make policy choice; life span of two countermeasures is set at 50 years. Additionally, sponge cities designed in Chapter 4 and Chapter 5 were different (used the different technologies). In Chapter 4, rainwater harvesting was carried out by plastic bucket in which external cost on pollution during the production of polymers phase was included; however, in Chapter 5, rainwater harvesting was carried out by sand ponds. Considering the comparison analysis between drain (concrete pipe) replacement project and sponge city project, we chose to use the same material (concrete and sand) technology as far as possible to design two project in Chapter 5, in order to evaluate them in the same standard.
This study uses a LCA (Life Cycle Assessment) approach to analyze the social cost in the whole process of sponge city project and drain replacement project. Determining a reasonable social cost (benefit) accounting boundary and inventory is an essential step in studying the cost of sponge city project or drain replacement project. We would describe boundary and inventory detailed in the Chapter 4 and Chapter 5 respectively. Additionally, the input prices were gathered from different published and reliable sources as noted in the following section, and all the costs or benefits are introduced in RMB; the functional unit was calculated in RMB per square meter (RMB/m2) in Chapter 4, and functional unit was
CHAPTER 4.
SOCIAL COST-BENEFIT ANALYSIS ON SPONGE
CITY PROJECT FROM LIFE CYCLE PERSPECTIVE
In this chapter, we introduce the simplified inundation model at first, and then simulate storm inundation result in without or with sponge city two scenarios by a case study. Finally, we would conduct the cost-benefit analysis on target project.
4.1 Simplified inundation model
As mentioned above, some of urban hydrologic data could be very difficult to obtain, therefore inundation model introduced in this study is a simplified model and it is a model suitable to simulate pluvial not fluvial flooding such as breach break flooding. This model helps us to find the most flood-risky place and the optimal sponge city building location. For pluvial flood, the reduction of risk analysis is usually estimated from people’s safety risk, private property (including building and vehicle) and infrastructure loss perspective. In case of flood occurring, people are warned to stay at home when possible. However, analysis of flood loss has shown that people move in the surrounding of their home while pluvial flood is occurring; in particular, walking and driving in floodwaters are identified as the main danger during floods. However, as Monterusso et al. [30] concluded that green roofs do not have anticipated runoff control effect of extremely heavy rainfall, this paper only considers reduction of people’s safety risk and vehicle loss in a storm, not including building and infrastructure loss in extremely intensive rainfall situation. Flood risk is related to a number of factors not limited to rainfall or discharge but also including physical characteristics like elevation and depression, and the flood depth is one of the important elements [31]. We estimated the benefit from sponge city by quantifying the decrease of inundation depth, which can cause loss reduction. This model consists three parts, surface runoff calculation, inundation result simulation and critical inundation depth setting. Additionally, as mentioned above, the method mentioned by Zhang et al. is introduced here; two assumptions in this method—precipitation was considered as average precipitation and drainage speed was treated as a unified design drainage capacity—are applied in this paper.
4.1.1 Surface runoff calculation
A simplified hydrologic method: The Soil Conservation Service Curve Number (SCS-CN) method [32] is used to calculate the runoff. The SCS-CN method is a method of estimating rainfall excess from rainfall and excess could be calculated by water balance theory (Figure 4.1). The SCS-CN method was developed in 1954 and is documented in Section 4 of the National Engineering Handbook (NEH-4) published by the Soil Conservation Service (now called the Natural Resources Conservation Service), U.S. Department of Agriculture in 1956. The document has since been revised in 1964, 1965, 1971, 1972, 1985, and 1993. The SCS-CN method is the result of exhaustive field investigations carried out during the late 1930s and early 1940s and the works of several early investigators, including Mockus (1949), Sherman (1949), Andrews (1954), and Ogrosky (1956). The passage of Watershed Protection and Flood Prevention Act (Public Law 83-566) in August 1954 led to the recognition of the method at the Federal level and the method has since witnessed myriad applications all over the world. This approach is widely used as a simple method for predicting direct runoff volume for a given rainfall event. The CN parameter values corresponding to various soil, land cover, and land management conditions can be selected from tables, but it is preferable to estimate the CN value from measured rainfall-runoff data if available. The SCS-CN method is one of the most popular methods for computing the volume of surface runoff for a given rainfall event from small agricultural, forest, and urban watersheds. Many studies have been done with this method in China. With regard to water balance, total precipitation consists of infiltration, evaporation, surface runoff, and drainage system runoff. Among these, only surface runoff contributes to urban inundation.
Figure 4.1 Schematic diagram of water balance theory
The equation was shown by:
𝑅 = 𝑇𝑅 − 𝑆 − 𝐸
(1)R
: The amount of surface runoff (mm).TR
: The amount of total runoff (mm).S
: The amount of drainage system runoff (mm), which can be estimated by an average velocity of water drainage multiplied by storm duration. Design conveyance of the drainage system is used for the estimate of the average velocity of water drainage.E
: The amount of evaporation, which makes up approximately 0.5% of total rainfall volume of a three-day storm event [33], and it is not introduced here.TR is calculated by: (𝑃−0.05𝑠𝑟)2 (𝑝+0.95𝑠𝑟)
, 𝑃 ≥ 0.05𝑠𝑟
0, 𝑃 < 0.05𝑠𝑟
(2)𝑆𝑟 =
25400 𝐶𝑁− 254
(3)Sr
: The potential maximum soil moisture retention.CN: The runoff curve number, which embodies the empirical analysis on impact of soil infiltration capability and the type of land use. It could be obtained from Appendix A.
Finally, the amount of surface runoff (R) can be calculated by Equations (1) – (3).
4.1.2 Inundation result simulation
This simulation was conducted by ArcGIS software with elevation data Digital Elevation Model (DEM). Its operating principle was to use ArcGIS to extract boundary and divide basic calculating unit, sub-catchment, and then calculate the runoff volume for each sub-catchment by the confluence order.
4.1.2.1 Digital Elevation Model (DEM), Geography Information System (GIS) and Spatial Analyst
Digital Elevation Model (DEM) is the digital representation of the land surface elevation with respect to any reference datum. DEM is frequently used to refer to any digital representation of a topographic surface and it is used to determine terrain attributes such as elevation at any point, slope and aspect. Terrain features like drainage basins and channel networks can also be identified from the DEM. It is widely used in hydrologic and geologic analyses, hazard monitoring, natural resources exploration, agricultural management etc. To create DEM, there are two main methods. One is conversion of printed contour lines and one is photogrammetry. The former is conversion of printed contour lines and use it in raster or vector form. The elevation contours are "tagged" with elevations. Any other additional elevation data are created from the hydrography layer. Finally, an algorithm is used to interpolate elevations at every grid point from the contour Data. The latter is can be done manually or automatically. Manually, an operator looks at a pair of stereo-photos through a stereo-plotter and must move two dots together until they appear to be one lying just at the surface of the ground; automatically, an instrument calculates the parallax displacement of a large number of points.
Geographic Information System (GIS) is a computer system for capturing, storing, checking, and displaying data related to positions on Earth’s surface. By relating seemingly unrelated data, GIS can help individuals and organizations better understand spatial patterns
and relationships. GIS can use any information that includes location. The location can be expressed in many different ways, such as latitude and longitude, address, or ZIP code. Many different types of information can be compared and contrasted using GIS. The system can include data about people, such as population, income, or education level. It can include information about the landscape, such as the location of streams, different kinds of vegetation, and different kinds of soil. It can include information about the sites of factories, farms, and schools, or storm drains, roads, and electric power lines. With GIS technology, people can compare the locations of different things in order to discover how they relate to each other. For example, using GIS, a single map could include sites that produce pollution, such as factories, and sites that are sensitive to pollution, such as wetlands and rivers. Such a map would help people determine where water supplies are most at risk. A popular commercial GIS software is ArcGIS developed by ESRI, we do analysis on this software. There are many kinds of functions of ArcGIS, in this research, we use its Spatial Analysis function.
ArcGIS Spatial Analyst provides tools for comprehensive, raster-based spatial analysis. It helps with modelling terrains, performing hydrologic analysis, finding suitable locations and routes, and discovering spatial patterns. In this research, we used its Hydrology Tools to obtain overflow. To find depression area from DEM, pits should be filled using ArcGIS hydrology tools. We assume that the filled DEM is the same as the area where flow fills all the depressions. Then, depressions are calculated using the filled DEM minus the original DEM; the result gives the distribution of depressions. A D8 algorithm is used to calculate flow direction and divide the catchment. The specific Commands are as follows:
Fill_ Command Fills sinks in a surface to remove small imperfections in the data.
Flow direction_ Command takes a surface as input and outputs data showing the direction of flow out of each cell.
Flow accumulation_ Command calculates accumulated flow as the accumulated weight of all cells flowing into each downslope cell in the output data.
Detail were shown by the following steps.
Pits should be filled using ArcGIS hydrology tools. We assume that the filled DEM is the same as the area where flow fills all the depressions. Then, depressions are calculated by using filled DEM minus original DEM.
4.1.2.3 Dividing sub-catchment, extract boundary and find the confluence order
A D8 algorithm was used to calculate flow direction and divide the sub catchment. In the first step, hydrological tools were used in ArcGIS to calculate the flow direction and flow accumulation. In the second step, a threshold was set for flow accumulation to extract the stream (selecting depressions whose flow accumulations are greater than the threshold as flooded depressions), making sure to define all depressions on the extracted stream as the sub-catchment outlet node. Depressions not on the extracted stream were ignored because there is little water flow to them, and these depressions seldom become inundated. The depressions on the extracted stream were the potential inundated area, and the maximum storage volume and storage curve of these depressions were obtained using ArcGIS 3D analysis tools. In the third step, the sub catchment was divided based on flow direction, flow accumulation, and the defined node boundary was obtained by: Data Management Tools >> Features >> Feature to Polygon. There were two kinds of sub-catchment outlet node— depression point on the stream and the stream joint. Thus, the upstream catchment area for each depression and the convergence order between these depressions were obtained. The sub-catchment area was calculated using the ArcGIS attribute table Calculate Geometry Tool, and the confluence order of the depressions was obtained by the stream flow direction.
4.1.2.4 Calculating the runoff volume for each sub-catchment
According to the order from upstream to downstream, surface runoff volume for each depression was calculated by:
𝑉𝑖 = R × Ai (4)
Vi
: The surface runoff volume for depressioni
.Ai
: The catchment area for depressioni
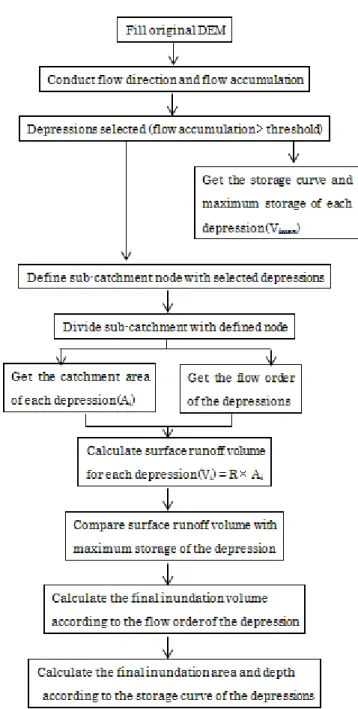
.The surface runoff volume Vi of each depression was compared with the maximum storage that the depression can hold. When Vi was found to be less than this maximum, it was taken as the final inundation volume of the depression and its inundation area and depth were calculated by its storage curve. Alternatively; when Vi exceeded the maximum water storage, the depression was assumed to have been completely filled and the excess water was transferred along the direction of the river network to the next depression, therefore depth and area of the depression are the final inundation results (Figure 4.2). Uncertainty of this modelling procedures are estimation of CN value and division of sub-catchment. CN value was estimated from empirical observation and sub-catchment was divided by ArcGIS software based on elevation information. Therefore, both of them should be calibrated and validated by practical inundation result.
Figure 4.2 Workflow for inundating simulation
4.1.3 Critical inundation depth setting
Sponge city was considered as a countermeasure to decrease the flood risk, therefore the direct effect on decrease of pedestrians’ injury or death and parking or driving cars water-invaded in storm flood is expected. Arrighi [34] set the critical flood depth for pedestrians at 1.7 m tall (the average Italian adult) and for cars at 300 mm. We set 1.61 m tall (the average Chinese adult) as critical flood depth for pedestrians and 300 mm for cars. In fact, for cars’
dangerous when rainwater depth exceeds half of car’s tire (Figure 4.3). The specifications of car tire from Standardization Administration of China are shown in Table 4.1. The specification was explained: take specification of “155 mm/65 R13” as sample, 155 mm is cross section width; 65 is the ratio of rubber thickness to cross section width (%); R means radial tire; 13 (inch) is wheel diameter. Therefore, the outer diameter of a tire could be calculated by: 155 mm× 65% × 2 +13 (inch) × 25.4 mm = 531.7 mm. Referring to Table 4.1, we observed that the average value of outer semi-diameter is 300 mm. In fact, there is a similar critical depth setting from JAF (Japan Automobile Federation) in Japan, which demonstrates that driving a car in 300 mm depth water with a speed of 30 km/h could cause the engine room to become water-invaded [35]. However, this test did not consider the effect from other cars driving in the water at the same time.
Figure 4.3 Image of water-invaded car
Table 4.1 Specifications of car tire list.
Specification Outer Diameter Outer Semi-Diameter 155 mm/65 R13 531.7 mm 265.85 mm 185 mm /60 R14 577.6 mm 288.8 mm 195 mm /55 R15 595.5 mm 297.75 mm 185 mm /65 R14 596.1 mm 298.05 mm 175 mm /70 R14 600.6 mm 300.3 mm 185 mm /65 R15 621.5 mm 310.75 mm 205 mm /55 R16 631.9 mm 315.95 mm 225 mm /40 R18 637.2 mm 318.6 mm 235 mm /60 R16 688.4 mm 344.2 mm
4.2 Study area
Harbin city is located in 126°34′–126°41′E and 45°41′–45°46′N and lies in mid-south section of Heilongjiang Province, in Northeast China (Figure 4.4). It has a temperate continental monsoon climate. Annual average precipitation is 569.1 mm. Most drainage system in Harbin is confluence pipe and was first established in 1904, and the main part of the city has 1161 km of municipal, sewer drains, 24,483 check wells, 14,381 rain wells, and a drainage network penetration rate of 66.17%, drainage system design conveyance capacity was 18 mm/h. Harbin’s municipal drainage pump stations provide a drainage capacity of 135 m3/s. According to standards to protect against moderate rainfall (25
mm/h), the city requires a drainage capacity of 185 m3/s. Therefore, serious waterlogging occurs in the city with only moderate precipitation. Statistics show that Harbin has 17 large waterlogging regions with 0.5–1.0 m water depth lasting 1–3 h [36].
The district of Nangang is located in mid-west section of Harbin City, Heilongjiang Province in China (Figure 4.4), it has 103 million and is one of densely-populated areas in Northeast China. Nangang District has many famous streets, like Guogeli Street and it is also famous as there are several excellent universities are located here, like Harbin Institute of Technology.
Figure 4.4 Location of Nangang District, Harbin City in China (red part).
Topographic input is a 1:2000 Nangang district contour map. The following steps were conducted.
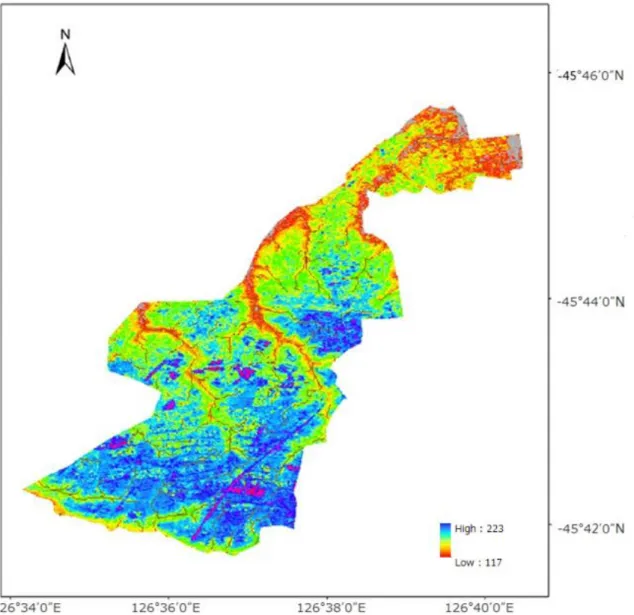
(a) Convert the contour map into TIN-based DEM by conducting: [3D analyst Tools] >> [Data Management] >> [TIN] >> [Create TIN]; and then convert TIN-based DEM into raster DEM at 2 m resolution by conducting: [3D analyst Tools] >> [Conversion] >> [From TIN] >> [TIN to Raster]; buildings heights are not considered in DEM generation. Therefore, we obtained the raster DEM of Nangang district, and it has an elevation range 117.1–223.1 m above sea level (Figure 4.5).
(b) Conduct [Spatial analyst Tools] >> [Hydrology] >> [Fill]>> [Flow Direction] >> [Flow Accumulation] >> [Basin], then conduct: [Conversion Tools] >> [From Raster]>> [Raster to Polygon] (threshold value set as 1%×maximum accumulation) (Figure 4.6).
(c) Conduct [Data Management Tools] >> [Raster] >> [Raster Processing] >> [Clip] (Figure 4.7). Based the DEM analyzing, we found that north (up) area is lower than south (down) area, and stream flows from south to north. This is also verified by Zhang [12]. We clipped a separate area (green part) DEM (Figure 4.7) to simulate the inundation result. Due to the boundary being extracted from ArcGIS analysis, green part area is an independent basin, no coming water from upstream. Then we simulate the inundation result with DEM of green part, obtained the storage curve and maximum storage volume of each depression on the stream, and delineated watershed (sub-catchment) by defining outlet nodes.
Based on GIS analysis of land use maps of this area, we also concluded that the percentage of impervious area to this area is estimated as 69.6%; the green part area is 8.6 km2, curve number is 91. We noticed that no depression existed on the extracted stream whose maximum inundation depth surpassed 1.61 m (divided maximum storage volume by corresponding inundation area in storage curve), which means low risk for people’s safety. Then we considered car’s water-invaded risk.
Figure 4.6 Hydrology analysis results and boundary extracted result by ArcGIS.
4.3 Calculation of Critical Precipitation without building Sponge City
As mentioned above, the 300 mm inundation depth was the critical value leading to car’s becoming water invaded. Besides inundation depth, the area of inundation is another crucial factor. Small area inundation spots were excluded because they would not lead to massive car water-invasion. Based on observation of maximum storage volume of each depression, we found that maximum storage volumes of Renhe depression and Dacheng depression (Figure 4.7) are huge and very easy to become large inundation areas by heavy rainfall (two depressions are confluence spots of the obtained stream). Therefore, we tried to obtain the precipitation value in which case Renhe depression and Dacheng depression would be inundated at 300 mm.
It was very difficult to obtain the just 300 mm inundation depth practical situation and its precipitation data at that time, therefore we assumed a storm which leads to 300 mm (or close) depth inundation at Renhe and Dacheng depression. In order to make the simulated result close to the practical conditions, we simulated firstly the practical storm event inundation result that took place on 4 June 2009, which was a two-hour duration event, with rainfall amount 15.4 mm in the first hour and 42.1 mm in the second. The input data was shown in Table 4.2 and the simulated results at Renhe and Dacheng streets were shown in Figure 4.8. Then we simulated the assumed storm event; considering the difference (error) between the simulated and the measured results (Figure 4.8) in practical storm simulation, we took the average depth (between simulated depth and measured depth) as the starting depth. For example, for Renhe street, the average depth for measured and simulated depth was 231 mm, and the difference between this value and 300 mm inundation depth is 69 mm. We knew the corresponding elevation of “input surface” (ArcGIS 3D Analysis tools) when the inundation volume is 584 m3 (Figure 4.8), therefore we could obtain the target inundation volume by adding 7 cm to the elevation of the “input surface” mentioned above from ArcGIS 3D analysis tools. After target inundation volume was obtained, the target inundation area could be calculated by this volume and its storage curve. Conduct the same steps at Dacheng Street, and the requirement satisfied volume and area could be calculated. After target volumes at two streets were obtained, we conducted the order mentioned in first part this chapter by enlarging the surface runoff (R) gradually from 7.29 mm (surface runoff occurred in practical storm inundation situation) until these target volumes (or close) arising in Renhe and Dacheng streets respectively. The simulation has shown that Renhe Street reached 300
mm inundation depth first, and then Dacheng Street reached. Surface runoffs (R) at that time were recorded as 11.42 mm and 12.58 mm, respectively. Adding to drainage capacity (S) 18 mm, with potential maximum soil moisture retention (sr) 25.12 mm and equation (2), (3), we obtained the corresponding precipitation as 47.6 mm/h and 48.2 mm/h respectively. We took the greater one (benefit analysis below was calculated based on the worst situation). Used or obtained hydrologic data and final inundation results were shown in Table 4.3 and Table 4.4 respectively. The relationship between total runoff and inundation depth are shown in Figure 4.9 (Two functions were educed from simulated results at two places respectively). From it we concluded that when total runoff (mm) is closing to 18 mm, inundation depth is close to 0 mm, which means the sewer system drain all of total runoff. We also concluded the inundation depth in Renhe Street increases faster than inundation depth in Dacheng Street.
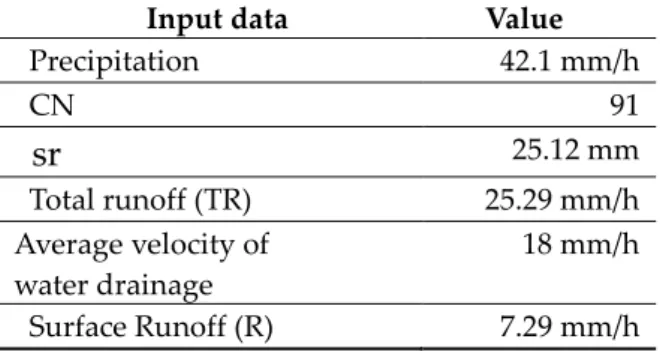
Table 4.2 Data used in practical storm event simulation.
Input data Value Precipitation 42.1 mm/h CN 91 sr 25.12 mm Total runoff (TR) 25.29 mm/h Average velocity of water drainage 18 mm/h Surface Runoff (R) 7.29 mm/h
200 182 200 262 0 50 100 150 200 250 300
a) Comparison between simulated and
measured depth in Dacheng Street (left)
and Renhe Street (right)
2000 2596 2500 2231 0 500 1000 1500 2000 2500 3000
b) Comparison between simulated and
measured area in Dacheng Street (left)
Figure 4.8 Comparison between simulated and measured results ( a), depth; b), area; c), volume) in practical storm at Dacheng streets and Renhe Street.
Table 4.3 Data used or obtained in assumed storm simulation.
Input data Value Precipitation 48.2 mm/h CN 91 sr 25.12 mm Total runoff (TR) 30.58 mm/h Average velocity of water drainage 18 mm/h Surface Runoff (R) 12.58 mm/h
Table 4.4 Simulated inundation results of assumed storm; (The depth values shown here are adjusted depth value, not the proper simulated depth).
Simulation results Renhe Street Dacheng Street Depth 359 mm 301 mm Area 5697 m2 4876 m2 Volume 2218 m3 1456 m3 400 472 500 584 0 100 200 300 400 500 600 700
c) Comparison between simulated and
measured volume in Dacheng Street (left)
Figure 4.9 The relationship curve between Total runoff and inundation depth
4.4 Calculation of Critical Precipitation with building Sponge City Scenario
In order to mitigate serious waterlogging, a sponge city project was designed in target area. Considering the target area is located in dense buildings district, housing demolition and relocation (making space for building rain garden or water-permeable pavement) fee are very high, therefore building green roofs on existing mansions is optimal technology.
4.4.1 Detailed investment amount, construction area, and construction plan.
According to the Bid Winning Announcement of Qunli Healthy Ecological Garden [37] (Completed sample program of sponge city in Daoli District, Harbin city), the total winning price was 101 million RMB (included construction fee 83 million RMB, construction period is 1 year). Here we assumed that an equal construction fee (83 million RMB) sponge city was designed to be built in the case study area (construction period is 1 year). Due to the building fee for Extensive Green Roofs being low and its maintenance convenient, Extensive Green Roof technology is recommended for building green roofs on top of old buildings. Based on previous researches on Extensive Green Roofs (Table 4.5), the unit construction fee was introduced as 141 RMB/m2 and maintenance fee was 12 RBM/m2 (introduced by Beijing standard). Therefore 592 thousand m2 Extensive Green Roofs could
Dacheng street), the place in upstream of Renhe and Dacheng streets is anticipated to be the optimal construction place. Detailed construction plan was shown in Figure 4.10.
Table 4.5 Previous researches on Extensive Green Roofs.
Existing Study
Country Unit Construction Fee Unit Maintenance Fee
Wan Jing (2009) China (Shang- hai) 50–60 (RMB/m2) 14.5–20.75 (RMB/m2) Beijing Institute of Landscape [38] (2014) China (Beijing) 130-141 (RMB/m2) 10-12 (RMB/m2) Bianchini (2012) America 800–3360 (RMB/m2) 40–80 (RMB/m2) English Nature (2003) England 180–220 (RMB/m2) 30–50 (RMB/m2)
Figure 4.10 Construction location and detailed construction plan (Renhe Street is located in right of figure, Dacheng Street is located in top of figure) .
4.4.2 Extensive Green Roofs technology
Extensive Green Roofs contains three layers, of which Growing media is on the top, Drainage layer and Waterproofing layer are beneath, and all the layers are built on top of concrete or approved deck (Figure 4.11). Vegetation of sedum lineare Thunb is used in growing media, and the thickness of growing media is designed as 10 cm.
Figure 4.11 Extensive Green Roof technology (Approved desk introduced in this study is plastic tanker, which is lightweight and could be moved easily).
4.4.3 Calculation of critical precipitation in scenario with sponge city
Owing to the construction of Extensive Green Roofs, the impervious area percentage to target area is reduced to 62.7% from 69.6%, the value of CN is estimated to decrease to 90 from 91, and sr is estimated to increase to 28.22 from 25.12. In order to find the critical state and obtain the same inundation result shown in Table 4.4 (due to water absorbing by sponge city, the inundation result does not change even with a greater precipitation), total runoff (TR) should be satisfied with 30.58 mm. Therefore, with TR = 30.58 mm, sr = 28.22 mm and Equation (2), the critical precipitation was calculated as 49.82 mm/h. This result indicates that by building a sponge city described above, the critical value of precipitation we can control the inundation depth below 300 mm is 49.82 mm/h, and if the precipitation surpasses this value, only this sponge city cannot reduce the flood risk of cars becoming water-invaded.
As mentioned above, the inundation depth is controlled under 300 mm, which is low risk for car water-invasion and whose loss was huge in many urban waterlogging disasters. Therefore, the decrease of car loss is an obvious benefit for the cost–benefit analysis.
4.5 Cost–Benefit Analysis
Private cost–benefit and social (including private and external) cost–benefit two scenarios are analyzed in this chapter. Boundary and inventory are shown in Figure 4.12 and inventory separated in private and external way are shown in Table 4.6. Additionally, all the costs are introduced in RMB, and functional unit data was calculated in RMB per square meter (RMB/m2). The detailed costs and benefits are shown as follows.