Tech. Bull. Fac. Agr
.
Kagawa Univ..ON
DROP SIZE DISTRIBUTIONS IN SPRAYS
EMITTED
BY
A
SPRINKLER UNDER DIFFERENT
CONDITIONS
Introduction
As is generally known, the factors either directly or indirectly affecting application efficiencies in sprinkler irrigation are drop size, air temperature, wind speed, specific humidity and precipitation rate. Of these factors it seems to be highly necessary to acquire reliable and practical information relative to drop sizes as produced by a sprinkler operated under varying conditions of nozzle size and pressure.
A water drop falling upon a n open soil surface expends its energy in breaking down the soil particles into smaller pieces or in moving them so that the interstices of the surface layer are choked, Such action of choking the tiny cracks in the soil surfaces causes to interfere with the inward and outward movement of air so essential for plant growth, and also the inward movement of water subsequently falling upon the surf ace.
In some cases, growing crops may be injured by its vigorous spray or by wetting of the leaves or fruits
In sprinkler irrigation, moreover, there are losses other than those from wet soil surfaces, common to all irrigation methods If sprays involve a higher percentage of fine water droplets, i t will lead to loss of fine droplets due to wind drift and evaporation loss from fine droplets due to increasing surface area
For the above reasons, considerable attention should be devoted to drop size distribution of sprays emitted by a sprinkler
Many attempts have been made to clarify the mechanism of breakup of a jet issuing from a n orifice as a solid stream of liquid with only one principal velocity component(5 tB *lo). However, few of the drop-size studies reported cover the capacity range encountered in most commercial sprinkler heads. I t is a matter for regret , furthermore, that the methods of reporting drop-size data and correlating the results show wide variations and there are consider able discrepancies among the data. Of course, corr elations which try to relate the drop-size distribution to secondary variables such as orifice diameter and pressure are almost certain to be highly specific and difficult to relate to the data from studies on other nozzles, as pointed out by MARSHALL.
Little work has been done on the problem of determining the drop-size distribution in sprays emitted by a sprinkler. There is a need to develop suitable sprinklers which will maintain required performance over a wide range of operating conditions,
In a previous paper(' ), a report was made on the drop size distribution and evaporation losses from spray droplets, emitted by a sprinkler. The author thought the experiment regarding the drop size distribution might be interesting and valuable to repeat under different conditions. The work recorded in this paper, therefore, is a continuation and amplification of the study
Methods
The methods used in this study have been fully described in a previous paper('), and only a brief outline needs to be given here..
Vol.
14,
No.2
(1963)
of make T - S 30 (Toyo Sprinkler K.K.). Angle of elevation of nozzle was 30 degrees.
T h e drop-size recording instrument was used for measuring the size and number of water drops falling on the ground surface a t certain distance from the sprinkler. A detailed description of i t will be found in Ref.1.
The instrument was placed successively up to a distance of 15 m from the sprinkler a t intervals of 1 5 m . Beneath the window of t h e drop-size recording instrument, a roll of filter paper was moved with such speeds a s to prevent the stains from overlapping. During each revolution of the sprinkler, t h e sprays due t o splashing by the oscillating a r m , the drops from large orifice, and finally t h e drops from small orifice falling through the window left stains on the moving filter paper, which had previously been lightly dusted with a mixture of eosin and talc. Recordings for two or three complete revolutions of t h e sprinkler a t each respective distance were carried out under approximately no wind conditions and a t operating pressures of 2.0 and 3 Okg/cm2.
The fine mist evident particularly a t higher pressures could not be measured in regard t o droplet size. We estimated the drops larger than 230p, corresponding to a stain diameter of 0 5mmC1 12), because t h e drops less than 230p could not be measured satisfactorily using the filter paper method. As any slight air movement was enough to carry away these small drops, the reliable evaluation of them would not have been made out
Under normal conditions a correction for evaporation losses becomes necessary in determining the drop sizes. However, these tests had been carried out in the evening, after sunset, in late fall, so. that no corrections were made for losses due to evaporation.
By such a process, we could obtain the number and then the volume of drops within the various size.classes of stains a t various distances from the sprinkler. Drops from the large orifice, the small orifice and due to splashing of the oscillating arm were treated separately The volume of droplets due to splashing of the oscillating arm was negligibly small compared with others.
Let the radial distance from the sprinkler, where water drops are caught, be R, the area of the window A and the volume of drops per size class falling through the window m. Counting the number of drops per size class a t various distances from the sprinkler and then integrating over the area covered in the manner previously descrided, the volume per size class per one revolution of drops emitted by the sprinkler will be estimated
Accordingly, dividing the volume of drops per size class per unit time by the flow rate from orifice, we g e t the volume fraction per size class of drops emitted by the sprinkler, given by
2
AV = --z- CmRAR ATQ R
in which T i s the rotational period of the sprinkler and Q the flow rate from orifice. The values of T were 68..0, 72.3 and 80.7 sec a t pressures of 2..0, 2..5 and 3,.0 kg/cmz, respectively. Values Q were 402, 437 and 463 cc/sec for the large orifice and 170, 185 and 200 cc/sec for the small orifice, a t operating pressures of 2..0. 2.5 and 3 0 kg/cm, respectively.. In our investigations the distance interval of AR was 1.5m.
Sampling by allowing drops to pass through the window of the recording instrument is clearly subject to error.. An error due to drops grazing the window edge would be diminished by a n increase in window-width. However, oblique motion of drops causes the error to increase. Due t o this error correction factors expected from geometry had to be applied, especially to large drops.. Some drops may strike on the surface of the recording instrument and splash out. As a result, some of splashes which does not belong to the sample of sprays would fall through the window on t h e filter paper. This error could be reduced by covering the surface of the box around the window with absorbent sponge
16
2
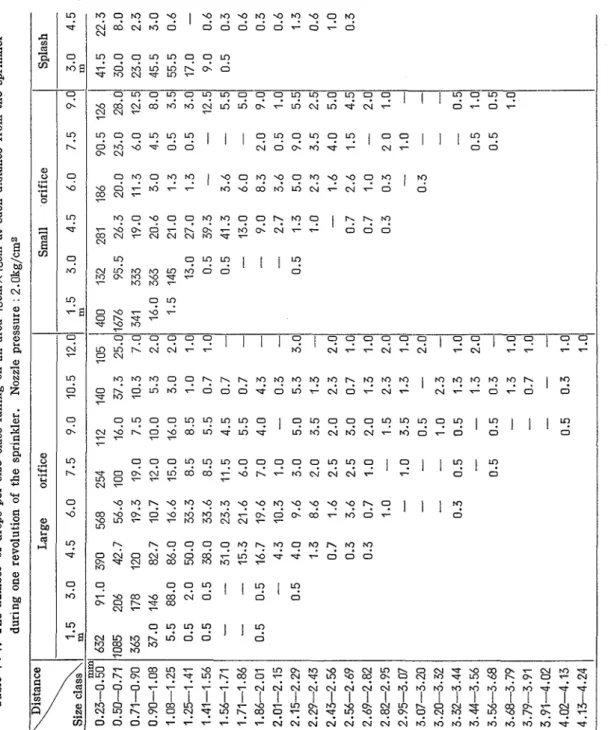
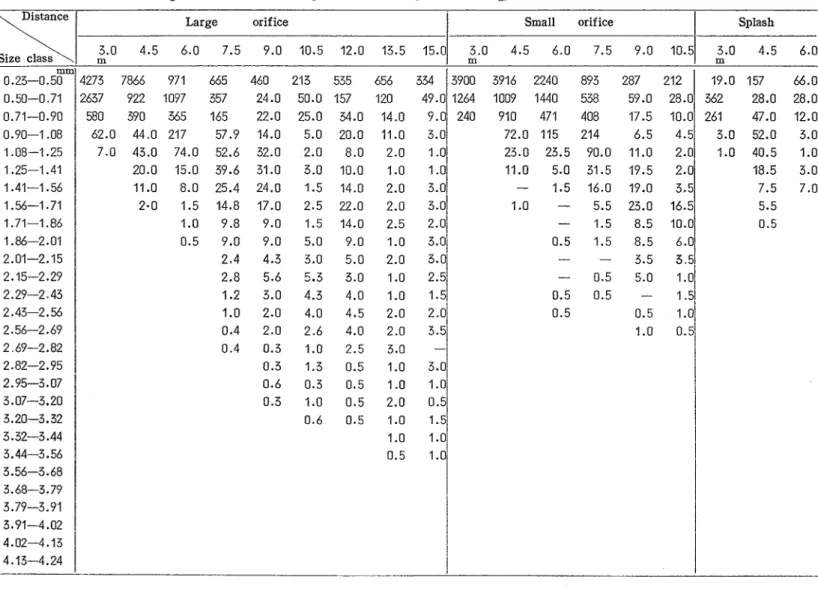
Tech. Bull. Fac. Agr. Kagawa Univ. Results and DiscussionsTable 1 gives the resulting data in the form of the number of drops per size-class falling on the area
10cmx10cm a t different distances from the sprinkler during one revolution of the sprinkler. These values are the mean of two or three recordings. Accordingly, the volume fractions per size-class per
unit time of drops emitted by the sprinkler are calculated by using Eq. ( I ) from the data given in
Table 1, in such a manner a s previously described. The volume fractions per size-class of sprays a t
Table 1 : 2. The number of drops per size-class falling on an area 10cmx10cm at each distance from the sprinkler C
e.
during one revolution of the sprinkler. Nozzle pressure : 3.0kg/cm2
I- b e -
Distance Large orif ice Small orif ice Splash
z
3.0 4.5 6.0 7.5 9.0 10.5 12.0 13.5 15.0 4.5 6.0 7.5 9.0 10.5 c.3 Size class A 0.23-0.5;~ 0.50-0.71 0.71-0.90 0.90-1.08 1.08-1.25 1.25-1.41 1.41-1.56 19.0 157 66.0 0 3!s
W 362 28.0 28.0-
261 47.0 12.0 3.0 52.0 3.0 1.0 40.5 1.0 18.5 3.0 7.5 7.0 4273 7866 971 665 460 213 535 656 334 '3900 3916 2240 893 287 212 5.5 0.5 2637 922 1097 357 24.0 50.0 157 120 580 390 565 165 22.0 25.0 34.0 14.0 62.0 44.0 217 57.9 14.0 5.0 20.0 11.0 3.0 1.56-1.71 2.0 1.5 14.8 17.0 2.5 22.0 2.0 3.01 1.0-
5.5 23.0 16.5 49.01264 1009 1440 538 59.0 28.0 9 . 0 2 4 0 910 471 408 17.5 10.0 72.0 115 214 6.5 4.5 1.71-1.86 1.86-2.01 7.0 43.0 74.0 52.6 32.0 2.0 8.0 2.0 1.01 23.0 23.5 90.0 11.0 2.0 20.0 15.0 39.6 31.0 3.0 10.0 1.0 11.0 5.0 31.5 19.5 2.0 11.0 8.0 25.4 24.0 1.5 14.0 2.0 - 1.5 16.0 19.0 3.5 1.0 9.8 9.0 1.5 14.0 2.5 2.01 - 1.5 8.5 10.0 0.5 9.0 9.0 5.0 9.0 1.0 3.01 0.5 1.5 8.5 6.0 2.01-2.15 2.4 4.3 3.0 5.0 2.0 - - 3.5 3.51 2.15-2.29 2.8 5.6 5.3 3.0 1.0::I
-
0.5 5.0 1.01 2.29-2 43I
1.2 3.0 4.3 4.0 1.0 1.5, 0.5 0.5-
1 .51 2.43-2.56 1.0 2.0 4.0 4.5 2.0 2.0' 0.5 0.5 1.01 2.56-2.69 0.4 2.0 2.6 4.0 2.0 3.51 1 . 0.51 2 69-2.82I
0.4 0.3 1.0 2.5 3.0-I
I 2.82-2.95 1 0.3 1.3 0.5 1.0 3.0, 2.95-3.071
0.6 0.3 0.5 1.0 1.0i
3.07-3.20I
0.3 1.0 0.5 2.0 0.5 3.20-3.32 3.32-3.44 3.44-3.56 3.56-3.68 3.68-3.79 3.79-3.91 3.91-4.021
i
I
4.02-4.131
1
I
4.13-4.241
I
I
i
C.L m W 0.6 0.5 1.0 1.5 1.0 1.0 I 0.5 1.0I
164
Tech. Bull. Fac. Agr.
Kagawa Univ..
Table 2, Volume percents per size-class a t nozzle investigations will be described in detail, together Pressures of 2-0 and 3.0kg/cm. : with those obtained a t an operating pressure of Large orifice, S . 0 : Small orifice----
-- 2.5kg/cm2. For those a t an operating pressure ofPressure
1
2.0 lrg/cm21
3.0 kg/cm2 2.5 kg/cm2, readers are referred to Ref. 1.Size class S.O.
%
1
L O .%
S.O..%
I
(A) Cumulative volume percent of sprays At the outset, the cumulative volume fraction of sprays emitted by the sprinkler will be discussed. The total volume percent occupied by all drops smaller than a particular size was plotted against the size of drop in Fig. 1.It will be noted from these figures that in the respective orifice, large and small, the summation curves vary with nozzle pressures, particularly in case of increasing from 2 0 kg/cm2 to 2.5 kg/cm2. The fraction of large drops was found to reduce notably with increasing nozzle pressure. The volume percents of drops smaller than 0.5mm were in range of 30 to 35 percent in the large orifice and 25 to 30 percent in the small orifice I t may be inferred, consequently, that a fairly large quantity of drops smaller than 0.5mm is emitted by the sprinkler used and falls on the ground This fact indicates apparently that since such small droplets are carried away even under the conditions of mild winds, the water distribution efficiencies will deteriorate to an extreme degree with increasing wind speeds, as reported by INOUE et a1 (I3) The fraction of droplets less than
0
5 mm seems to increase with increasing nozzle pressure. From these results it may be easily clarified that the'--
1"Patternation Index", that is, the degree of nonsymmetrical distribution of water increases with increasing ope~ating pressure, though in a previous paper(g) this phenomenon was not completely explained..
From the summation curves it is possible to read off values of the volume median diameters corresponding to 50 percent of the total volume emitted.. The volume median diameters and the deduced values are tabulated in 'Table 3.. For example, the volume median diameters were I .,lOmm for the large orifice and 0.80 mm for the small or if ice, at a pressure of 2 . 5 kg/cm2..
Fig. 2 shows the ratio of the volume median drop size to the o~ifice size plotted against the velocity of efflux. It was found that the ratio of the volume median diameter to the orifice size depended only on the jet velocity for the given fluid under the stated experimental conditions.
Val..
14.
No.2 (1963)
Fig 1 Cumulative drop-size-distribution curves under various conditions (As percent volume of all drops less than diameter indicated in abscissa )
where D is the orifice size in mm, Xmed the volume median diameter in mm and U the velocity of efflux in cm/sec
The volume median size seems to be proportional to orifice size and inversely proportional to the 4 88 power of discharge velocity under the stated conditions
PIGFORD and
P Y L E ~ ~ )
reported mass median andSAUTER
mean diameters for low pressure water sprays from hollow-and solid-cone nozzles According to their report, the mass median diameter seems to increase linearly with the orifice diameter This correlation agrees with the present data; that i s , an increase in nozzle-orifice size causes a deter iotation in spray finenessDischarge veloclty U m/see
Fig 2 Effects of orifice size and discharge velocity on volume median diameter of spry droplets
(B)
Drop size distribution of spraysIn addition to using a cumulative distribution representation, it is also informative to represent drop-size distribution by a frequency plot
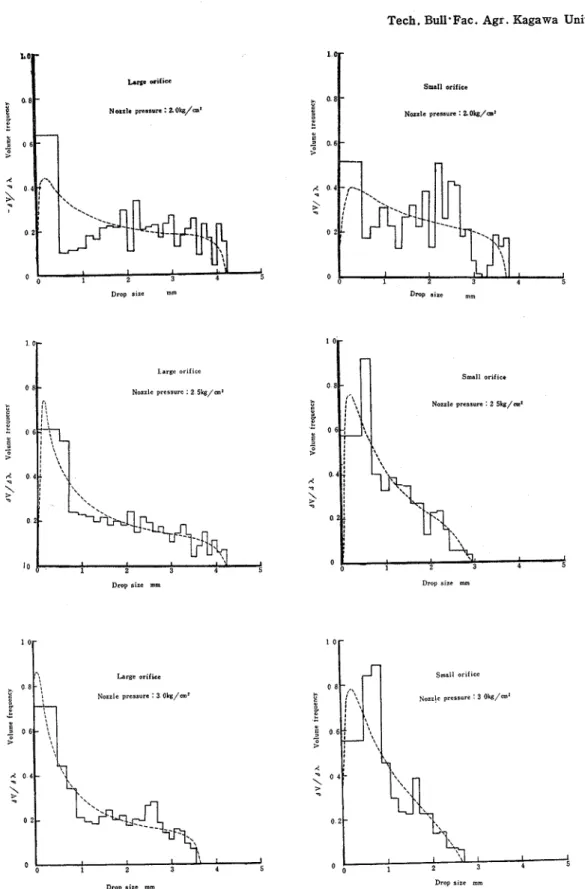
When the volume fractions divided by the size interval, that is, the volume frequencies, A V / A X , are plotted against each mean of size-classes, we obtain what i s called the "size-frequency" curve, Fig. 3
shows the size-distr~bution histograms for the three o p e ~ a t i n g pressures. The total area under the steps i s equal to 1
The present results, considered together with those given in a previous paper('), show that generally speaking, the variations in the sprays produced under different conditions consisted mainly in vat ying proportions of droplets of different size and in an extension of the size range to include larger or smaller droplets The results also indicate fairly definite upper limit to the size of droplets in a spray. I t appears that while the volume of small droplets increases with increasing pressure, the form of the size-distribution curve remains almost unchanged except for a gradual shrinking towards the smaller sizes. There seems to be one maximum frequency a t a small drop size. However, sets of measurements do not include sufficiently small diameters to make the maximum apparent.
Tech. Bull'Fac. Agr. Kagawa Univ. D . O ~ sire m m l o r a n -
t
5
0 6 - # Large orifice Nozzle prtssurc : 2 5k/cn' L",I an(-Notzle pressure : tOb/-'
--
D m p sire m m
Small orifice
Nozzle P I I U Y ~ ~ : 20b/m2
Dmp size m m
Drop sire mm Drop r l z c m m
Fig. 3. Frequency distributions plotted by increments and "Upper Limit" frequency curves on volume basis, of spray droplets emitted by sprinkler nozzles under various conditions
Vol.
14.
No.2 (1963)
2.0 kg/cm2 the volume frequency increases, passes through one maximum and then reduces with drop size to a minimum at an intermediate drop size, beyond which it increases gradually again to pass through the other maximum frequency a t a larger drop size and finally falls off; that is, there i s some slight evidence for a secondary maximum. This apparently indicates that for low velocities frequency curves with more than one maximum are obtained, as reported by GIFFEN and MASSEY( = ) , who studied the drop size distributions from pressure atomizers of the swirl-plate and helical-grooved core types.
It is probable, accordingly, that a type of drop size distribution occurring a t a low speed of jet, such as at a pressure of 2.0 kgjcmz, is a combination of two distributions denoted by A and B i n Fig. 4. We shall come back to this in more detail later.
In case of higher speeds of ejection, however, the features of the size distribution curve are appreciably different from those in case of lower speeds of ejection There are no maximum frequencies appearing in a larger drop size and the distribution curves reduce simply with increasing drop size.
According to many i n ~ e s t i g a t o r s ( ~ 8.10), the mechanisms of breakup of jets issuing from nozzles with
the principal velocity component in the longitudinal direction could be classified as follows:
(1)
Dripping from an orifice without jet formation.(2) The Rayleigh mechanism of jet breakup, wherein an axially symmetric disturbance produces breakup. The term "varicose" has been applied to these disturbances.
(3)
Breakup into drops due to lateral oscillation with the additional effect of air friction. The jet has a twisted or sinuous appearance(4)
So-called atomization of the jet.It should be kept in mind that these are the conclusions drawn from examining photographs near to the point of breakup.
On the other hand, according to OHNESORGE(~) the breakup mechanism of a jet appears to be a function of the REYNOLDS number U D PL/& and the Z-number PI,
/do
PLD, in which PL =liquid density, pL=liquid viscosity, n=surface tension, D=orifice size, and U=discharge velocity.OHNESORGE found that the boundaries of the ranges in which the various classes of disintegration occured could be represented by oblique straight lines on a graph of log Z
vs
log Re. The equations for these boundary lines can be written as-
iZ = bR,
(3)
where the constants b and i are determined by experiments, Z the Z-number, and Re the REYNOLDS number.
MIESSE(~) modified the coefficients of the equations for the boundary lines obtained by OHNESORGE. He determined the equation of the boundary line for the change of regime from sinuous to atomization as follows:
-0 92
Z = 100 Re
(4)
By assuming two values for Z of 1 . 7 4 ~ 1 0 - ~ and 2 . 1 4 ~ 1 0 - ~ in the nozzles used and for water, Eq.
(4)
indicates that the critical values of Re are approximately 1.53
x
l o 6 and 1.19x
l o 5 , respectively. These REYNOLDS numbers correspond to speeds of ejection of about 32 and 37 m/sec in large and small orifices, respectively. From the above evaluations, it is easily apparent that the mechanisms of jet breakup occuring in the present experiments could be contained in the intermediate or transition regime from "sinuous" breakup to atomization.In the "sinuous" breakup, waggling of the jet results in "filaments or ligaments". The mist or droplets of small size which are produced from the jet in this stage results mostly from subsequent breakup of the "filaments or ligaments" by their rapid motion th~ough the air. Accordingly, i t is naturally inferred that
168
Tech. Bull ,. Fac. Agr.
Kagawa Univ. the drop size spectrum a t a pressure of 2,,0kg/cma, where the ffsinuousu breakup of the jet plays an appreciable part, may be a combination of two spectra denoted as A and B in Fig. 4.As the speed of efflux increases, a large number of these ligaments and films produced by the primary disintegration of the jet are divided into smaller units
08t
by increasing air resistance. As a result, the featureb
of the drop size distribution curve denoted as B inFig. 4, where the drops seem to be resulted from the p~imary disintegration of the jet by turbulence, will get out of sight step by step a s the speed of ejection of the jet increases. Finally, a t the "atomization" stage, breakup seems to be entirely conditioned by air friction, so that the drop size spectrum may represent an appearance of the smooth falling-off curve in the size range of larger drops.
& l a 8 8 3
5
It follows clearly from Fig. 3 that with increasing
DTOD st- mrn pressur e from 2.0 to 3.0kg/cm2 the drop size spectrum
~ i g 4 showing a combination of two frequency shows much smoother curve without depression a t distribution curves ; A and B
an intermediate drop size. Some considerations as mentioned above will give us a clear understanding of the facts resulted from Fig. 3. Accordingly, it may be probably concluded that a most general type of drop-distribution occuring in sprinkling is a combination of what may be termed the hyperbolic and the skew-probability distributions denoted by A and B in Fig.
4.
It appears that a possible type of distribution generated by air friction processes is of the hyperbolic type.Though there are many types of equations to fit the drop-size distribution, the upper limit equation, proposed by MUGELE and EVANS(^^), appears to have distinct advantage over the other equations, as previously stated( ). Accordingly, the upper limit equation will be applied also to the present results regarding the sprays emitted by the sprinkler a t operating pressures of 2.0 and 3.0 kg/cma.
If the size-frequency data fit the upper limit equation (Eq
(4).
in Ref. 1 ) and are plotted on logarithmic- probability grid, then the resulting summation curve is a straight line. The results obtained in the present experiments are plotted on logarithmic-probability grid in Fig. 5.When we take together the results obtained at an operating pressure 2.5 kg/cm2 under consideration, the data are believed to plot into straight lines within experimental error, except in case of low speeds of jet, such as at 2.0 kg/ cm2. However, it will be not impossible that the upper limit equation may also be approximately applied to the data obtained a t 2.0 kg/cm2. The values of the constants a , 6 and Am
(See Ref. 1 ) are given in Table 3.
The size-distribution curves of sprays correlated by the upper. limit equation were superimposed in Fig.
3,
in dotted lines, to make comparisons with the experimental data. Except at a pressure of 2.0 kg/cma, the upper. limit equation gives a good fit and is useful in defining the characteristics of sprays emitted by the sprinkler, as would be expected. The size distribution curve follows a curve of the skew cocked-hat shape showing one maximum at a particular size. As above mentioned, however, in case of low speeds of ejection the general trend of size distribution curve is somewhat different, having two maximum frequencies, one at a drop size similar to that at higher speeds of jet and the other a t a larger size. Unfortunately, the upper limit equation fails to give this unusual feature of the size distribution. Only an approximate correlation is given in these cases.Vol.
14.
No.2
(1963)169
(C) Mean drop size and degree of nonuniformity of sprays The volume median diameter of sprays emitted has been estimated from the sum- mation curve in Section ( A ) . However.
there are the various types of mean diameters which may be required for different applications.
M U G E L E and EVANS(") developed the general expression f or computing any mean diameter. Of many mean diameters, here, three mean diameters commonly used were computed directly fxom experimental data by using the following relationships.
=
X
f
( h i ) dhi/EX;' f
( h i ) Ahii i
- 1
hrs =
f
( h i ) dhi/
C h if
( h i ) AXi i51hw= C h i f ( h i ) A X i
L
f
( h i ) Ahii
/I
where Ahi is the size-class increment, subscript i refers to the number of the size class, and f (hi') A hi corresponds to the volume of droplets counted in the i. th size class. In general, h, is termed the volume mean diameter, h,, the volume -surface (SAU I E R ) mean diameter, and h , the DE BROUCKERE mean diameter.
We may calculate the mean diameters analytically from the expression for the
size distribution curve, i.e., the upper h / ( X m - h )
limit equation (See Ref. I ) . Fig. 5. Upper -Limit analysis of data. Table 3..
6
---
I " '
rnm
I
mmI
mrnI
mm"Tech. Bull. Fac. Agr. Kagawa Univ. The SAUTER mean diameter is most readily derived. The result is
where
xm
is the maximum diameter of sprays, and f (A) the volume distribution function (Eq.(4) in Ref.1).The computed results are tabulated in Table 3. The last two columns of the table indicate that the values of hVs computed directly from the data differ slightly from those computed analytically from the upper limit equation which gives the proper trend for the drop size distribution curve. Of course, the SAUTER mean diameter is largely dependent on the number of small droplets in a spray. Consequently, this difference may be ascribed to the fact that the droplets smaller than 230 /* could not be measured. Although the volume of such small droplets was given by substracting the volume of droplets larger than 230,~ from the total volume emitted, measurements were not carried out to make the distribution curve apparent in the range of drop-size less than 2 3 0 ~ . For the same reasons it should be noted that values of
h, were not reliable in our tests.
The mean diameters obtained may be applicable to the studies regarding losses due to evaporation and wind drift, energy required for atomization and etc. Further studies regarding these matters will be found in other papers in p ~ e p a r a t i o n ( ~ ~ . l ~ ) .
I t is also important to know whether the drops are more or less of the same size, or have widely different sizes.
The most widely used method of obtaining the measure of uniformity is "KRAMER'S modulus", which
is the ratio of the area below to the area above the 50 percent line. KRAMER'S modulus,
Mk,
is 1 fox a uniform drop size.STRAZHEWSKI developed originally an expression for measuring uniformity which depends on the ratio of the total number of drops counted to the number of drops if all were of uniform size and equal to the SAUTER mean diameter ; that is.
where
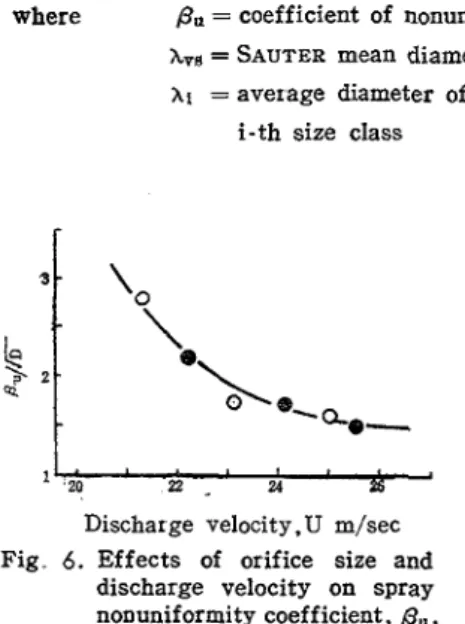
6,
= coefficient of nonuniformity Ahi = size class incrementhVB = SAUTER mean diameter $? (xi)Axi = the number of drops or number
x i = average diameter of drops in fraction in size class
i - t h size class
Fig. 6. Effects of orifice size and degree of nonuniformity. The nonuniformity seems also to be discharge velocity on spray
nonunif ormity coefficient,
*,
.
dependent upon orifice size; larger or if ice size means higherIt is evident that the "spray nonuniformity coefficient"
, Pa,
degree of nonuniformity for the same discharge velocity. From
" -
C
,.
d
1
is equal to unity for a perfectly uniform spray and greater
'
0 than unity for a nonuniform spray. The values of ME and
p,
\
are tabulated in Table 3..'%@
The degree of nonuniformity of droplet size varied with discharge velocity (or injection pressure), and approached to
'Q-e-
unity with increasing discharge velocity. It follows, therefore, 2'? ,. 24 p6 that a t low discharge velocity the sprays was composed of Discharge ve1ocity.U m/sec large numbers. of droplets of different sizes and had a high
Vol..
14.
No.1
(1963)
171
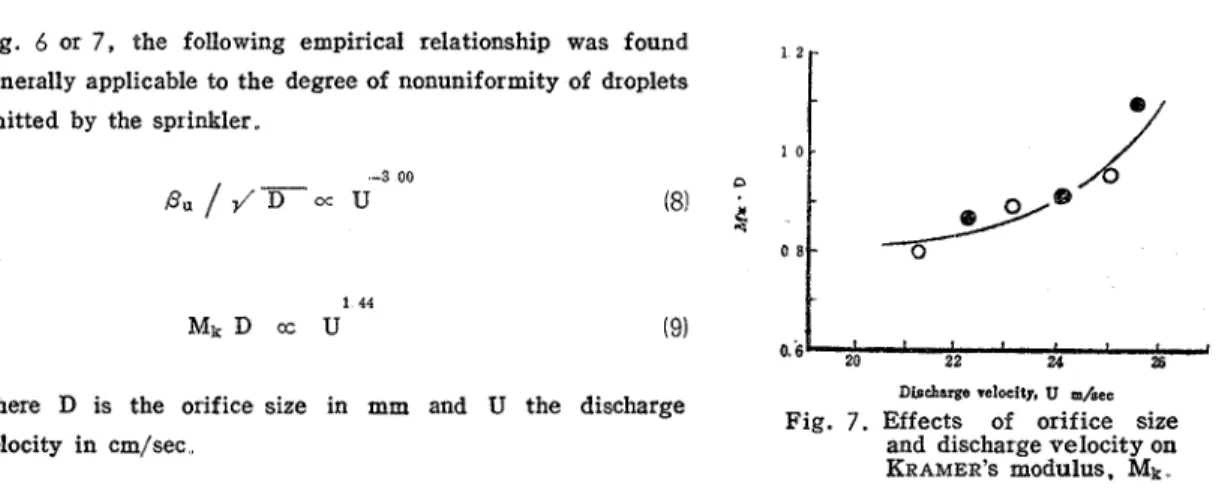
Fig. 6 or 7, the following empirical relationship was found
2r
Discharge ~ 8 l ~ I t ) i U =/see
where D is the orifice size in mm and U the discharge
Fig. 7. Effects of orifice size
velocity in cm/sec
..
and discharge velocity onKRAMER'S modulus. M k
..
generally applicable to the degree of nonunifo~mity of droplets
emitted by the sprinkler.
1 0 . - 3 00 4 " / / - T =
u
(8) D4:
or 0 s - Acknowledgments - 7 rI wish to express my thanks to professor Jiro SUGI of Tokyo University for his invaluable advice and
encouragement. Thanks are also due to Messrs. Y. IWASAKI, S.S JAYASHINGHE, M. UZUMAKI (Tokyo
University) and S. MORIYAMA (Kagawa University) for generous assistance in carrying out the
experiments. The help of Miss. N. KITAHAMA in making the calculations, charts, and figures is gratefully
acknowledged.
(Received October 31, 1962) References
(1)
INOUE, H., JAYASINGHE, S.S.: Tech. Bull.Fac. Agr. Kagawa Uuiv., 13, 202 (1962).
(2) GIFFEN, E . , MASSEY, B. S. : The Motor
Industry Re.s. Assoc., Reporf 1951-4.
(3)
DUFFIE,J.
A., MARSHALL, W. R.: Chem.Eng. P r o g . , 49, 417 and 480 (1953).
(4)
OHNESORGE. W. : Z.angew. Math. u. Mech.,16, 355 (1936).
(5) WEBER, C.: 2. angew. Math. u. Mech.,
11, 136 (1931).
(6)
HOLROYD, H.B.:1.
Franklin Inst.. 215, 93(1933).
(7) MIESSE, C. C. : Ind. Eng. Chem.,
47,
1690(1955).
(8) PIGFORD, R. L., PYLE, C.: Ind. Eng. Chem.,
43. 1649 (1951).
(9) SUGI, J., INOUE, H.: Tochikairyo, 11, 98
(1961).
(10) TANASAWA, Y., TOYODA, S.: Trans. ,J. S.
M. E ,Ser. 2, 20, 299 and 306 (1954).
(id MUGELE, R. A., EVANS, H. D.: Ind. Eng.
Chem., 43, 1317(1951).
(12) INOUE, H. : Tech. Bull. Fac. A g r . Kagawa
Uniu., 14 (1962).
03)
INOUE, H., e t al. : Research Notes, Dept..
Agri'c. Eng. Univ. Tok,yo, (2) (1960).
(14) INOUE, H. : Papers for the Fifth Congress of
the I.C.Z. D., Tokyo-1963 (in preparation).