Assessment of Macular Function by Multifocal
Electro-retinography and Optical Coherence Tomography before and
after Panretinal Photocoagulation in Diabetic Retinopathy
Takashi Baba, Yuji Sasaki, Shiro Hatta, Jiro Hasegawa, Atsushi Yamasaki, Ryoko
Ishi-kura, Akiko Kakimaru, Kazuki Matsuura* and Akihiko Tamai†
Division of Ophthalmology and Visual Science, Department of Medicine of Sensory and Motor Or-gans, School of Medicine, Tottori University Faculty of Medicine and *Department of Biomedical Science, Institute of Regenerative Medicine and Biofunction, Tottori University Graduate School of Medical Sciences, Yonago 683-8504 and †Clinic of Ophthalmology, Hino Hospital Association Hino Hospital, Hino 689-4504 Japan
We evaluated macular function before and after panretinal photocoagulation (PRP) in diabetic retinopathy using a multifocal electroretinogram (mfERG) and optical coherence tomogram (OCT). In mfERGs, the 1st positive wave (P1) minus the 1st negative wave (N1) amplitude (P1 – N1 amplitude), the P1 peak latency and the response density were measured in 7, 19, 37 and 103 hexagonal areas or elements (Areas 1, 2, 3 and 4) within a central radius of 5, 7, 10 and 20 degrees, respectively. The mean retinal thickness was estimated from 9 calculation points at the foveal region within 5 degrees; the central and each of the other 4 points at a distance of 250 µm and 500 µm from the central portion on horizontal and vertical sections on OCT. The P1 peak latencies from the 4 areas were remarkably prolonged in 14 eyes of 9 patients with preproliferative or early proliferative diabetic retinopathy showing no clinically significant macular edema before PRP as com-pared with those in 15 normal control eyes, without a tendency of recovery throughout the course after PRP except for area 1. The P1-N1 amplitudes and the mean response density levels from the 4 areas were remarkably decreased in the diabetic eyes before PRP as com-pared with those in the control eyes, followed by a maximum decrease in both parameters at 3 months after PRP. However, remarkable recoveries were detected in both decreased parameters from the 4 areas at 6 months after PRP. The mean foveal retinal thickness on OCT was remarkably increased in the diabetic eyes before PRP as compared with the thickness in 16 normal control eyes. Most remarkably, a transient increase in thickness was detected in diabetic eyes 1 month after PRP, followed by a tendency of recovery 3 to 6 months after PRP. These results indicate that mfERG and OCT examinations are useful in the assessment of macular function before and after PRP in diabetic retinopathy, espe-cially within 5 degrees of the central portion, and that the effects of PRP on macular func-tion in this entity seem to be reversible at the foveal region, although we need to do further investigation in relation to the outcome of visual acuity.
Key words: diabetic retinopathy; macular function; multifocal electroretinogram; optical coherence tomogram; panretinal photocoagulation
Panretinal photocoagulation (PRP) is a beneficial procedure for the treatment of preproliferative or early proliferative diabetic retinopathy (Diabetic Retinopathy Study Research Group, 1981; Early Treatment Diabetic Retinopathy Study Research Group, 1991), even though vitrectomy has been performed in many patients with severe and com-plicated diabetic lesions (Lewis et al., 1992; Massin et al., 2003). On that occasion, the assessment of macular function is very important for predicting the patientsʼ quality of vision after PRP. Several re-ports showed various changes in retinal sensitivity after PRP in this entity, using mostly the Goldmann kinetic perimeter (Frank, 1975), the computed static perimeter (Chee and Flanagan, 1993; Yoon et al., 1996) and the electroretinogram (ERG) (Frank, 1975; Bresnick and Palta, 1987).
Using an optical coherence tomogram (OCT), Hee and his co-workers (1995, 1998) and Kang and others (2004) quantified foveal retinal thickness correlated with visual acuity in patients with clini-cally significant diabetic macular edema. Recently, Palmowski and others (1997) and Fortune and oth-ers (1999) revealed local retinal dysfunction in the macular area in diabetic patients, with and without retinopathy, using a multifocal electroretinogram (mfERG) (Sutter and Tran, 1992). In general, morphological changes in the retina are assessed by OCT examination because optical coherence tomography offers high-resolution, cross-sectional images of the retina and quantitative measurement of retinal thickness (Hee et al., 1995, 1998; Kang et al., 2004), while topical functional changes in the retinal layer are assessed with mfERG examina-tion, using a multifocal technique (Sutter and Tran, 1992; Palmowski et al., 1997; Fortune et al., 1999). These tests allow a relatively fast, objective evaluation of retinal function in their images and patterns in contrast to subjective perimetric examina-tions such as the Goldmann kinetic perimeter (Frank, 1975) and the computed static perimeter (Chee and Flanagan, 1993; Yoon et al., 1996). However, little attention has been paid to the assessment of
macular function by mfERG and OCT examina-tions before and after PRP in diabetic patients with retinopathy. We therefore evaluated macular func-tion before and after PRP in diabetic retinopathy by multifocal electroretinography and optical coher-ence tomography in this survey.
Subjects and Methods
Nine patients (14 eyes) with preproliferative or early proliferative diabetic retinopathy showing no clinically significant macular edema were referred to us for this study. Their ages ranged from 51 to 77 years averaging 61.2 ± 8.6 years (SD). The mean corrected visual acuity of the 14 diabetic eyes before PRP was 0.87 ± 0.37 (SD), followed by 0.80 ± 0.37, 0.76 ± 0.33 and 0.84 ± 0.38 at 1, 3 and 6 months after PRP, respectively. They were exam-ined using a VERIS Science System for the mfERG (Mayo Corp., Nagoya, Japan) and a Humphrey OCT scanner (Carl Zeiss Co., Ltd., Tokyo, Japan) before PRP and at 1, 3 and 6 months after the pro-cedure, as described later.
Fourteen healthy volunteers (15 normal eyes) aged 51.1 ± 13.1 years (SD) on the average served as controls for the VERIS study, and 12 healthy volunteers (16 normal eyes) aged 66.1 ± 12.5 years (SD) on an average served as controls for the OCT study in the present estimation. These healthy vol-unteers were randomly divided into either study group.
The diabetic patients were randomly chosen for the present survey over the past 4 years (August 1996 to September 2000) at the Department of Ophthalmology, Tottori University Hospital. The tenets of the Declaration of Helsinki were followed. Upon giving informed consent, all subjects includ-ing volunteers participated in the present study. Er-ror of refraction did not exceed ± 3 diopters in the diabetics or normal controls. Eyes with clouding of the media or subjected to previous surgery were excluded from the analysis.
mfERG areas
Area 1: Area 2: Area 3: Area 4: 5 degrees 7 elements 7 degrees 19 elements 10 degrees 37 elements 20 degrees 103 elements PRP procedureTreatment with PRP on the diabetic patients was performed according to the Early Treatment Dia-betic Retinopathy Study (ETDRS) protocol (Dia-betic Retinopathy Study Research Group, 1981; Early Treatment Diabetic Retinopathy Study Re-search Group, 1991). All patients underwent PRP in 2 sittings 1 week apart, lower hemifield followed by upper hemifield. Photocoagulation covered the entire mid periphery beyond the equator, and poste-riorly to the area bordered by the temporal vascular arcades, nasal disc border and 2-disc diameter tem-poral to the fovea. All eyes were treated with either a green argon laser (Coherent Inc., Palo Alto, CA) or a dye laser (Biophysic Medical Ins., Clermont-Ferrand, Cedex, France). Approximately 1,000 to 2,000 burns of a 200 to 500 µm spot size were made 1 to 2 burn spaces apart through a 3-mirror universal lens (Ocular Instruments Inc., Bellevne, WA) or a double aspheric lens Trans Equator or Quadr Aspheric (Volk Optical Inc., Mentor, OH). mfERG examination
The VERIS Science System, which is a visual evok-ed response imaging system originally developevok-ed by Sutter and Tran (1992), was used for the mfERG
recording. The mfERG stimulus matrix consisted of 103 concentrically scaled hexagons, which cov-ered the fundus area within a central radius of 20 degrees (Fig. 1). Alternated color changes were set in each hexagon between black and white in binary m-sequences at a rate of 75 Hz. Luminance lev-els ranged from 5 to 200 cd/m2. A Burian-Allen
bipolar contact lens electrode was used for signal derivation. A grounding electrode was attached to either earlobe, a routine procedure. The pupil of one eye was fully dilated with 2.5% phenylephrine hydrochloride, and the other eye was occluded. The net recording time for each eye was 4 min. The entire procedure was divided into eight 30-s segments. The signals were amplified using the VERIS Science System with bandpass filters (10– 300 Hz).
As demonstrated in Fig. 2, in the response arrays of the mfERG consisting of the mean fo-cal flash response (Fig. 2a), the 1st positive wave of each mean focal flash response (P1) minus the 1st negative wave of each response (N1) amplitude (P1 – N1 amplitude) in µV and the P1 peak latency in ms were measured as mfERG parameters in 7, 19, 37 and 103 hexagonal areas or elements (Areas 1, 2, 3 and 4; 4 mfERG areas) within a central ra-dius of 5, 7, 10 and 20 degrees, respectively (Fig. 1). Three-dimensional topography revealed the
re-Fig. 1. The multifocal
electroretino-gram (mfERG) stimulus matrix con-sisting of 103 concentrically scaled hexagons. The matrix was divided into 7, 19, 37 and 103 hexagonal areas or elements (Areas 1, 2, 3 and 4; 4 mfERG areas) within a central radius of 5, 7, 10 and 20 degrees, respec-tively.
sponse density in each hexagonal area in amplitude per retinal area (nV per degree squared: nV/deg2) in
the topograph (Fig. 2b). The response density was also adopted as one of the mfERG parameters (Fig. 2) and measured in the 4 mfERG areas in this sur-vey. The recording procedure was repeated at the time when spurious potentials from eye blinks on ocular movement were involved.
OCT examination
Optical coherence tomography was used for mea-surement of retinal thickness in µm. The optical coherence tomography system was interfaced using fi ber optics to a conventional slit-lamp biomicro-scope and a fi xed +78-diopter condensing lens for retinal examination. An infrared-sensitive video
beam on the fundus so that the location of each scan on the retina could be monitored. A comput-er-controlled light placed in the visual fi eld fi xated the eye being scanned. Fine positioning for the OCT examination on the retina was accomplished by keyboard control for scan length, angular orien-tation and position relative to the patientʼs fi xation point.
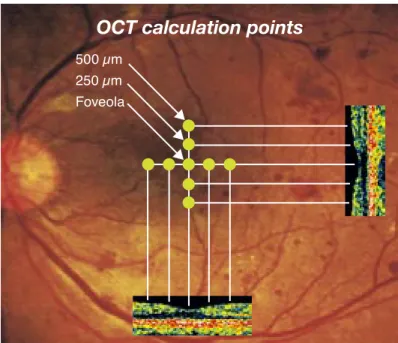
The mean retinal thickness was estimated from 9 calculation points at the foveal region within 5 degrees in the thickness estimation in the aver-aged OCT scans by our computer program, that is, the central and each of the other 4 points at a distance of 250 µm and 500 µm from the central portion on horizontal and vertical sections in linear pattern on OCT (Fig. 3). Retinal thickness was mea sured at the distance between the strongest 2 Fig. 2. Multifocal electro reti nogram (mfERG) parameters calculated in this survey. The P1 and N1 indicate the 1st posi tive and negative wave of each mean focal fl ash response in the response arrays of the mfERG (a), respectively. The 3-dimensional topograph (b) represents the response density in each hexagonal area (amplitude per retinal area: nV/deg2). The mfERG parameters, that is, the P1 – N1 amplitude, the P1 peak latency and the response density are demonstrated as 1, 2 and 3 in this fi gure, respectively.
1: P1 – N1 amplitude (nV) 2: P1 peak latency (ms) 3: Response density (nV/deg2)
3
N1
P1
1
2
a
b
mfERG parameters
Fig. 3. Calculation points on optical coherence tomogram (OCT). The mean retinal thickness was estimated from 9 calculation points at the foveal region within 5 degrees; the central and each of the other 4 points at a distance of 250 µm and 500 µm from the central portion on the horizontal and vertical sections on OCT. Horizontal and vertical cross-sectional tomographic images are inserted in this figure.
sponded to the vitreoretinal interface and the reti-nal pigment epithelium, respectively.
We not only used the retinal thickness pro-gram, but also hard copies of each OCT image for checking errors, because the layer of cystoid macu-lar edema was sometimes detected as the edge of the retinal pigment epithelium and the detached vitreoretinal membrane was also detected as the edge of the vitreoretinal interface. In OCT mea-surement, the subjectʼs pupil was fully dilated with 2.5% phenylephrine hydrochloride.
Statistical analysis
All values obtained in the mfERG and OCT exami-nations were expressed as mean ± SEM. Statistical analysis was performed with Mann-Whitneyʼs U test. A P value of < 0.05 was considered statisti-cally significant.
Results
The P1 peak latencies obtained from the 4 mfERG areas were significantly prolonged in the 14 eyes of the 9 patients with preproliferative or early prolifer-ative diabetic retinopathy who showed no clinically significant macular edema before PRP as compared with those in 15 normal control eyes of 14 healthy volunteers at level of 1%, with no tendency for re-covery throughout the course after PRP except for area 1 (within a central radius of 5 degrees) (Fig. 4). The P1 – N1 amplitudes obtained from the 4 mfERG areas were significantly decreased in the 14 diabetic eyes before PRP as compared with those in the 15 control eyes at the 1% or 5% level, followed by a maximum decrease in the parameter 3 months after PRP. However, significant recoveries were detected in the decreased P1 – N1 amplitudes from the 4 areas at 6 months after PRP at the 1% or 5% level (Fig. 5).
The mean response density levels obtained from the 4 mfERG areas also showed almost the
OCT calculation points
500 µm 250 µm Foveola
(�m) Control Before PRP 1 mo After PRP3 mo 6 mo Fo ve al re tin al th ic kn es s * 230 220 210 200 190 180 170 160 150
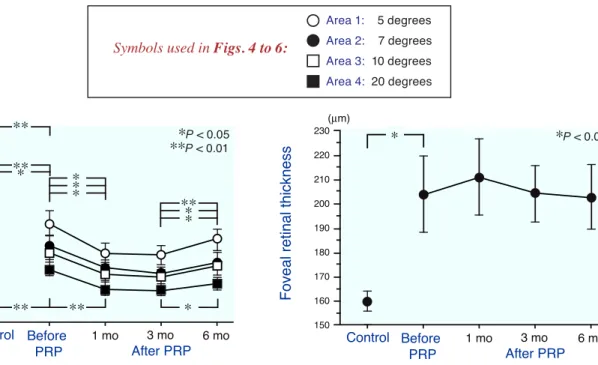
Fig. 7. Changes in the mean foveal retinal thickness within 5 degrees on OCT in 14 diabetic eyes before and after PRP. All values were expressed as mean ± SEM. Each bar indicates SEM. * indicates P < 0.05 by Mann-Whitneyʼs U test. PRP, panretinal photocoagulation; mo, month(s). Control: 16 normal control eyes of 12
27 32 30 28 29 31 (ms) Control Before PRP 1 mo After PRP3 mo 6 mo P1 pe ak la te nc y ** ** ** **
Fig. 4. Changes in the P1 peak latencies of the mfERG obtained from 4 mfERG areas in 14 diabetic eyes before and after PRP. The diabetic eyes were derived from 9 patients with preproliferative or early proliferative diabetic retinopathy showing no clinically significant macular edema in this series. All values were expressed as mean ± SEM. Each bar indicates SEM. ** indicates P < 0.01 by Mann-Whitneyʼs U test. PRP, panretinal photocoagulation; mo, month(s). Control: 15 normal control eyes of 14 healthy volunteers.
0 40 30 10 20 (nV) Control Before PRP 1 mo After PRP3 mo 6 mo P1 – N 1 am pl itu de ** ** ** ** ** ** ** ** * ** *
Fig. 5. Changes in the P1 – N1 amplitudes of the mfERG obtained from 4 mfERG areas in 14 diabetic eyes before and after PRP. All values were expressed as mean ± SEM. Each bar indicates SEM. * indicates P < 0.05, and ** indicates P < 0.01 by Mann-Whitneyʼs U test. PRP, panretinal photocoagulation; mo, month(s). Control: 15 normal control eyes of 14 healthy volun-teers. 0 9 8 7 6 1 5 4 3 2 (nV/deg2) Control Before PRP 1 mo After PRP3 mo 6 mo R es po ns e de ns ity ** ** ** * ** *** ** ** *
Fig. 6. Changes in the mean response density levels of the mfERG obtained from 4 mfERG areas in 14 diabetic eyes before and after PRP. All values were expressed as mean ± SEM. Each bar indicates SEM. * indicates P < 0.05, and ** indicates P < 0.01 by Mann-Whitneyʼs U test. PRP, panretinal photocoagulation; mo, month(s).
Symbols used in Figs. 4 to 6:
Area 1: 5 degrees Area 2: 7 degrees Area 3: 10 degrees Area 4: 20 degrees **P < 0.01 ***PP < 0.05 < 0.01 *P < 0.05 *P < 0.05 **P < 0.01
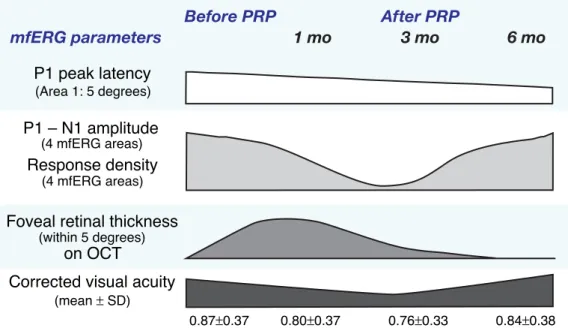
Fig. 8. Summarized data obtained in the present study before and after PRP in 14 diabetic eyes. In the mfERG para-meters, the P1 peak latency from the area 1 (within a central radius of 5 degrees), the P1 – N1 amplitudes and the mean response density levels from the 4 mfERG areas are presented at 1, 3 and 6 months after PRP following each data before PRP in addition to the mean foveal retinal thickness within 5 degrees on OCT. The mean corrected vi-sual acuity in the 14 diabetic eyes is also presented throughout the course. PRP, panretinal photocoagulation; mo, months(s).
same tendency as in the P1 – N1 amplitudes, as shown in Fig. 6. That is, the mean response density levels from the 4 areas were remarkably decreased in the 14 diabetic eyes before PRP as compared with those in the 15 control eyes at the 1% or 5% level, followed by a maximum decrease in the pa-rameter at 3 months after PRP. However, remark-able recoveries were detected in the mean response density levels from the 4 areas at 6 months after PRP at the 1% or 5% level.
The mean foveal retinal thickness within 5 degrees on OCT was significantly increased in the 14 diabetic eyes before PRP as compared with the thickness in the 16 control eyes of the 12 healthy volunteers at the 5% level. Most remarkably, a transient increase in the thickness was detected in the diabetic eyes at 1 month after PRP, followed by a tendency for recovery at 3 to 6 months after PRP (Fig. 7).
Discussion
As summarized in Fig. 8, in the mfERG param-eters, the P1 peak latency from the area 1 (within a central radius of 5 degrees) was markedly pro-longed in the 14 diabetic eyes before PRP as com-pared with that in the 15 control eyes, but a tenden-cy for recovery was detected throughout the course after the procedure (Fig. 4).
The P1 – N1 amplitudes and the mean re-sponse density levels from the 4 mfERG areas were remarkably decreased in the diabetic eyes before PRP as compared with those in the control eyes, followed by a maximum decrease in both param-eters at 3 months after PRP. However, remarkable recoveries were detected in both decreased param-eters from the 4 areas at 6 months after PRP (Figs. 5, 6 and 8).
The mean foveal retinal thickness within 5 degrees on OCT was remarkably increased in the diabetic eyes before PRP as compared with the Foveal retinal thickness
(within 5 degrees) on OCT P1 – N1 amplitude (4 mfERG areas) Response density P1 peak latency (Area 1: 5 degrees)
Corrected visual acuity
(mean � SD) (4 mfERG areas)
0.87�0.37 0.80�0.37 0.76�0.33 0.84�0.38
Before PRP After PRP
thickness in the 16 control eyes. Most remarkably, a transient increase in the thickness was detected in the diabetic eyes at 1 month after PRP, followed by a tendency of recovery at 3 to 6 months after the procedure (Figs. 7 and 8).
This time, statistical analysis was not under-taken on the correlation between the corrected vi-sual acuity and each data from the mfERG or OCT examinations before and after PRP in each diabetic eye due to the relatively small number of samples. However, as demonstrated in Fig. 8, it is of note that the mean corrected visual acuity before PRP in the 14 diabetic eyes showed a gradual decrease at 1 month, followed by a maximum decrease at 3 months and a tendency of gradual recovery at 6 months after the procedure in each mean corrected visual acuity in those eyes, as in the changes in the P1 – N1 amplitudes and the mean response density levels of the mfERG obtained from the 4 mfERG areas in the 14 diabetic eyes before and after PRP. The OCT findings showed no coincidental changes between mean foveal retinal thickness and mean corrected visual acuity in the 14 diabetic eyes throughout the course after PRP. However, ten-dency of recovery in mean foveal retinal thickness at 3 to 6 months after PRP may reflect a reversible foveal function resulting in a gradual recovery of the mean corrected visual acuity at 6 months after the procedure in diabetic eyes (Fig. 8), although we need to do further investigation on this point in more subject patients.
The mfERG derived from the fundus area, especially within 5 degrees of the central portion (Area 1) is supposed to reflect a cone-dominated re-sponse, which originates predominantly in the outer 70% of the retina, as in the full-field flash ERG (Hood et al., 1997; Palmowski et al., 1997; Fortune et al., 1999).
Optical coherence tomography provides non-invasively a cross- sectional tomographic image of the retina as described above and is more sensitive to small changes in retinal thickness than slit-lamp biomicroscopy (Hee et al., 1995, 1998; Kang et al., 2004).
Thus, the results obtained in the present
sur-tions are useful for assessment of macular function before and after PRP in diabetic retinopathy, espe-cially within 5 degrees of central portion, and that the effects of PRP on the macular function in this entity seem to be reversible at the foveal region, al-though we need a further investigation in relation to the outcome of visual acuity.
Acknowledgments: We express our sincere thanks to Professor Yoshitsugu Inoue, Division of Ophthalmology and Visual Science, Department of Medicine of Sensory and Motor Organs, School of Medicine, Tottori Univer-sity Faculty of Medicine, for his generous help.
References
1 Bresnick GH, Palta M. Oscillatory potential ampli-tudes. Relation to severity of diabetic retinopathy. Arch Ophthalmol 1987;105:929–933.
2 Chee CKL, Flanagan DW. Visual field loss with capillary non-perfusion in preproliferative and early proliferative diabetic retinopathy. Br J Ophthalmol 1993;73:726–730.
3 Diabetic Retinopathy Study Research Group. Pho-tocoagulation of proliferative diabetic retinopathy. Clinical applications of diabetic retinopathy study (DRS) findings. DRS report number 8. Ophthal-mology 1981;88:583–600.
4 Early Treatment Diabetic Retinopathy Study Re-search Group. Early photocoagulation for diabetic retinopathy. ETDRS report number 9. Ophthalmol-ogy 1991;98:766–785.
5 Fortune B, Schneck ME, Adams AJ. Multifocal ele-ctroretinogram delays reveal local retinal dysfunc-tion in early diabetic retinopathy. Invest Ophthal-mol Vis Sci 1999;40:2638–2651.
6 Frank RN. Visual fields and electroretinography following extensive photocoagulation. Arch Oph-thalmol 1975;93:591–598.
7 Hee MR, Puliafito CA, Duker JS, Reichel E, Coker JG, Wilkins JR, et al. Topography of diabetic mac-ular edema with optical coherence tomographpy. Ophthalmology 1998;105:360–370.
8 Hee MR, Puliafito CA, Wong C, Duker JS, Reichel E, Rutledge B, et al. Quantitative assessment of macu-lar edema with optical coherence tomography. Arch Ophthalmol 1995;113:1019–1029.
full-field ERGs. Vis Neurosci 1997;14:533–544. 10 Kang SW, Park CY, Ham DI. The correlation
between fluorescein angiographic and optical co-herence tomographic features in clinically signif-icant diabetic macular edema. Am J Ophthalmol 2004;137:313–322.
11 Lewis H, Abrams GW, Blumenkranz MS, Campo RV, Vitrectomy for diabetic macular traction and edema associated with posterior hyaloidal traction. Ophthalmology 1992;99:753–759.
12 Massin P, Duguid G, Erginay A, Hauchine B, Gaud-ric A. Optical coherence tomography for evaluating diabetic macular edema before and after vitrectomy. Am J Ophthalmol 2003;135:169–177.
13 Palmowski AM, Sutter EE, Bearse MA Jr, Fung W.
Mapping of retinal function in diabetic retinopathy using the multifocal electroretinogram. Invest Oph-thalmol Vis Sci 1997;38:2586–2596.
14 Sutter EE, Tran D. The field topography of ERG components in man. I. The photopic luminance re-sponse. Vision Res 1992;32:433–446.
15 Yoon HY, Lee J, Kim YJ. Preservation of retinal sensitivity in central visual field after panretinal photocoagulation in diabetics. Korean J Ophthal-mol 1996;10:48–54.
Received August 27, 2004; accepted September 24, 2004 Corresponding author: Akihiko Tamai, MD