Systemic and ocular Determinants
of choroidal Structures on optical
coherence tomography of eyes
with Diabetes and Diabetic
Retinopathy
takamasa Kinoshita
1,2*, Hiroko imaizumi
1,2, Miho Shimizu
1, Junya Mori
1, Akira Hatanaka
1,
Shuichiro Aoki
1, Hirotomo Miyamoto
1, Masanori iwasaki
1, Fumiko Murao
2, Masanori niki
2,
Hiroki Sano
2, Shozo Sonoda
3, Taiji Sakamoto
3& Yoshinori Mitamura
2Knowledgeof the choroidal structures in eyes with diabetes and diabetic retinopathy (DR) should provide information on the pathogenesis of DR. A prospective study was performed to determine the systemic and ocular factors that affect the choroidal structures in eyes with diabetes. Two-hundred consecutive diabetic subjects consisted of 160 treatment-naïve patients with different stages of DR and 40 patients with proliferative DR with prior panretinal photocoagulation (PRP). All underwent blood and urine tests and enhanced depth imaging optical coherence tomography (EDI-OCT). The cross-sectional EDI-OCT images of the subfoveal choroid were binarized to measure the total choroidal area (TCA), luminal area, and stromal area. Multivariate regression analyses were performed to determine the systemic and ocular factors that were significantly correlated with the choroidal structures. The subfoveal choroidal thickness, TCA, luminal area, and stromal area were larger at more advanced stage of DR, and smaller in eyes with PRP than those without (P < 0.001). The TCA and stromal area were significantly and positively correlated with the degree of albuminuria (P = 0.034, P = 0.025, respectively). the choroidal lumen and stroma may increase as the stages of DR progress and decrease after PRP. Albuminuria may be associated with the choroidal stromal edema.
Recent studies have shown that the choroid plays an important role in the physiology of the eye and the patho-genesis of different retinal diseases including diabetic retinopathy (DR)1–5. Because choriocapillaris supplies the oxygen and nutrients to the outer retinal layers, impairment of choriocapillaris can cause photoreceptor dysfunc-tion and death.
The results of studies on choroidal thickness in eyes with diabetes and DR are still contradictory. Several studies reported there was a thinning of choroid as the disease progressed1,2, while others reported it thickened contrary3 or did not change4,5. One of the reasons for the discrepancies is that there are many potential confound-ers that can influence the choroidal thickness. These include age, refractive error, axial length, diurnal variations, prior ocular treatments including retinal photocoagulation, intravitreal injection of anti-vascular endothelial growth factors, intravitreal or subtenon injection of steroids, and intraocular surgeries6–13. In addition, duration of diabetes, status of glycemic control, severity of diabetic nephropathy, systemic hypertension, dyslipidemia, anemia, and medications to treat these conditions can also influence the choroidal vasculature and stroma14–21. Other limitations of previous studies include their retrospective nature and small sample size1,4,5.
There is good evidence for microvascular dropout and narrowing of the choroidal arterioles which are one of the characteristic features of the DR that can cause a thinning of choroid22,23. However, it may also be possible that increased vascular permeability, another characteristic feature of the DR, can cause a swelling of the choroidal
1Department of Ophthalmology, Sapporo City General Hospital, 1-1, North 11, West 13, Chuoku, Sapporo, 064-8604,
Japan. 2Department of Ophthalmology, Institute of Biomedical Sciences, Tokushima University Graduate School,
3-18-15 Kuramoto, Tokushima, 770-8503, Japan. 3Department of Ophthalmology, Kagoshima University Graduate School
of Medical and Dental Sciences, 8-35-1 Sakuragaoka, 890-8520, Kagoshima, Japan. *email: [email protected]
stroma and thickening of the choroid3. Thus, it would be useful to evaluate the vascular and stromal components of the choroid separately to understand the pathophysiology of DR.
A method using the binarization of enhanced depth imaging optical coherence tomographic (EDI-OCT) images or swept source OCT images can differentiate and quantify the choroidal luminal area and the stromal area with high repeatability and reproducibility in normal and diseased eyes8,9,24,25.
Thus, the purpose of this study was to prospectively evaluate the choroidal structures in patients with dia-betes with and without DR using binarization of EDI-OCT images and to determine the systemic and ocular factors that were significantly correlated with the choroidal structures in consideration of extensive potential confounders..
Results
Two hundred and forty consecutive potentially eligible Japanese subjects were invited to participate in the study until the number of cases in each group reached 40. Two subjects declined to participate in the study. Of 238 subjects who agreed to participate in the study, 38 patients were excluded because of the exclusion criteria; 15 subjects with high myopia, 10 with poor OCT image quality, 5 with macular photocoagulation, 4 with prior vit-rectomy, 2 with pregnancy, and 2 with severe anemia. In the end, 200 eyes of 200 subjects consisting of 126 men and 74 women with a mean (standard deviation) age of 58.6 (12.85) years were studied.
Baseline demographic data.
Baseline demographic data are summarized in Supplementary Table S1. There were significant differences in several demographic data including the age among the different stages of DR. In the group of proliferative DR (PDR) with prior panretinal photocoagulation (PRP), PRPs were performed more than 6 months before enrollment in all eyes.Correlations of choroidal parameters with age, axial length, and sex.
The subfoveal choroidal thickness (SFCT), total choroidal area (TCA), luminal area, and stromal area were significantly and negatively correlated with age and axial length (Supplementary Table S2). The ratio of luminal area to stromal area (L/S ratio) was negatively correlated with the axial length. The SFCT, TCA, luminal area, and stromal area were not significantly different between sexes without any adjustments, but they were significantly larger in men than in women after adjustments for the age and axial length (Supplementary Table S3).Differences in the choroidal structures at different stages of diabetic retinopathy.
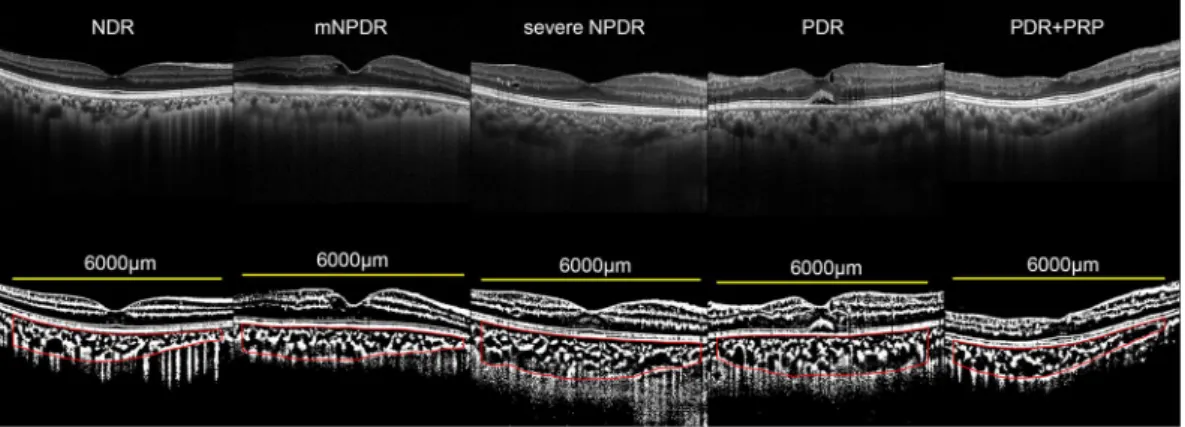
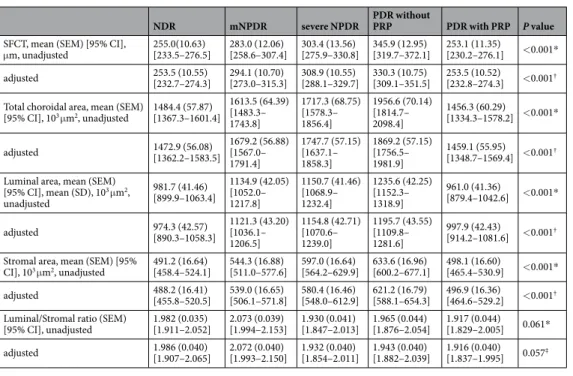
The SFCT, luminal area, and stromal area were significantly larger in eyes with severe non-proliferative DR (sNPDR) and PDR without PRP than those with no diabetic retinopathy (NDR) with and without correction for age and axial length (Fig. 1, Table 1, Supplementary Fig. 1). The SFCT, TCA, luminal area, and stromal area in the eyes with PDR with prior PRP were significantly smaller than those in the eyes with PDR without PRP with and without correction for age and axial length. There was no significant difference in the L/S ratio among the eyes at different stages of DR.correlations between choroidal parameters and continuous variables.
The SFCT, TCA, luminal area, and stromal area were significantly and positively correlated with the albumin index in the partial regression coefficient (Supplementary Table S2). The stromal area was also significantly correlated with the serum level of albumin. The L/S ratio was significantly correlated with the best-corrected visual acuity (BCVA) and central macular thickness (CMT).Figure 1. Enhanced depth imaging optical coherence tomographic (EDI-OCT) images and binarized images of EDI-OCT acquired from eyes with different stages of diabetic retinopathy. (Top row). EDI-OCT images. (Bottom row) binarized EDI-OCT images. Subfoveal choroidal thickness and total choroidal area were
significantly larger at more advanced stage of DR, and smaller in eyes with PRP than those without. The margins of the region of interest are delineated by red lines. Yellow bars indicate the length of 6000 μm. NDR, no diabetic retinopathy; mNPDR, mild to moderate nonproliferative diabetic retinopathy; sNPDR, severe NPDR; PDR, proliferative diabetic retinopathy; PRP, panretinal photocoagulation.
Differences in the choroidal structures among groups of different categorical variables.
Patients were classified as having systemic hypertension when their blood pressure was > 140/90 mmHg, or were being treated with anti-hypertensive medications. The TCA and luminal area were significantly smaller in the eyes with systemic hypertension than normotensive subjects (Supplementary Table S4). The SFCT, TCA, and stromal area in eyes with diabetic macular edema (DME) were larger than those without DME. There were no significant differences in the choroidal parameters between using or not using the different types of medications for hypertension, hyperglycemia, and dyslipidemia (Supplementary Tables S5 and S6).Evaluating factors influencing choroidal parameters in multivariate regression analyses.
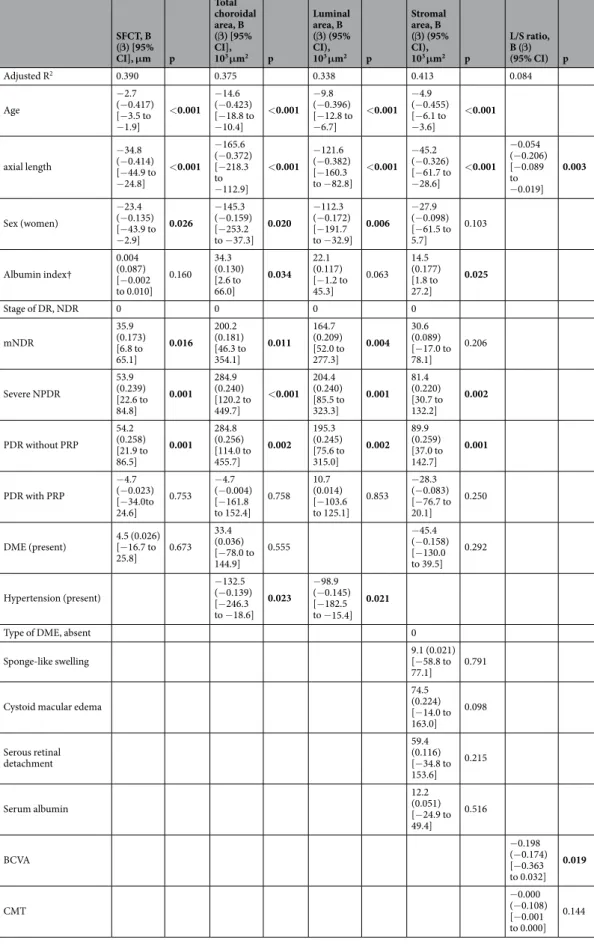
Using the variables which were significant in univariate analysis for each choroidal parameter, multivariate regression analyses were performed. In multivariate regression analyses, the SFCT was significantly associated with the age, axial length, sex, and the stage of DR. The TCA was significantly associated with the age, axial length, sex, albu-min index, the stage of DR, and hypertension. The lualbu-minal area was significantly associated with the age, axial length, sex, the stage of DR, and hypertension. The stromal area was significantly associated with the age, axial length, albumin index, and the stage of DR. The L/S ratio was significantly correlated with the axial length and BCVA. (Table 2).Discussion
The results showed that the SFCT, TCA, luminal area, and stromal area were significantly associated with the age, axial length, and sex in the eyes of diabetic patients with or without DR. These finding are in agreement with earlier reports in normal eyes6–8. Importantly, the age and axial length had the strongest correlation with the size of the choroidal structures in the multivariate regression analyses. Thus, the choroidal structures in eyes with dia-betes and DR should be evaluated under strict control of the age and axial length. Unfortunately, as best we know, only a few studies have evaluated the choroidal structures in such a manner which may be one of the reasons for the contradictory results of the choroidal thickness in DR.
Histopathological studies have shown that a dropout of the choriocapillaris was more extensive in diabetic than that in non-diabetic eyes22. Other studies showed that the blood flow of the choriocapillaris was reduced in eyes with diabetes and DR26–28, and the degree of reduction increased as the severity of DR progressed27,28. As the disease progresses, the increased dropout of choriocapillaris and subsequent hypoxia of retinal pigment epithe-lium (RPE) and photoreceptors increase the expression of vascular endothelial growth factor (VEGF) from the RPE cells29,30 which would lead to a vasodilation of middle and large choroidal vessels. In experimental animals, VEGF increased the vessel diameter31, and in human, anti-VEGF therapy decreased the choroidal luminal area in eyes with DME and polypoidal choroidal vasculopathy25,32. Pulsatile ocular blood flow which reflects the whole
NDR mNPDR severe NPDR PDR without PRP PDR with PRP P value
SFCT, mean (SEM) [95% CI],
μm, unadjusted 255.0(10.63) [233.5–276.5] 283.0 (12.06) [258.6–307.4] 303.4 (13.56) [275.9–330.8] 345.9 (12.95) [319.7–372.1] 253.1 (11.35) [230.2–276.1] <0.001* adjusted 253.5 (10.55) [232.7–274.3] 294.1 (10.70) [273.0–315.3] 308.9 (10.55) [288.1–329.7] 330.3 (10.75) [309.1–351.5] 253.5 (10.52) [232.8–274.3] <0.001†
Total choroidal area, mean (SEM)
[95% CI], 103 μm2, unadjusted 1484.4 (57.87) [1367.3–1601.4] 1613.5 (64.39) [1483.3– 1743.8] 1717.3 (68.75) [1578.3– 1856.4] 1956.6 (70.14) [1814.7– 2098.4] 1456.3 (60.29) [1334.3–1578.2] <0.001* adjusted 1472.9 (56.08) [1362.2–1583.5] 1679.2 (56.88) [1567.0– 1791.4] 1747.7 (57.15) [1637.1– 1858.3] 1869.2 (57.15) [1756.5– 1981.9] 1459.1 (55.95) [1348.7–1569.4] <0.001† Luminal area, mean (SEM)
[95% CI], mean (SD), 103 μm2, unadjusted 981.7 (41.46) [899.9–1063.4] 1134.9 (42.05) [1052.0– 1217.8] 1150.7 (41.46) [1068.9– 1232.4] 1235.6 (42.25) [1152.3– 1318.9] 961.0 (41.36) [879.4–1042.6] <0.001* adjusted 974.3 (42.57) [890.3–1058.3] 1121.3 (43.20) [1036.1– 1206.5] 1154.8 (42.71) [1070.6– 1239.0] 1195.7 (43.55) [1109.8– 1281.6] 997.9 (42.43) [914.2–1081.6] <0.001† Stromal area, mean (SEM) [95%
CI], 103 μm2, unadjusted 491.2 (16.64) [458.4–524.1] 544.3 (16.88) [511.0–577.6] 597.0 (16.64) [564.2–629.9] 633.6 (16.96) [600.2–677.1] 498.1 (16.60) [465.4–530.9] <0.001*
adjusted 488.2 (16.41) [455.8–520.5] 539.0 (16.65) [506.1–571.8] 580.4 (16.46) [548.0–612.9] 621.2 (16.79) [588.1–654.3] 496.9 (16.36) [464.6–529.2] <0.001†
Luminal/Stromal ratio (SEM)
[95% CI], unadjusted 1.982 (0.035) [1.911–2.052] 2.073 (0.039) [1.994–2.153] 1.930 (0.041) [1.847–2.013] 1.965 (0.044) [1.876–2.054] 1.917 (0.044) [1.829–2.005] 0.061* adjusted 1.986 (0.040) [1.907–2.065] 2.072 (0.040) [1.993–2.150] 1.932 (0.040) [1.854–2.011] 1.943 (0.040) [1.882–2.039] 1.916 (0.040) [1.837–1.995] 0.057‡
Table 1. Differences in the choroidal structures among the eyes with different stages of diabetic retinopathy. NDR, no diabetic retinopathy; mNPDR, mild to moderate nonproliferative diabetic retinopathy; PDR, proliferative diabetic retinopathy; PRP, panretinal photocoagulation; SFCT, subfoveal choroidal thickness; SEM, standard error of the mean. *One-way analysis of variance. †General linear model where age and axial length
were used as covariance. Covariates appearing in the model are evaluated at the following values: age = 58.58, axial length = 23.86. ‡General linear model where axial length were used as covariance. Covariates appearing in
SFCT, B (β) [95% CI], μm p Total choroidal area, B (β) [95% CI], 103 μm2 p Luminal area, B (β) (95% CI), 103 μm2 p Stromal area, B (β) (95% CI), 103 μm2 p L/S ratio, B (β) (95% CI) p Adjusted R2 0.390 0.375 0.338 0.413 0.084 Age −2.7 (−0.417) [−3.5 to −1.9] <0.001 −14.6 (−0.423) [−18.8 to −10.4] <0.001 −9.8 (−0.396) [−12.8 to −6.7] <0.001 −4.9 (−0.455) [−6.1 to −3.6] <0.001 axial length −34.8 (−0.414) [−44.9 to −24.8] <0.001 −165.6 (−0.372) [−218.3 to −112.9] <0.001 −121.6 (−0.382) [−160.3 to −82.8] <0.001 −45.2 (−0.326) [−61.7 to −28.6] <0.001 −0.054 (−0.206) [−0.089 to −0.019] 0.003 Sex (women) −23.4 (−0.135) [−43.9 to −2.9] 0.026 −145.3 (−0.159) [−253.2 to −37.3] 0.020 −112.3 (−0.172) [−191.7 to −32.9] 0.006 −27.9 (−0.098) [−61.5 to 5.7] 0.103 Albumin index† 0.004 (0.087) [−0.002 to 0.010] 0.160 34.3 (0.130) [2.6 to 66.0] 0.034 22.1 (0.117) [−1.2 to 45.3] 0.063 14.5 (0.177) [1.8 to 27.2] 0.025 Stage of DR, NDR 0 0 0 0 mNDR 35.9 (0.173) [6.8 to 65.1] 0.016 200.2 (0.181) [46.3 to 354.1] 0.011 164.7 (0.209) [52.0 to 277.3] 0.004 30.6 (0.089) [−17.0 to 78.1] 0.206 Severe NPDR 53.9 (0.239) [22.6 to 84.8] 0.001 284.9 (0.240) [120.2 to 449.7] <0.001 204.4 (0.240) [85.5 to 323.3] 0.001 81.4 (0.220) [30.7 to 132.2] 0.002 PDR without PRP 54.2 (0.258) [21.9 to 86.5] 0.001 284.8 (0.256) [114.0 to 455.7] 0.002 195.3 (0.245) [75.6 to 315.0] 0.002 89.9 (0.259) [37.0 to 142.7] 0.001 PDR with PRP −4.7 (−0.023) [−34.0to 24.6] 0.753 −4.7 (−0.004) [−161.8 to 152.4] 0.758 10.7 (0.014) [−103.6 to 125.1] 0.853 −28.3 (−0.083) [−76.7 to 20.1] 0.250 DME (present) 4.5 (0.026) [−16.7 to 25.8] 0.673 33.4 (0.036) [−78.0 to 144.9] 0.555 −45.4 (−0.158) [−130.0 to 39.5] 0.292 Hypertension (present) −132.5 (−0.139) [−246.3 to −18.6] 0.023 −98.9 (−0.145) [−182.5 to −15.4] 0.021
Type of DME, absent 0
Sponge-like swelling 9.1 (0.021) [−58.8 to
77.1] 0.791 Cystoid macular edema
74.5 (0.224) [−14.0 to 163.0] 0.098 Serous retinal detachment 59.4 (0.116) [−34.8 to 153.6] 0.215 Serum albumin 12.2 (0.051) [−24.9 to 49.4] 0.516 BCVA −0.198 (−0.174) [−0.363 to 0.032] 0.019 CMT −0.000 (−0.108) [−0.001 to 0.000] 0.144 Table 2. Multivariate Regression Analysis for the determinants that influenced the choroidal structures*. Using the variables which were significant in univariate analysis for each choroidal parameter, multivariate regression analyses were performed. Values in bold indicate statistical significance (P < 0.05). SFCT, subfoveal choroidal thickness; L/S ratio, ratio of luminal to stromal area; eGFR, estimated glomerular filtration rate; NDR, no diabetic retinopathy; mNPDR, mild to moderate nonproliferative diabetic retinopathy; PDR, proliferative
choroidal blood flow was reported to increase as the severity of retinopathy progressed33,34. These findings may explain why the luminal area was larger in sNPDR and PDR without PRP than in NDR.
The increase in the vascular permeability caused by increased levels of VEGF induces vascular leakage and swelling of the choroidal stroma. Choroidal vascular hyperpermeability and leakage of proteinaceous fluid into the choroidal stroma have been reported in the eyes with DR3,23. These changes are compatible with our results that the stromal areas in sNPDR and PDR without PRP were larger than that in NDR. Thus, the increase of both the luminal and stromal areas with a progression of DR account for the increase in the SFCT and TCA without significant changes in the L/S ratio.
The SFCT, TCA, luminal area, and stromal area in eyes with PDR with PRP were smaller than those in the eyes with PDR without PRP. Previous studies reported that the choroidal thickness, total choroidal area, luminal area as well as the choroidal blood flow were decreased after the PRP10,25,33. It has been reported that the VEGF level in ocular fluid in patients with PDR was higher than that in patients with NPDR, and that it was decreased after PRP35. These findings suggest that the PRP reduced the expression of VEGF which then led to a reduction of the choroidal vessel diameters and vascular permeability resulting in a thinning of the choroid. However, the effects of PRP on the choroidal structures remain to be elucidated because other cytokines and inflammatory cells are known to be involved in this complicated condition36.
We found no significant association between choroidal parameters and the presence of DME or type of DME in multivariate analysis. In several studies that examined the choroidal thickness in eyes with DME and/or PDR, subjects included had undergone prior treatment with PRP or anti-VEGF therapy that reduces the choroidal thickness. This may be another reason for the contradictory results of the choroidal thickness in DR.
The albumin index was significantly correlated with the choroidal stromal area. The reason for the results remains unclear. A possible explanation would be that hypoalbuminemia caused by albuminuria lead to fluid accumulation in the stromal tissue in the body including choroidal stroma; however, choroidal stromal area was not significantly associated with serum albumin in the multivariate analysis.
Albuminuria is caused by the disruption of the filter barrier in the glomeruli which are comprised of nega-tively charged barriers of the endothelial cells of the glomerular capillaris and basement membranes, and the size barriers of the podocytes37,38. The negatively charged barriers restrict the passage of negatively charged molecules such as albumin through the capillary lumens into Bowman’s capsule. Choriocapillaris which has fenestration similar to the glomerular capillaries consists of endothelial cells lined with a basement membrane both of which are negatively charged and serve as charge barriers39,40. It has been reported that there is a disruption of filtration barrier associated with a thickening of the basement membrane and a decrease in anionic sites in the basement membrane of the choriocapillaris and the glomeruli in diabetic patients41,42. Histologically, the choroid in diabetic choroidopathy and the glomeruli in diabetic nephropathy have the characteristic features in common including the thickening of the basement membrane of capillaries associated with the periodic acid–Schiff (PAS)-positive materials23,43. PAS-positive nodules in the choroidal stroma were reported to closely resemble those in the mes-engial matrix of glomeruli (Kimmelstiel-Wilson nodule)23. It might be possible that when the glomerular filter barrier is damaged more severely, there is a more extensive breakdown of the charge barrier of choriocapillaris which has structural and functional similarity to the glomeruli. The breakdown of the charge barrier of the chori-ocapillaris would allow large molecules to leak outside the capillaries, resulting in fluid retention in the choroidal stroma. This may explain the association between the albuminuria and the choroidal stromal edema.
The TCA and luminal area were significantly smaller in the patients with systemic hypertension than nor-motensive subjects. Choroidal blood volume measured with laser Doppler Flowmetry has been reported to be reduced in patients with systemic hypertension16. In addition, choroidal thickness has also been reported to be reduced in patients with systemic hypertension or coronary artery disease17,44. The decrease in the luminal area caused by arteriosclerosis or vascular contraction due to systemic hypertension may lead to the decrease in the TCA. In contrast, Ahn et al. reported that the choroidal thickness was increased in patients with severe hyperten-sion (defined as systolic blood pressure > 180 or diastolic blood pressure > 110)18. They assumed that interstitial fluid accumulation caused by the increased choroidal permeability due to extremely high blood pressure led to the thickening of the choroid. In our study, only 12 (8.7%) of 138 patients with systemic hypertension had such extremely high blood pressure. Thus, we considered that the effect of increased choroidal permeability on the choroidal thickness or choroidal stroma was not observed.
The L/S ratio was negatively correlated with axial length, which was consistent with previous reports8. It also was negatively correlated with BCVA. The reason for the results was not unclear; however, the impact of these factors on the L/S ratio was quite small (adjusted R2 = 0.084). Other factors which were not evaluated in this study
might be associated with the L/S ratio.
There are limitations in this study. First, the evaluations of the cross-sectional images of 6000 μm were prob-ably not sufficient to assume the structural changes of the entire choroid. Evaluations of three-dimensional vol-umetric scans may provide more conclusive data. Second, this was a cross-sectional study and was limited in evaluating the influence of some variants on the choroid especially the effects of medications for systemic hyper-tension and hyperglycemia on the choroidal structures. Longitudinal studies are needed in the future. Third, the manual delineation of the chorioscleral interface was not completely objective. Lastly, the choroidal structural changes observed on the OCT images should be interpreted carefully, because we did not confirm them histolog-ically. The strength of this study included its prospective design in consideration of extensive potential confound-ers in treatment-naïve eyes.
diabetic retinopathy; PRP, panretinal photocoagulation; BCVA, best corrected visual acuity; CMT, central macular thickness. *Data were presented as B, unstandardized coefficients (β, standardized coefficients) [95% CI for B]. †Albumin index = the ratio of urinal albumin to urinal creatinine.
In conclusion, the subfoveal choroidal thickness, total choroidal area, luminal area, and stromal area in eyes with diabetes may increase with the progression of DR but decrease after PRP. The total choroidal area and stro-mal area were significantly correlated with the degree of albuminuria, suggesting the association between the albuminuria and choroidal stromal edema.
Material and Methods
The procedures used in this study conformed to the tenets of the Declaration of Helsinki, and a signed informed consent was obtained from each subject. This study was approved by the Institutional Review Boards of Sapporo City General Hospital and Tokushima University Hospital.
Inclusion and exclusion criteria.
This was a prospective, cross-sectional, interventional study of 200 eyes of 200 consecutive patients with type 1 or type 2 diabetes who were examined at Sapporo City General Hospital and Tokushima University Hospital between February 2017 and January 2019. During the period, consecutive potentially eligible Japanese outpatients with diabetes were invited to participate in the study until the number of cases in each group reached 40. The right eye of each patient was included. When the right eyes were excluded by the exclusion criteria, the left eyes could be included.The exclusion criteria included the age of < 20 years or > 80 years, high myopia defined as a spherical equiva-lent of < −6.0 diopters or an axial length of > 26.5 mm, a BCVA worse than 20/400, ocular hypertension defined as intraocular pressure of > 24 mmHg, corneal diseases, glaucoma, and chorioretinal diseases other than DR. Eyes with cataract, premacular hemorrhage, and severe macular hard exudates that affected the BCVA and quality of EDI-OCT images, poor EDI-OCT image quality defined as an image quality index of < 30, abnormal EDI-OCT findings from other chorioretinal diseases than DR were also excluded. Eyes that had been treated with intra-vitreal injections of anti-VEGF, intraintra-vitreal or subtenon injection of steroids, macular photocoagulation, and previous intraocular surgeries except for non-complicated cataract surgery also were excluded. Eyes treated with any type of previous retinal photocoagulation were excluded except for the eyes with PDR with PRP which were performed more than 6 months before enrollment. Patients with other systemic diseases such as heart failure, malignancy, endocrine diseases, and severe anemia defined as hemoglobin < 8 g/dl, and subjects under hemodi-alysis, pregnancy, or steroidal treatment also were excluded.
Systemic and ophthalmic examinations.
Systemic examinations performed included systolic and dias-tolic blood pressure, mean arterial blood pressure (MAP), mean ocular perfusion pressure (MOPP), heart rate, hemoglobin, hemoglobin A1C, body mass index, serum level of albumin, triglycerides, total cholesterol, lowden-sity lipoprotein cholesterol, high denden-sity lipoprotein cholesterol, creatinine, and estimated glomerular filtration rate. MAP and MOPP were calculated according to the following formulas: MAP = diastolic blood pressure + 1/3 (systolic blood pressure – diastolic blood pressure), and MOPP = 2/3MAP- intraocular pressure. The degree of albuminuria was defined as the ratio of urinal albumin to urinal creatinine which was called albumin index. Information on the duration of diabetes and current smoking were collected from patients’ oral reports, and current medications for systemic hypertension, hyperglycemia, and dyslipidemia also were recorded according to the physician’s letter or the medical diaries that were generally used in Japan to record the all medications for each patient.
Ophthalmic examinations included measurements of the refractive error, axial length, the BCVA, and intraocular pressure, slit-lamp biomicroscopy, indirect ophthalmoscopy, fundus photography, and EDI-OCT. Fluorescein angiography was performed according to the ophthalmologists’ decision.
The stage of DR was classified according to the international classification with slight modifications45. We classified DR into following 5 groups; NDR, mild to moderate non-proliferative DR, sNPDR, PDR without prior photocoagulation, and PDR with prior PRP. DME was defined as increased retinal thickness due to DR with CMT ≥ 320 μm for men or ≥ 305 μm for women in a 1 mm diameter circle centered on the fovea, and was classi-fied into 3 groups; sponge-like retinal swelling, cystoid macular edema, and serous retinal detachment as reported (Supplementary Table S1)46. Eyes with retinal swelling caused by epiretinal membrane or vitreomacular traction were excluded.
enhanced depth imaging optical coherence tomography.
Horizontal and vertical cross-sectional EDI-OCT images of 30 degrees that passed through the fovea were obtained by Spectralis OCT instrument (Heidelberg Engineering, Heidelberg, Germany) for each eye. Each image was recorded through dilated pupil with the eye tracking system, and 100 scans were averaged to enhance the signal-to-noise ratio. The CMT was defined as the mean distance between the internal limiting membrane and the outer surface of the RPE in Early Treatment of Diabetic Retinopathy Study central subfield of 1mm-diameter. It was automatically measured fol-lowing a raster scan composed of 31 horizontal B scans covering a 30 × 25 degrees area centered on the fovea.The examined area of the choroid was 6000 μm wide and was centered on the fovea. The parameters measured were the SFCT, TCA, luminal area, and stromal area. The L/S ratio was calculated. The SFCT was defined as the distance between the outer border of the RPE and the chorioscleral interface at the center of the fovea, and it was measured by two independent investigators (TK and JM) using the caliper function of the software embedded in the Spectralis. The average of measurements on the horizontal and vertical scan images was defined as SFCT measured by each investigator, and the average of the measurements by two investigators was used for statistical analyses.
evaluation of choroidal areas by binarization technique.
The EDI-OCT images were evaluated by one of the authors (JM) who was masked to the clinical findings. The binarization of the choroidal area in theEDI-OCT images was done by a modified Niblack method using the ImageJ software (ImageJ version 1.47, NIH, Bethesda, MD, USA) as described in detail (Fig. 1)24. The examined area was 6000 μm wide and centered on the subfoveal choroid from the RPE to the chorioscleral border. In the binarized images, the light and dark pixels were defined as the stromal and luminal areas. They were automatically calculated after adding the data on the relationship between the distance on the fundus and the pitch of the pixels in the EDI-OCT images, which was dependent on the axial length.
All parameters of each horizontal and vertical image were measured three times, and the averages of 6 meas-urements were used for the statistical analyses. The correlations of the choroidal parameters of EDI-OCT with ocular and systemic parameters were determined.
Statistical analyses.
The sample size calculation was performed with a statistical software G*Power 3.9.9.2 (Germany). The effect size of stage of DR on the choroidal thickness was set as 0.25 (medium size effect) accord-ing to the report by Cohen47 and previous contradictory results1–5. Using a two-sided alpha error of 5% and a power of 80%, 40 eyes were required for each of the 5 groups. Other statistical analyses were performed with the SPSS version 22 software (IBM, Armonk, New York, USA). The equalities of variances were confirmed with the Leven’s tests. The BCVA were converted from decimal visual acuity to the logarithm of the minimum angle of resolution for statistical analysis. The significance of the differences in the choroidal parameters between 2 groups was determined using independent t-tests, and the significances of differences among 3 or more groups were determined using one-way analysis of variance and general linear model with the Bonferroni test for post hoc analyses. The correlations between choroidal parameters and other continuous variables were determined by partial regression coefficients of correlation. Multivariate regression analyses were performed to determine the parameters that were significantly correlated with choroidal parameters. The time of day when the EDI-OCT images were obtained was evaluated by Kruskal-Wallis analysis9. A two-sided P value of < 0.05 was considered statistically significantData availability
The dataset generated and analyzed in this study are available from the corresponding author upon reasonable request.
Received: 26 August 2019; Accepted: 22 October 2019; Published: xx xx xxxx
References
1. Regatieri, C. V. et al. Choroidal thickness in patients with diabetic retinopathy analyzed by spectral-domain optical coherence tomography. Retina 32, 563–568 (2012).
2. Vujosevic, S., Martini, F., Cavarzeran, F., Pilotto, E. & Midena, E. Macular and peripapillary choroidal thickness in diabetic patients.
Retina 32, 1781–1790 (2012).
3. Kim, J. T., Lee, D. H., Joe, S. G., Kim, J. G. & Yoon, Y. H. Changes in choroidal thickness in relation to the severity of retinopathy and macular edema in type 2 diabetic patients. Invest Ophthalmol Vis Sci 54, 3378–3384 (2013).
4. Xu, J. et al. Subfoveal choroidal thickness in diabetes and diabetic retinopathy. Ophthalmology 120, 2023–2028 (2013).
5. Querques, G. et al. Enhanced depth imaging optical coherence tomography in Type 2 Diabetes. Invest Ophthalmol Vis Sci 53, 6017–6024 (2012).
6. Barteselli, G. et al. Choroidal volume variations with age, axial length, and sex in healthy subjects: a three-dimensional analysis.
Ophthalmology 119, 2572–2578 (2012).
7. Li, X. Q., Larsen, M. & Munch, I. C. Subfoveal choroidal thickness in relation to sex and axial length in 93 Danish University students. Invest Ophthalmol Vis Sci. 52, 8438–8441, https://doi.org/10.1167/iovs.11-8108 (2011).
8. Sonoda, S. et al. Luminal and stromal areas of choroid determined by binarization method of optical coherence tomographic images.
Am J Ophthalmol 159, 1123–1131 (2015).
9. Kinoshita, T. et al. Diurnal variations in luminal and stromal areas of choroid in normal eyes. Br J Ophthalmol 101, 360–364 (2016). 10. Okamoto, M., Mtsuura, T. & Ogata, N. Effects of panretinal photocoagulation on choroidal thickness and choroidal blood flow in
patients with severe nonproliferative diabetic retinopathy. Retina. 36, 805–811 (2016).
11. Yiu, G. et al. Effect of anti-vascular endothelial growth factor therapy on choroidal thickness in diabetic macular edema. Am J
Ophthalmol. 158, 745–751 (2014).
12. Sonoda, S. et al. Effect of Intravitreal Triamcinolone acetonide or bevacizumab on choroidal thickness in eyes with diabetic macular edema. Invest Ophthalmol Vis Sci. 55, 3979–3985, https://doi.org/10.1167/iovs.14-14188 (2014).
13. Ahn, S. J., Woo, S. J. & Park, K. H. Choroidal thickness change following vitrectomy in idiopathic epiretinal membrane and macular hole. Graefe’s Arch Clin Exp Ophthalmol. 254, 1059–1067, https://doi.org/10.1007/s00417-015-3154-4 (2016).
14. Horváth, H. et al. Choroidal thickness changes in non-treated eyes of patients with diabetes: swept-source optical coherence tomography study. Acta Diabetol. 55, 927–934, https://doi.org/10.1007/s00592-018-1169-0 (2018).
15. Ishibazawa, A. et al. Choroidal thickness evaluation before and after hemodialysis in patients with and without diabetes. Invest
Ophthalmol Vis Sci. 56, 6534–6541, https://doi.org/10.1167/iovs.15-16719 (2015).
16. Xu, W. et al. Association of risk factors for choroidal neovascularization in age-related macular degeneration with decreased foveolar choroidal circulation. Am J Ophthalmol. 150, 40–47.e2, https://doi.org/10.1016/j.ajo.2010.01.041 (2010).
17. Akay, F., Gundogan, F. C., Yolcu, U., Toyran, S. & Uzun, S. Choroidal thickness in systemic arterial hypertension. Eur J Ophthalmol
26, 152–157 (2016).
18. Ahn, S. J., Woo, S. J. & Park, K. H. Retinal and choroidal changes with severe hypertension and their association with visual outcome.
Invest Ophthalmol Vis Sci 55, 7775–7785, https://doi.org/10.1167/iovs.14-14915 (2014).
19. Wong, I. y., Wong, R. L., Zhao, P. & Lai, W. W. Choroidal thickness in relation to hypercholesterolemia on enhanced depth imaging optical coherence tomography. Retina 33, 423-428 https://journals.lww.com/retinajournal/Fulltext/2013/02000/CHOROIDAL_ THICKNESS_IN_RELATION_TO.23.aspx (2013).
20. Simsek, A. et al. Evaluation of choroidal thickness in children with iron deficiency anemia. Invest Ophthalmol Vis Sci 57, 5940–5944,
https://doi.org/10.1167/iovs.15-18713 (2016).
21. Schmidl, D. et al. Effect of Nifedipine on choroidal blood flow regulation during isometric exercise. Invest Ophthalmol Vis Sci 53, 374–378, https://doi.org/10.1167/iovs.11-8536 (2012).
22. Cao, J., McLeod, D. S., Merges, C. A. & Lutty, G. A. Choriocapillaris degeneration and related pathologic changes in human diabetic eyes. Arch Ophthalmol 116, 589–597 (1998).
23. Hidayat, A. A. & Fine, B. S. Diabetic choroidopathy: light and electron microscopic observations of seven cases. Ophthalmology 92, 512–522 (1985).
24. Sonoda, S. et al. Choroidal structure in normal eyes and after photodynamic therapy determined by binarization of optical coherence tomographic images. Invest Ophthalmol Vis Sci 55, 3893–3898 (2014).
25. Okamoto, M., Yamashita, M. & Ogata, N. Effects of intravitreal injection of ranibizumab on choroidal structure and blood flow in eyes with diabetic macular edema. Graefe’s Arch Clin Exp Ophthalmol. 256, 885–892, https://doi.org/10.1007/s00417-018-3939-3
(2018).
26. Nagaoka, T. et al. Alteration of choroidal circulation in the foveal region in patients with type 2 diabetes. Br J Ophthalmol 88, 1060–1063 (2003).
27. Bischoff, P. M. & Flower, R. W. Ten-year experience with choroidal angiography using indocyanine green dye: a new routine examination or an epilogue? Doc Ophthalmol 60, 235–291 (1985).
28. Dodo, Y. et al. Clinical relevance of reduced decorrelation signals in the diabetic inner choroid on optical coherence tomography angiography. Sci Rep. 7, 5227, https://doi.org/10.1038/s41598-017-05663-9 (2017).
29. Aiello, L. P. et al. Hypoxic regulation of vascular endothelial growth factor in retinal cells. Arch Ophthalmol 113, 1538–1544 (1995). 30. Blaauwgeers, H. G. et al. Polarized vascular endothelial growth factor secretion by human retinal pigment epithelium and localization of vascular endothelial growth factor receptors on the inner choriocapillaris. Evidence for a trophic paracrine relation.
Am J Pathol 155, 421–428, https://doi.org/10.1016/S0002-9440(10)65138-3 (1999).
31. Gyurkovics, M. et al. Venodilatory effect of vascular endothelial growth factor on rat gingiva. J Periodontol. 80, 1518–1523, https:// doi.org/10.1902/jop.2009.080651 (2009).
32. Asano, S. et al. Choroidal structure as a biomarker for visual acuity in intravitreal aflibercept therapy for polypoidal choroidal vasculopathy. Plos One 13, e0197042, https://doi.org/10.1371/journal.pone.0197042 (2018).
33. Savage, H. I. et al. Differences in pulsatile ocular blood flow among three classifications of diabetic retinopathy. Invest Ophthalmol
Vis Sci 45, 4504–4509 (2004).
34. MacKinnon, J. R. et al. Pulsatile ocular blood flow in untreated diabetic retinopathy. Acta Ophthalmol 75, 661–664 (1997). 35. Aiello, L. P. et al. Vascular endothelial growth factor in ocular fluid of patients with diabetic retinopathy and other retinal disorders.
N Engl J Med. 331, 1480–1487, https://doi.org/10.1056/NEJM199412013312203 (1994).
36. Das, A., McGuire, P. G. & Rangasamy, S. Diabetic macular edema: pathophysiology and novel therapeutic targets. Ophthalmology.
122, 1375–1394, https://doi.org/10.1016/j.ophtha.2015.03.024 (2015).
37. Brenner, B. M., Hostetter, T. H. & Humes, H. D. Molecular basis of proteinuria of glomerular origin. N Eng J Med 298, 826–833 (1978).
38. Suh, J. H. & Miner, J. H. The glomerular basement membrane as a barrier to albumin. Nat Rev Nephrol 9, 470–477 (2013). 39. Essner, E. & Pino, R. M. Distribution of anionic sites in Bruch’s membrane of the rabbit eye. Eur J Cell Biol 27, 251–255 (1982). 40. Pino, R. M., Essner, E. & Pino, L. C. Location and chemical composition of anionic sites in Bruch’s membrane of the rat. J Histochem
Cytochem 30, 245–252 (1982).
41. Caldwell, R. B., Slapnick, S. M. & McLaughlin, B. J. Decreased anionic sites in Bruch’s membrane of spontaneous and drug-induced diabetes. Invest Ophthalmol Vis Sci 27, 1691–1697 (1986).
42. Jefferson, J. A., Shankland, S. J. & Pichler, R. H. Proteinuria in diabetic kidney disease: a mechanistic viewpoint. Kidney Int 74, 22–36 (2008).
43. Tervaert, T. W. C. et al. Pathologic classification of diabetic nephropathy. J Am Soc Nephrol. 21, 556 LP–563, https://doi.org/10.1681/ ASN.2010010010 (2010).
44. Ahmad, M., Kaszubski, P. A., Cobbs, L., Reynolds, H. & Smith, R. T. Choroidal thickness in patients with coronary artery disease.
PLoS One 12, e0175691. Published 2017 Jun 20. https://doi.org/10.1371/journal.pone.0175691 (2017).
45. Early Treatment Diabetic Retinopathy Study Research Group. Grading diabetic retinopathy from stereoscopic color fundus photographs—an extension of the modified airlie house classification: ETDRS Report Number 10. Ophthalmology 98, 786–806 (1991).
46. Otani, T., Kishi, S. & Maruyama, Y. Patterns of diabetic macular edema with optical coherence tomography. Am J Ophthalmol 127, 688–693 (1999).
47. Cohen, J. Statistical Power Analysis for the Behavioral Sciences (2nd ed.). Hillsdale, N. J.: Lawrence Erlbaum Associates (1998).
Acknowledgements
This work was supported in part by grant-in-aid 19K09951 (to Y.M.) from the Ministry of Education, Science, Sports and Culture, Japan
Author contributions
T.K. conceptualized the study; T.K., H.I., and Y.M. designed the study; T.K., H.I., M.S., A.H., S.A., H.M., M.I., F.M., M.N., H.S., and Y.M. collected the data; J.M. analyzed the images; T.K. and Y.M. analyzed the data; T.K., S.S., and Y.M. interpreted the data; T.K. wrote the original manuscript; T.K., H.I., M.S., J.M., A.H., S.A., H.M., M.I., F.M., M.N., H.S., S.S., T.S., and Y.M. revised the manuscript; T.S. and Y.M. supervised the study; All authors approved the final version of the manuscript.
competing interests
The authors declare no competing interests.
Additional information
Supplementary information is available for this paper at https://doi.org/10.1038/s41598-019-52750-0. Correspondence and requests for materials should be addressed to T.K.
Reprints and permissions information is available at www.nature.com/reprints.
Publisher’s note Springer Nature remains neutral with regard to jurisdictional claims in published maps and institutional affiliations.
Open Access This article is licensed under a Creative Commons Attribution 4.0 International License, which permits use, sharing, adaptation, distribution and reproduction in any medium or format, as long as you give appropriate credit to the original author(s) and the source, provide a link to the Cre-ative Commons license, and indicate if changes were made. The images or other third party material in this article are included in the article’s Creative Commons license, unless indicated otherwise in a credit line to the material. If material is not included in the article’s Creative Commons license and your intended use is not per-mitted by statutory regulation or exceeds the perper-mitted use, you will need to obtain permission directly from the copyright holder. To view a copy of this license, visit http://creativecommons.org/licenses/by/4.0/.