Characteristics of Strain Migration in the
Northiastern Japanese Arc. (?)-Propagation
Characteristics-著者
Ishii Hiroshi, Sato Toshiya, Takagi Akio
雑誌名
Science reports of the Tohoku University. Ser.
5, Geophysics
巻
25
号
2
ページ
83-90
発行年
1978-08
URL
http://hdl.handle.net/10097/44754
Sci. Rep. Tohoku Univ., Ser. 5, Geophysics, Vol. 25, No. 2, pp. 83-90, 1978.
Characteristics of Strain Migration in the Northeastern
Japanese Arc (I) — Propagation Characteristics
H. ISHII, T. SATO* and A. TAKAGI
Observation Center for Earthquake Prediction, Faculty of Science, Thhoku University, Sendai 980, Japan
(Received April 3, 1978)
Abstract: Strain analysis of the data from the extensometers arranged across northeastern Honshu, Japan, is performed.
The results show that the maximum shear strain migrated in the N50°W
direction at a velocity of about 38 km/year. It is also made clear that the propagating maximum shear strain shows the dispersion characteristic.
Comparison of the characteristics of the strain with other geophysical data is also discussed.
1. Introduction
Recently some workers (e.g. Mogi, 1968a, b; Scholz, 1977) pointed out the
migra-tion of great earthquake epicenters. Further, Yamada (1963) found a similar
propaga-tion phenomenon of ground tilt by the use of data from the water-tube tiltmeter. The
appearance of striking phases of secular crustal movements over a wide area in Japan were also reported (Ishii, 1976).
However, the characteristics of a slow-moving crustal deformation have not been investigated in detail. The purpose of this paper is to clarify the characteristics of migrating strain by analyzing the data recorded by the extensometers at the array stations.
2. Strain Observation
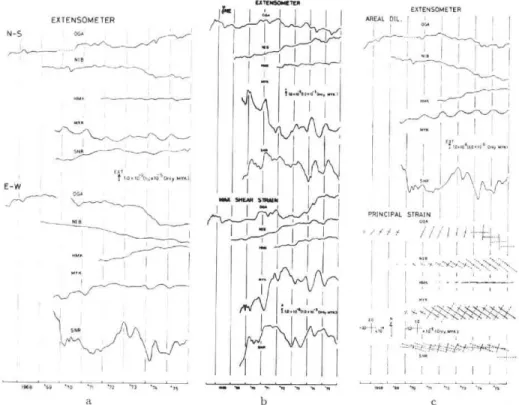
Crustal strain in the Tohoku District was observed at the stations of Oga (OGA), Niebtsu (NIB), Himekami (HMK), Miyako (MYK), and Sanriku (SNR) operated by the Akita Geophysical Observatory and the Sanriku Geophysical Observatory, Tohoku University. The locations of the stations and the plane figures of observation vaults are illustrated in Fig. 1. Only the data obtained by the extensometers are investigated in this paper. Fig. 2 shows examples of the strain components analyzed by the use of Chebychev function. The method of the data analysis and the characteristics of the strains have already been described in the previous paper (R.G.C.M., 1978).
In this work we investigate the characteristics of the maximum shear strain in detail. From Fig. 2b it is found that the maximum shear components at MYK and
H. ISHII, T. SATO and A. TAKAGI
Fig. 1.
40 1,42°E
711‘Y/.
,-7
OL.
Locations of crustal movement observatories of TOn observation vaults.
oku University and plane figures of
N—S • EXTENSOMETER ow NIB mmo, MYPI SNR I I_ EXT 55 1.01,10(1000Oniy myK)I E-W MMF I MYK I ,...,...^...i.E. 1 ri. ll 2.. 1 H 1 IIIII1,! AREAL OIL_ EXTENSOMETER • 0 71 72 73 74 '75 ea I* Nt "a 14 4, a
Fig. 2a. Ground strain components, eNs and eE w, computed from the dat five crustal movement observatories.
Fig. 2b. Ground strain components, yNE and maximum shea strains, con by extensometers at five crustal movement observatories.
Fig. 2c. Ground strain components, areal dilatations and principal strains data by extensometers at five crustal movement observatories .
— , I MVX I j_P71 PRINCIPAL STRAIN OG• I .}4.--1..1 MvX IOW, MI, I I
from the data by extensometers at
r strains, computed from the data atories.
CHARACTERISTICS OF STRAIN MIGRATION IN THE NORTHEASTERN JAPANESE ARC 85
MAX. SHEAR STRAIN
I 20,66 5NR 110,6' MYK 1969 1 '70 1' 71 1 .72 I '73 '74 f '75 SNR 10.6x156 HMK MYK HMK 11969 I '70 I .77 -171'73 I '74 I '75 7 11\l' 71i-1-' 73 1'74 I '75 1 1f\-1
fv\I
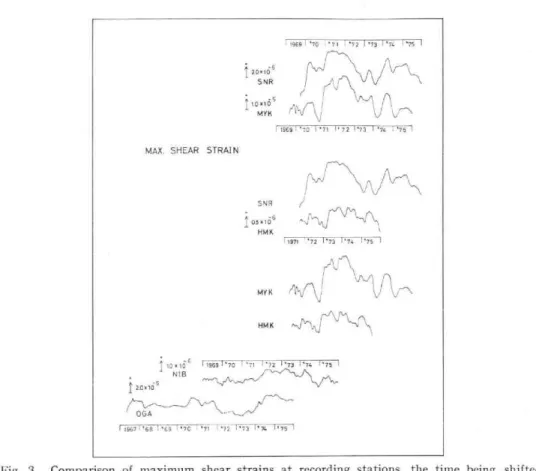
101,10' 11969 I '70 1 '71 1'72 I'73 I'74 1•76 NIB I 2_0,,166 OGA 179671'68 1'1611170 171 '72 I'74 1'75 1Fig. 3 Comparison of maximum shear strains at recording stations, the time being shifted from each other.
SNR show greater variations than those at the other stations. By filtering out the
linearly varying components, which corresponds to the first degree terms, we can get the secular components of the maximum shear strain. We have the values 8.3 x 10⁻⁷/year for OGA, 8.4 x 10⁻⁷/year for NIB, 6.4 x 10⁻⁷/year for HMK, 48.0 x 10⁻⁷/year for MYK . and 10.2 x 10⁻⁷/year for SNR. Next, filtering off the first degree term, namely, removing the linearly varying components from the maximum shear components, we can have Fig. 3 from Fig. 2b. In this figure the arbitrary time shift is given between
the corresponding maximum shear strains. It is found that a pair of the curves has a
similar waveform. A striking phase occurred at the end of 1970 at SNR is seen at
other stations, but this phase does not seem to reach the OGA station. Therefore, the
evidence supports the idea that the maximum shear strain is propagating across the northeastern Japanese arc. It is of interest that the waveform of the maximum shear is similar each other though the amplitude is different.
Fig. 4 shows the auto-covariance functions of the maximum shear strain. The
annual variation in maximum shear is found on the curves, particularly on the curve of HMK. MYK, HMK and NIB show a similar curve at this auto-covariance domain. In addition SNR and OGA exhibit a similar variation.
86 H. ISHII, T. Si TO and A. TAKAGI
10
0
--10
AUTO- COVARIA NCE
( MAX SHEAR STRAIN
SNR 0
I'
44'0 HM NIB 0 1000 2000 ( DAY) 3000Fig. 4. Comparison of auto-covariances of maximum shear strains.
3. Characteristics of strain wave
In Fig. 5, some of the corresponding phases are marked with the same symbols and joined by lines. We can calculate the average propagation velocity and direction, using the arrival times of the phases from three of the observation stations (SNR, MYK and HMK). The calculated velocity and direction are about 38 km /year and N50°W as shown in Fig. 6. The maximum shear strain curves from SNR to OGA are rearranged in Fig. 5, assuming the migration direction to be N50°W. This kind of curve is called the travel time curve in seismology. Slopes between NIB and OGA are smaller than those between SNR and NIB. Therefore, it is inferred that the
propagation velocity is different from one station to another. Assuming the same
propagation direction, the velocity propagating from NIB to OGA is about 19 km/year. Yamada (1973) obtained an apparent velocity of 20 km/year for the migration of tilt between Nokogiriyama and Aburatsubo in the Kanto District .
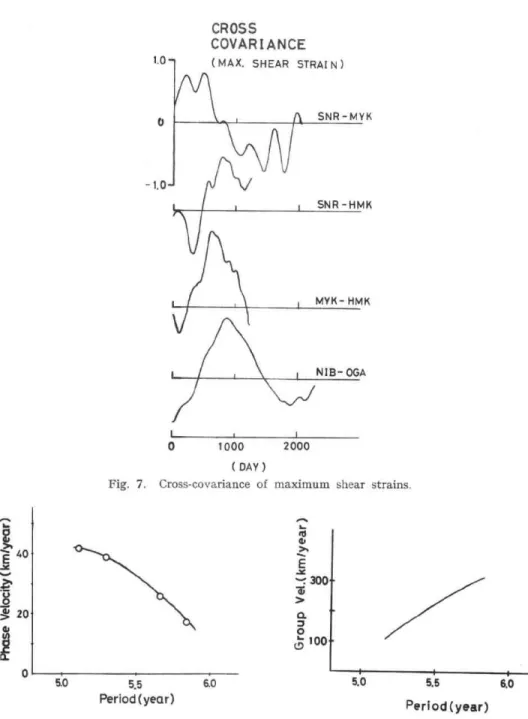
Next, the cross-covariance functions of the maximum shear strains between the stations are calculated as shown in Fig. 7. A dispersion relationship is derived by the use of the cross-covariance, applying the method employed in the seismic surface waves (Dziewonski et al., 1968). Assuming the curves in Fig. 7 to be the cross-covariances for the inter-station phase velocity, we can obtain the phase velocity vs. period curve as in Fig. 8a. It is seen that the longer the period, the slower becomes the phase velocity. The phase velocities are about 41 km/year for a period of 5.1 years, and 19 km/year for a period of 5.8 years. The wavelengths correspond to about 210 km for a period
CHARACTERISTICS OF STRAIN MIGRATION IN THE NORTHEASTERN JAPANESE ARC 87 I 2.0x10⁻⁶ SNR
ArV
V 0 1-1 1./ V MYK o' 0 10.5x10⁻⁶ HMK ^ 5 ^1.2:0x10-6
NI 1:‘"" %nor' I 2.0x10⁴ OGA M Fig. 69 70 5. Time-distance 71 72 relation of 73 74 75maximum shear strain.
1LOE lAtE <ON OGA J NIBo MK 70 km _MYK V=19kITYYr ge krn 504 SNF. • _ V=38 knYYr 1 0=N56W 3ON Fig. 6. o 1-1—..., so I...,
Direction and velocity for migration of maximum shear strain.
5.1 years and 110 km for a period 5.8 years. The group differentiating the phase velocity curve is shown in Fig. 8b the period, the faster becomes the group velocity. It is
velocity curve computed by
. It is found that the longer to be noted that the group
88 H. ISHII,
1.0
0
-1 .0
T. SATO and A. TAKAGI
CROSS COVARIANCE
( MAX. SHEAR STRAI N )
SNR - MYK SNR -HMK MYK- HMK NIB- OGA I 1 0 1000 2000 ( DAY )
Fig. 7. Cross-covariance of maximum shear strains.
..-, g >. r% ib E 4°'Z.' :g*'
ic)---
--'1N
\
..y -- .. 20'300- 1;i
8 15- ' 100 -1 .
0
0 • , I 51.5I 5.0 5.5 6,0 5.06.0Period(year) Period (year)
a b
Fig. 8a, b. Dispersion relation of maximum shear strain. velocity is larger than the phase velocity at the corresponding periods. 4. Discussion
In the preceding sections, the characteristic behavior of the maximum shear strain
CHARACTERISTICS OF STRAIN MIGRATION IN THE NORTHEASTERN JAPANESE ARC 89
shear strain in the direction N50°W was found. Fig. 9a is a schematic representation in vertical projection of the focal depth distribution of the microearthquakes that occurred in the region between 39°N and 40°N. Fig. 9b shows the average mechanisms of microearthquakes that occurred in the area A, B, C, D and E in Fig. 9a (Hasegawa et al., 1978). NW-SE compression is seen for the areas A, B and C, but not for the areas D and E. It is of interest that a pressure axis of the average mechanism solution of microearthquakes in the upper plane of the double-planed deep seismic zone is
nearly identical with the propagation direction of the maximum shear strain. It is also
interesting to note that the propagation direction of the maximum shear strain almost coincides with a direction of the motion of the pacific plate obtained by Morgan (1972).
Fig. Fig. 9a; 9b; V Ai B irr • 71:1:7611 D ri.N C +i, -- 1 - 4 ; r 1
0$1
..., .... aA schematic expression in vertical projection of the thquakes happened in the region between 39°N and 1978)
Average mechanisms of microearthquakes happened Fig. 9a. P4 77.7., 1- H , \ \ ` * ~, 1 N _L
/7!4
hypocenters of the microear-40°N. (after Hasegawa et al.,
in the area A,B,C,D and E in
Tanaka et al. (1977) found the migration of tilt in Peru and obtained apparent
velocities of about 60 to 100 km/year. A velocity of about 80 kmfyear was obtained for the migration of seismic activity along the Anatolian fault by Mogi (1968a, b). Scholz (1977) pointed out that the 1975 Haicheng earthquake was triggered by a deformation front with a propagation velocity of about 110 kmfyear. Therefore, it is said that deformation propagates at different velocities depending upon the period or wavelength. Studies of migration of crustal deformation were summarized by Kasa-hara (1977). Since the wavelength is several hundred kilometers , it is considered that the propagation characteristics of the maximum shear strain are related to the sub-stances and structures of the crust and the upper mantle beneath the earth . According to Takagi et al. (1977), earthquakes at the inland of the Tohoku District occur in the layer of the crust with P wave velocity 5.9 km/sec, but do not occur in the layer of the crust with the velocity 6.6 km/sec. The layer with the velocity 6.6 km/sec is likely to be more ductile than the layer with the velocity 5.9 km/sec. Therefore, it is reasonable to consider that the layer with the velocity 6.6 km/sec plays an important role in a slow move like the migration of the maximum shear strain .
90 H. ISHII, T. SATO and A. TAKAGI 5. Summary
The characteristics of strain migration in the Tohoku District were investigated
by analyzing data obtained by extensometers at the crustal movement observatories arranged across the northeastern Japanese arc. The results of the present study are summarized as follows:
(1) Migration of maximum shear strain was found in the northeastern Japanese
arc.
(2) The maximum shear strain propagates in the direction N50°W with the average velocity of 19 to 38 km/year.
(3) The propagating maximum shear strain has a dispersion property, and the dispersion curves have been obtained.
Acknowledgements: The authors wish to express their hearty thanks to Prof. Z. Suzuki, Prof. T. Hirasawa, the staffs of Sanriku Geophysical Observatory, Dr. K. Tanaka (Hirosaki University), Dr. T. Hasegawa (Akita Technological College) and Dr. M. Mishina (Aobayama Seismological Observatory) for many useful discussions and suggestions.
Thanks are due to the members of our Observation Center for critical discussions.
Thanks are also due to Miss N. Sakaki for preparing the manuscript.
References
Dziewonski, A., M. Landisman,- S. Bloch, Y. Sato, and S. Asano, 1968 : Progress report on
recent improvements in the analysis of surface wave observations, J. Phys. Earth, 16,
1-26.
Ishii, H., 1976: Characteristics of crustal movement observed at wide area, In: Z. Suzuki and
S. Omote (Editors), Symposium on Earthquake Prediction, Proceedings. 116-126 (in
Japanese with English abstract).
Hasegawa, A., N. Umino and A. Takagi, 1978: Double planed structure of the seismic zone in
the northeastern Japan arc, Tectonophysics, 47, 43-58.
Kasahara, K., 1977: Migration of crustal deformation R.C.M. Symposium, Tectonophysics,
(in press).
Mogi, K., 1968a: Migration of seismic activity, Bull. Earthq. Res. Inst., 46, 53-74.
Mogi, K., 1968b: Development of aftershock areas of great earthquakes, Bull. Earthq. Res. Inst., 46, 175-203.
Morgan, W.J., 1972: Deep mantle convection plumes and plate motions, Bull. Am. Assoc. Pet. Geol., 56, 203-213.
Research Group for Crustal Movement of TOhoku University, 1977: Analysis of crustal movement in the northeastern Japanese arc observed by means of an array system,
Sci. Rep. TOhoku Univ., Ser. 5, 25, 73-82.
Scholz, C.H., 1977; A Physical Interpretation of Haicheng Earthquake Prediction, Nature, 267, 121-124.
Tanaka, Y., S. Otsuka and L. Lazo, 1977: Migrating crustal deformations in Peru, Abstract,
Annual Meeting, Seismological Society of Japan, 1977, No. 2, 230.
Takagi, A., A. Hasegawa, and N. Umino, 1977: Seismic activity in the northeastern Japan Island arc system, U.S.-Japan Seminar on Theoretical and Experimental Investigations
of Earthquake Precursors. J. Phys. Earth (Special Issue), 25, 95-104.
Yamada, J., 1973. A water-tube tiltmeter and its application to crustal movement studies, Report, Earthq. Res. Inst., 10: 1-147 (in Japanese with English abstract).