Analysis of Crustal Movements in the
Northeastern Japanese Arc Observed by Means of
an Array System
著者
Research Group For Crustal Movements of Tohoku
University
雑誌名
Science reports of the Tohoku University. Ser.
5, Geophysics
巻
25
号
2
ページ
73-82
発行年
1978-08
URL
http://hdl.handle.net/10097/44753
Sci. Rep. TOhoku Univ., Ser. 5, Geophysics, Vol. 25, No. 2, pp. 73-82, 1978.
Analysis of Crustal Movements in the Northeastern Japanese
Arc Observed by Means of an Arrray System
by
Research Group for Crustal Movements of Telhoku University*
Observation Center for Earthquake Prediction, Faculty of Science,
TOhoku University, Sendai 980, Japan
(Received April 3, 1978)
Abstract: Data observed by the extensometers installed at five crustal movement
observatories of T6hoku University which are distributed in northeastern Honshu,
Japan, are analyzed using the Chebychev function technique.
Secular strain characteristics are clarified and compared with the results of
other geophysical observations.
1. Introduction
Crustal movements in northeastern Honshu were observed at the stations of
Sanriku (SNR), Miyako (MYK), Himekami (HMK), Nibetsu (NIB) and Oga (OGA)
operated by the Sanriku Geophysical Observatory and the Akita Geophyiscal
Observatory, TOhoku University. Fig. 1 is a map showing locations of the stations and plane figure of the observation vaults in this study. The vaults measure 2 meters in
both height and width and 120 to 240 meters in total length. The measuring
instruments are installed at the sites more than 30 meters inside the vaults, and the
vaults are partitioned with four bulkheads to avoid various disturbances involved. The
instruments used are fused quartz extensometers, water tube tiltmeters, horizontal
pendulum tiltmeters and seismometers. In this paper we mainly analyzed the data obtained by the extensometers to investigate strain characteristics in northeastern Honshu. Data recorded for the period 1967-1975 are employed for strain analyses. 2. Data and method of analysis
Data from the extensometers are optically recorded. The diurnal average value of
* AKIO TAKAGI and HIROSHI ISHII Observation Center for Earthquake Prediction, Faculty of
Science, T6hoku University.
MASAAKI MISHINA Aobayama Seismological Observatory, Faculty of Science, T6hoku
versity.
TOSHIYA SATO and KENJI TACHIBANA Akita Geophysical Observatory, Faculty of Science,
T6hoku University.
KEIICHI HASHIMOTO and EIJU MURAKAMI Sanriku Geophysical Observatory, Faculty of
Science, TOhoku University.
KAZUO TANAKA Department of Earth Science,Faculty of Science, Hirosaki University.
74 RESEARCH GROUP FOR CRUSTAL MOVEMENTS OF TOHOKU UNIVERSITY Fig. I. 140.E
~;
1.42.E i -.. ~_.- F ,R N s SN ". 40.N(7-} [
r- _, 38Locations of crustal movement observatories and plane figures of observation vaults.
extension is calculated by four-point sampling per day from continuous records of
extensometers. Chebychev approximation function is first computed using the diurnal
average value, and the Chebychev coefficients obtained are employed as data in the
succeeding strain analysis. This method is very useful because a limited number of the
EXTENSOMETER EX T.
f uat
Cr STRAI NH."
ti 16"E 1.1" • NVE Jr OGA DBS. NAONI §1.• eNik araftalhd Fig. 1966 '69 '70 '71 12 '73 '74 '75 762a, b, c, d, e. Plots of data obtained by extensometers at an interval of five days and
Chebychev approximation functions (solid lines), for the five crustal movement observatories.
ANALYSIS OF CRUSTAL MOVEMENTS IN THE NORTHEASTERN JAPANESE ARC 75 EX TENSOME TER ' .1".• EXT.
I 1.0
x
1
...00 ...ago. 1,00040.11%4 .4. P -STRAINI
N 6116E N 69°W N 2 3°E 0.01.1u di^ %rip N I BETU ro-^ OBS. 1969 '71 '72 '73 174 175 176 Fig. 2bChebychev coefficients can produce observation data adequate for our purpose. Fig. 2
illustrates plots of the diurnal average values at intervals of five days and their Chebychev approximation functions. Some of the functions are arbitrarily shifted to distinguish the correspondence between the plots and the functions. The numbers of
the Chebychev coefficients are 80 to 150 depending upon the period of observations. It
is evident from Fig. 2 that the data appropriate for analysis of the secular variations are obtained by using a limited number of the Chebychev coefficients. The annual variations are especially clear for the data from MYK. Drastic deviations from the
solid lines are found for SNR, which are caused by the influence of precipitation. It is
also to be noted that the variation at HMK at the central part of the TOhoku District (northeastern Honshu) is remarkably small compared with those of MYK and SNR.
3. Strain Components
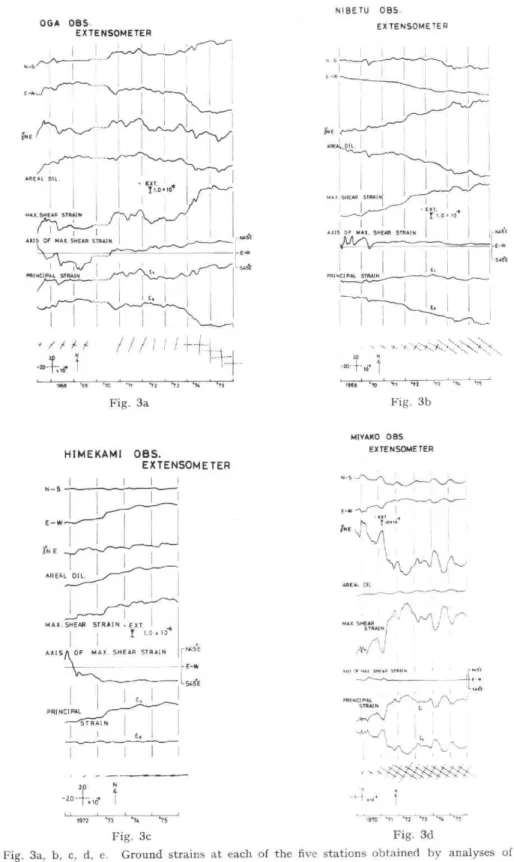
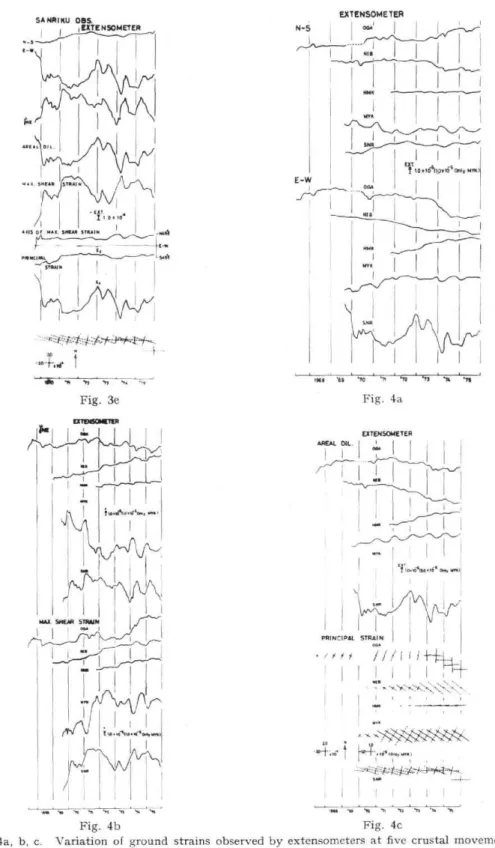
We can calculate the strain components from the computed Chebychev coefficients. Strain components observed at each of the stations are shown in Fig. 3. Fig. 4 is
76 RESEARCH GROUP FOR CRUSTAL MOVEMENTS OF TOHOKU UNIVERSITY EX TENSOMETER EXT.
fi 1.0x
1
-• STRAI N 1•110°E 1.0001.1. •^^•1 winislom°'
N 39°W pro N51'E HIMEKAM 1 OBS. 1972 '73 IP 74 Fig. 2c '75 /6made from Fig. 3 in order to distinguish the difference of the strain components between the stations. A remarkable strain variation is recognized for SNR and MYK. On the other hand, HMK shows the least strain change; in particular, an extension in the NS direction and a shear component YNE hardly varies.
Principal strains at OGA, NIB and SNR are mostly E-W compressional. On the
other hand, they are E-W extensional at HMK and mostly N-S compressional at MYK. Thus, the features of the principal strain at MYK and HMK are different from those at the other stations. Comparisons of the principal axes with data obtained from other geophysical observations are described in the next section.
Anomalous strain change occurred at the end of 1973 as seen in the E-W strain component of OGA. Some of the crustal movement observatories in Japan have observed this kind of drastic strain change at the same time (Ishii, 1976). Tanaka
ANALYSIS OF CRUSTAL MOVEMENTS IN THE NORTHEASTERN JAPANESE ARC 77 EXTENSOMETER EX T. ^
IWO°
STRAI N N 23'W N le V/ N 78'E imiro r1.-OBS. MIYAKO 1970 '71 '72 .73 Fig. 2c1 .74 .75 '76(1972) and Shichi (1975) pointed out a simultaneous appearance of remarkable crustal movements over a wide area.
Areal dilatations for OGA and NIB stations located in the western part of the Tohoku District tend to decrease, while those for HMK and MYK stations tend to increase. It is of interest that areal dilatations for OGA and NIB change in a similar way, though these two stations are apart about 40 km. A detailed account of the characteristic behavior of maximum shear strain will be made elsewhere by Ishii et al. (1978).
4. Discussion
Principal axes of the strain can be investigated by triangulation survey, too.
Comparing the results obtained by different methods would be of great importance. In
Fig. 5 dotted lines show the principal contraction axes calculated from the results of triangulation survey (G.S.I., 1972). It is evident that an E-W compression is predominant in the TOhoku District except MYK region. Our results by continuous extensometer observations are also superimposed in Fig. 5, where the solid line
indicates the axis of tension and the dotted line the axis of contraction. It is found
78 RESEARCH GROUP FOR CRUSTAL MOVEMENTS OF TOHOKU UNIVERSITY EXTENSOMETER 4 n fl EX T.
11.0
x
10
et . , O :o ?71 SANRI KU STRAIN 01, 0 BS. N 54°E N 36.W N rE h. ,VS;,1
' 1970 '71 '72 '73 '74 '75 '76 Fig. 2ethose by the geodetic method. It should be noted that near MYK the N-S
com-pression appears in the two results.
Next, we compare our strain results with those of earthquake mechanisms . Fig. 6 represents directions of compression axes of earthquake generation stress obtained by using an initial motion of P waves of the shallow earthquakes occurring in the TOhoku District (Takagi et al., 1973). The results of our strain analysis are also given for
comparison. The coincidence between these results is excellent. N-S compression
around MYK is revealed by seismic studies, too.
As earthquakes are related to sometimes to the crustal movements, the seismic activities in the TOhoku District and the locations of crustal movement observatories
are investigated. Fig. 7 shows the epicentral distribution of shallow microearthquakes
(0-10 km) and locations of the recording stations of crustal movements. In Fig. 8
the focal depth distribution of microearthquakes in the region between 39°N and 40°N is projected vertically together with crustal structures (Takagi et al., 1977), and the locations of the recording stations of crustal movements are indicated by arrows . NIB is located in the place where earthquakes have not occurred. SNR and MYK are
ANALYSIS OF CRUSTAL MOVEMENTS OGA OBS. EXTENSOMETER "-s tI4 E I ARE AL DIL .
MAX. SHEAR STRAIN AXIS OF MAX SHEAR
PRINCIPAL STRAIN zr II IN THE . I 1 I , 1 ,_t4,0 , 1 1 c, 1' ii-s4st 1
NORTHEASTERN JAPANESE ARC
NI BE TU OBS.
ESTENSOMETER
E w
AREA OIL.
I
HAx. SHEAR STRAIN
I I • EXT.
r 1.0•104 I
A X IS OF MAX. SHEAR STRAIN I I144
I E 5451 L.
PRI NCI PAL STRAIN
196E1 '59 '70 '71 '72 '73 '7A '75 Fig. 3a NIMEKAMI OBS. EXTENSOME TER I I I h N-5 --- I I E —W ON E I AREAL
MAX. SHEAR STRAIN • EXT
I I 1.0 2 104
AXIS OF MAX. SHEAR STRAIN FN45E
- LySE E, PRI PAL STRAI N I I Ea 1111 -20+,6. 1- 1972 '73 '74 '75 Fig. 3c
Fig. 3a, b, c, d, e. Ground strains at each of the five
observed by extensometers. 2.0 f I 1969 '70 .71 '72 '73 '74 .75 Fig. 3b IMAM) OBS. EXTENSOME TER N -5 E-W • ,•, ARE AL OIL , \ \NI; ^('', MAx SI% N Az, M- 511E•P S19•14 L 54*
PRI NCI PAL
STRAIN
970 .71 '72 '73 '74 75
Fig. 3d
stations obtained by analyses
79
80 RESEARCH GROUP FOR CRUSTAL MOVEMENTS OF TOHOKU UNIVERSITY EXTENSOMEIER SA NRI KU OBS.
._..,L)71,
EVE
NSOMETER
N-500;,,,..,,..____L__,,,r,--,,,--'
14-4.1 1 ' .r..../.4...---. I 1 NIB r I r Al1 WM r .R. AL OIL.5711. _..._„„).../.--- I1•
1' to. ,04(io.oss criyM*E...W 4 ^ II. 5.11.11 VIM X ,j,_j..„,...----.^,-..,... I I 41...- 0118
..., .I ..A. ,..A. sT.A.. i 1.'11
— --- --i , Ft. • 1.11 .1111C11711 ..„..„.„...- SO/ IAN I 1 1 1 ...r...-....--'-'---.%^/-.."'''...--'- it II
1 1 1
:
, 'T4 -•:.'4'i."H-.'- . 1 --.4
le I.
•"Po .74 ' '77 13 ., ;7 -' me •119 '70 •71 . *'It .7s N . ..ni '
Fig. 3e Fig. 4a
Enusomniat
7...1.7,..„...;...
I
AREAL DIL. l 1EXTENSONETE
. 1 .. •,-''"'.--t---' 1 F-/-1---t i i 1---'---'‘n"--"-'-
1!
1
----7-7---
i IwTo.lecka oil o..., wol
I I
ma&SHEARSTRUN1
7
I
1
I.1
PRINCIPAL
STRAIN
___,___Ii.—•-•--"'"---s
1
.7:1-4.-
, ,.- urn J.-\ I MO 1 , - I 1 1 I 1 ^^^• „. „ .I I
44-a1
.-:1-,.0-.1^11,10111
S'7' 1 y. 1 I I I I I L "---C .: ' u . , A , ' '11 ' .7-, ' .. ' ••^, - Fig. 4b Fig. 4cFig. 4a, b, c. Variation of ground strains observed by extensometers at five crustal movement
observatories.
ANALYSIS OF CRUSTAL MOVEMENTS IN THE NORTHEASTERN JAPANESE ARC 81
114E 7
-... 1 prindpil was (coMractIon) — : prIneln, ilas (*minion 1
-al Fig. 1427E 4 42.N 4;16 OGA 40N MYX *"--1 _ N
5. Comparison of principal axes obtained
by triangulation survey (G.S.L, 1972)
with those by extensometers.
,3eE 140.E laE
20.4
Fig. 6. -10 H MK imi31 40.14sr2.
7
38' NComparison of pressure axes obtained
by seismic investigation (Takagi et
al., 1973) with those by strain an-alyses. 2 ME 119.E ME PiiE MI Prat '"1. bs , ;id , )17 O • c , .+• ---742 • 41 • ..' ‘V!I ' '7A/Pi A), lC" , 31 i'C.eS— e O 1.OGA,,a•ap ( e 0 • • 4,M •4t..r A B • of
re
-0nNI/jig
t° ,Ot3Ei N
1.__
'27-13.7N qp0c
otity
.01 ve, Fig. 1975 ,19 - 197610 317. Epicentral distribution of shallow
microearthquakes in the Tohoku
District (Takakgi et al., 1977) and
locations of observation stations for
crustal movements. 1111, ac r COW, saw,
OGA NIB HOAK SNR BIB
79{110, ?SCOT Fig
-,:‘,4910,sot
mow SD,8. Focal depth distribution of
erthqu akes in the region between
39°N and 40°N projected on the
vertical section with crustal structure
(Takagi et al., 1977) and locations of
observation stations for crustal
movements.
w.517 As rr
:h distribution of
micro-. in the region between
40°N projected on the
situated at an aseismic front. HMK is located at a volcanic front, and many shallow earthquakes have happened around the station. OGA is located at the most western epicenter block. Our crustal movement observatories have been arranged at the places characteristics of the epicentral structure across the northeastern Japanese arc.
82 RESEARCH GROUP FOR CRUSTAL MOVEMENTS OF TOHOKU UNIVERSITY 5. Summary
Secular crustal movements in the TOhoku District were investigated, using strain
data obtained by extensometers at the crustal movement observatories located across the northeastern Japanese arc.
The results of the present study are summarized as follows:
(1) Strain changes due to secular crustal movements in the northeastern Japanese arc were clarified diagrammatically.
(2) HMK station located at the central TOhoku District shows a very stable strain variation, in contrast to MYK and SNR stations located along the Pacific coast.
(3) The principal strain axes observed at OGA, NIB and SNR stations are mostly E-W compressional, while those at the MYK station predominantly N-S
compressional. The above results coincide with those of triangulation survey and
seismic studies.
A cknowledgements : The authors wish to express their sincere thanks to Prof. Z.
Suzuki, Prof. T. Hirasawa and the staffs of Observation Center for Earthquake Prediction for many useful discussions and suggestions.
Thanks are also due to Miss N. Sakaki for preparing the manuscript. References
Geographical Survey Institute, 1972: Horizontal crustal strain in Japan, Report of the
coordinating committee for earthquake prediction, 8, 99-105.
Ishii, H., 1976: Characteristics of crustal movement observed at wide area, in: Z. Suzuki and
S. Omote (Editors). Symposium on Earthquake Prediction, Proceedings. 116-126, (in
Japanese with English abstract).
Ishii, H., T. Sato, and A. Takagi, 1978: Characteristics of strain migration in the astern Japanese arc (I) —propagation characteristics—. Sci Rep. T6hoku Univ., Ser.
5, 25, 83-90.
Shichi, R., 1975: Appearance of similar crustal movements over a wide area, Abstract given at
the meeting of the Seismological Society of ,Japan held in a'etuosn, 82.
Takagi, A., A. Hasegawa, and N. Umino, 1973: Earthquake mechanisms of shallow earthquakes occurring in the Tohoku District, Abstract given at the meeting of the
Seismological Society of ,Japan held in spring, 124.
Takagi, A., A. Hasegawa and N. Uumino, 1977: Seismic activity in the northeastern Japan arc, U.S.-Japan Seminar on Theoretical and Experimental Investigations of
Earthquake Precursors, .j. Phys. Earth (Special Issue), 25, 95-104.
Tanaka, Y., 1972: Continuous observation of crustal movements (Secular crustal movements and those preceding earthquake), Symposium on Earthquake Prediction, Proceedings.
35-44 (in Japanese).