Kyushu University Institutional Repository
吃音症固有の異常聴覚システムの時空間的特徴
菊池, 良和
九州大学大学院医学系学府
https://doi.org/10.15017/21737
出版情報:Kyushu University, 2011, 博士(医学), 課程博士 バージョン:
権利関係:(C) 2011 Elsevier Inc.
Spatiotemporal Signatures of an Abnormal Auditory System in Stuttering
Running title: Abnormal audition in stuttering
Yoshikazu Kikuchi, MD1, 2; Katsuya Ogata, MD, PhD2; Toshirou Umesaki, MD, PhD1; Takashi Yoshiura, MD, PhD3; Masamutsu Kenjo, MA6; Yoji Hirano, MD, PhD4; Tsuyoshi Okamoto, PhD5; Shizuo Komune, MD, PhD1; Shozo Tobimatsu, MD, PhD2 Departments of Otolaryngology1, Clinical Neurophysiology2, Clinical Radiology3, Neuropsychiatry4, and Digital Medicine Initiative5, Faculty of Medicine, Graduate School of Medical Sciences, Kyushu University
Department of Special Education6, Fukuoka University of Education, Fukuoka, Japan
Corresponding author: Katsuya Ogata, MD, PhD, Department of Clinical
Neurophysiology, Faculty of Medicine, Graduate School of Medical Sciences, Kyushu University, 3-1-1 Maidashi, Higashi-ku, Fukuoka 812-8582, Japan.
Tel.: +81-92-642-5543; Fax: +81-92-642-5545
E-mail address: [email protected] (K. Ogata).
The total number of words: 5246
Abstract
(206 words)People who stutter (PWS) can reduce their stuttering rates under masking noise and altered auditory feedback; such a response can be attributed to altered auditory input, which suggests that abnormal speech processing in PWS results from abnormal
processing of auditory input. However, the details of this abnormal processing of basic auditory information remain unclear. In order to characterize such abnormalities, we examined the functional and structural changes in the auditory cortices of PWS by using a 306-channel magnetoencephalography system to assess auditory sensory gating (P50m suppression) and tonotopic organization. Additionally, we employed voxel-based morphometry to compare cortical gray matter (GM) volumes on structural MR images.
PWS exhibited impaired left auditory sensory gating. The tonotopic organization in the right hemisphere of PWS is expanded compared with that of the controls. Furthermore, PWS showed a significant increase in the GM volume of the right superior temporal gyrus, consistent with the right tonotopic expansion. Accordingly, we suggest that PWS have impaired left auditory sensory gating during basic auditory input processing and that some error signals in the auditory cortex could result in abnormal speech processing.
Functional and structural reorganization of the right auditory cortex appears to be a compensatory mechanism for impaired left auditory cortex function in PWS.
Keywords: stuttering; tonotopic organization; auditory sensory gating; P50m suppression; magnetoencephalography; voxel-based morphometry
Abbreviations: AEF = auditory event-related field; BA = Brodmann area; DTI =
diffusion tensor imaging; ECD = equivalent current dipole; fMRI = functional magnetic resonance imaging; GM = gray matter; ISI = interstimulus interval; MEG =
magnetoencephalography; PWS = people who stutter; PET = positron emission
tomography; Q1 = dipole moment strength of P50m evoked by S1; Q2 = dipole moment strength of P50m evoked by S1; RMS = root mean square; S1 = first auditory click stimulus; S2 = second auditory click stimulus; STG = superior temporal gyrus; VBM = voxel-based morphometry
1 Introduction
Stuttering is a developmental disorder that affects speech fluency. This disorder is observed in 5% of children aged between 2 and 4 years (Månsson, 2000). The
mechanism of stuttering is still a matter of debate. People who stutter (PWS) decrease their stuttering rates temporarily under masking noise and altered auditory feedback, which is not only because of the resulting slower speech rate but also because of altered auditory input (Altrows and Bryden, 1977; Kalinowski et al., 1993; Lincoln et al., 2006;
Hampton and Weber-Fox, 2008). This suggests that auditory input processing could be different in PWS compared with non-stuttering subjects. Postma and Kolk (1992) proposed “auditory feedback defect theories in PWS,” in which PWS have deviant error monitoring of speech production, namely, PWS detect errors more than people who do not stutter. Postma (1993, 2000) also proposed “the covert repair hypothesis,” in which stuttering derives from the need to repeatedly repair errors before and after speech motor movement. Thereafter, Max et al. (2004) proposed "internal models and
feedback-biased motor control theory". In this hypothesis, a motor plan is constructed and executed by a feedforward controller, and execution is adjusted by a feedback controller that integrates in real time both afferent (auditory) and efferent (motor) signals. They speculated that stuttering resulted from a mismatch between predicted (feedforward) and actual (feedback) consequences of the executed movements. Overall, stuttering could be related to impaired auditory-motor integration.
Fox et al. (1996) performed neuroimaging studies and reported that stuttering is a disorder of integration within the speech system and not of a single area.
Subsequently, stutter-typical networks are not only involved in an extended right-hemispheric network, including the frontal operculum, the temporo-parietal junction, and the dorsolateral prefrontal cortex (Kell et al., 2009), but also in the impaired left-hemispheric network, including the arcuate fasciculus (Sommer et al.,
2002; Chang et al. 2008; Watkins et al. 2008; Cykowski et al., 2010), which connects temporal regions with frontal speech motor-planning (including Broca’s area) and motor regions, as well as the striato-thalamico-cortico-striatal loop, which has important connections to the auditory regions (Giraud et al., 2008). Additionally, Chang et al.
(2008) identified bilaterally abnormal fractional anisotropy in the
corticospinal/corticobulbar tract (which is involved in speech motor control) and in a posterior-lateral region underlying the supramarginal gyrus (rostral portion of the inferior parietal lobe that is connected to the classic frontotemporal language areas) in stuttering children. Watkins et al. (2008) also found disturbed integrity of the white matter underlying the functional underactive areas in the ventral premotor cortex (a connection with posterior-superior temporal and inferior parietal cortex), which provides a substrate for the integration of articulatory planning and sensory feedback.
Fluency-shaping therapies reduce right hemispheric over-activation, normalize basal ganglia activity and reactivate left-hemispheric cortex (De Nil et al., 2003; Neumann et al., 2005; Giraud et al., 2008; Kell et al., 2009). Taken together, abnormal
auditory-motor integration can be the neural basis of stuttering.
Auditory-motor integration has been investigated in 2
magnetoencephalographic (MEG) studies (Salmelin et al. 1998; Beal et al., 2010).
Salmelin et al. (1998) recorded auditory evoked magnetic fields to a single pure tone during the performance of 4 language-related tasks (reading silently, mouth movements only, reading aloud, and reading in chorus with another person). They found that the interhemispheric balance of the N100m responses of PWS was affected more severely by the tasks involving speech than by the 2 non-verbal tasks. Beal et al. (2010) reported the phenomenon of speech-induced suppression of the auditory N100m for vowel stimuli and showed that both the P50m and N100m were suppressed for word stimuli.
They also revealed that the P50m and N100m latencies in PWS were significantly
longer than those in the controls, which suggested that the timing of cortical auditory processing in PWS was slower than that in controls under various stimuli. These findings support the altered auditory-motor integration in PWS.
Therefore, we hypothesized that PWS have an abnormal auditory-motor integration system. We tested our hypothesis by using auditory sensory gating that modulates auditory inputs and tonotopic organization that corresponds to auditory
inputs. PWS do not have abnormal auditory inputs to brainstem responses (Decker et al., 1982; Newman et al., 1985; Stager, 1990). To validate our hypothesis, we conducted 3 experiments. First, we examined auditory sensory gating by MEG using a P50m (or P50 in EEG) suppression standard paradigm, as has been used in studies on schizophrenia and Alzheimer’s disease (Adler et al., 1982; Jessen et al., 2001; Thoma et al., 2003;
Hirano et al., 2010). We presented 2 successive click sounds to the subjects monaurally, and the lack of P50m suppression in response to the second sound suggested an inability to filter unnecessary auditory information. Second, we measured the most frequently used N100m in response to 3 tonal stimuli at 250, 1000, and 4000 Hz to elucidate the expansion of the tonotopic map (Pantev et al., 1998b; Naka et al., 1999). MEG has both high spatial and temporal resolution and can be used to evaluate the differences in tonotopic organization in both auditory cortices of PWS and controls. Third, we performed three-dimensional voxel-based morphometry (VBM) to assess structural changes in the auditory cortex. Using the results of these studies, we have provided electrophysiological and structural evidence for abnormal auditory processing in PWS.
2 Methods
2.1 Experiment 1: Auditory sensory gating
2.1.1 Subjects
Seventeen men who stutter (mean age, 30.2 ± 5.7 years; range, 21–41 years) and 18 control male subjects (mean age, 30.6 ± 6.2 years; range, 22–43 years)
participated in the present study. PWS were recruited from a self-help group as volunteers and were diagnosed as having developmental stuttering according to
DSM-IV (Diagnostic and Statistical Manual of Mental Disorders-IV). All subjects gave their written informed consent for participation in the study, and the study was approved by the Ethics Committee of Kyushu University. None of the participants had a history of otological or neurological disorders, and all were right-handed according to the
Edinburgh Handedness Inventory (Oldfield, 1971). Unfortunately, we were unable to enroll the same participants across all experiments.
The severity of stuttering was assessed by a speech-language-hearing therapist as the percentage of stuttered syllables of at least 300 analyzable syllables averaged over 3 different speaking contexts (reading a short story, describing pictures, and asking questions) and rated as 8.4% (range, 0.8%–36.7%) for PWSand 0.22% (range,
0%–0.55%) for the control group. We excluded 1 subject because of a low dysfluency of less than 1% (Jones et al., 2005; Kell et al., 2009). The stuttered syllables included only the instances of unambiguous stuttering (Jones et al., 2000) and incorporated syllable repetitions and audible and inaudible sound prolongations (Conture, 2001), except normal dysfluencies such as interjections, whole-word repetitions, revisions, and phrase-repetitions.
2.1.2 Stimulus setting
Auditory stimuli were 3-ms monaural clicks presented in pairs with a 500-ms interstimulus interval (ISI) and an intertrial interval that randomly varied between 8 and 12 s (Thoma et al., 2003). The hearing threshold was determined for each subject, and the stimuli were delivered at an intensity of 30 dB above the threshold so as not to
induce cross-hearing. The subjects received the stimuli from a Tone Burst Generator (Kyushu Keisokuki, Japan) passed through a plastic tube (length, 6 m; inner diameter, 8 mm) into sponge ear pieces fitted in the subjects’ ears. The subjects were in supine position.
2.1.3 MEG recording
Auditory evoked magnetic fields were measured using a whole-head
306-channel biomagnetometer system (Elekta-Neuromag, Helsinki, Finland) in a quiet, magnetically shielded room. The detector array comprised 102 identical triple sensor elements, with each sensor element comprising 2 orthogonally oriented planar-type gradiometers and 1 magnetometer. Planar gradiometers pick up the strongest signals just above the local current, and consequently, the locations of the sensors detecting the strongest signals could be readily used as the first guesses of the activated brain areas (Hämäläinen et al., 1993). Prior to the recording, four head position indicator (HPI) coils were attached to the scalp, and a 3D digitizer was used to measure anatomical landmarks of the head with respect to the HPI coils. During data acquisition, the HPI coils were continuously active and the head position was continuously measured. The magnetic responses were digitally sampled at a rate of 1000 Hz. In order to keep subjects alert and to prevent them from paying attention to the auditory stimuli, we instructed them to watch a silent cartoon movie during the recordings (Thoma et al., 2008; Weisser et al., 2001).
After a recording, the movement compensation realized by the temporal extension signal space separation (MC-tSSS) with Maxfilter 2.0 software (Elekta Neuromag®) was applied off-line to the recorded raw data to reduce artifact signals arising from outside the sensor array and to correct the head position as well as the associated movement-related artifacts (Taulu, 2004, 2005; Medvedovsky et al., 2007).
Off-line averaging of the auditory event-related field (AEF) was performed using the MC-tSSS-reconstructed raw data, and 150 responses were averaged for each ear. A –100 to –10 ms baseline adjustment and a 5–55 Hz bandpass filter (Thoma et al. 2003; Lu et al., 2007) were then applied to the AEF. Of the 306 channels recorded, 70 channels, including the P50m signal contralateral to the stimulus, were selected for analysis (Fig.
1A). We analyzed the AEFs contralateral to the stimulated ear, which are usually larger than the ipsilateral AEFs (Pantev et al., 1986). The peak latencies and amplitudes of the AEFs were determined by root mean square (RMS) waveforms reconstructed from the gradiometers. A single equivalent current dipole (ECD) was calculated, yielding 3-dimensional coordinates of the P50m responses. The origin of this coordinate system was set at the midpoint of the medial-lateral axis (x axis), which joined the center points of the entrance to the external acoustic meatus of both sides (positive toward the right ear). The anterior-posterior axis (y axis) was oriented from the origin to the nasion (positive toward the nasion) and the inferior-superior axis (z axis) was perpendicular to the x-y plane (positive toward the vertex). The locations of the ECDs were standardized with their origins and radii. For estimating the ECD of P50m, 10-ms data across the time point showing the maximal amplitude of P50m were selected from the RMS
waveforms, and the ECDs with the largest dipole moment over the period were selected.
The calculated ECD strengths and locations were accepted for further analysis when they satisfied the following criteria: (1) a P50m peak latency between 20 and 70 ms, and (2) a goodness-of-fit greater than 75% (Hirano et al., 2008, 2010; Thoma et al., 2003).
P50m suppression was expressed as a ratio of the P50m dipole moment evoked by S2 (Q2) to that evoked by S1 (Q1). We used Q2/Q1 as a measure of the disinhibition of auditory sensory gating (Thoma et al., 2003; Lu et al., 2007).
2.1.4 Statistical analysis
In order to analyze the P50m Q2/Q1, latency, and locations, we performed repeated-measures multivariate analysis of variance (MANOVA) with hemisphere (left vs. right) as the within-subject factor and group (PWS vs. controls) as the
between-subject factor using SPSS 11.5. Post-hoc analyses were conducted using multiple comparisons with Bonferroni correction. The significance level was set at 0.05.
The association between Q2/Q1 and stuttering rate was evaluated using Pearson’s correlation coefficient.
2.2 Experiment 2: Tonotopic organization
2.2.1 Subjects
Sixteen men who stutter (mean age, 30 ± 5.8 years; range, 21–41 years) and 16 control male subjects (mean age, 30.8 ± 6.4 years; range, 22–43 years) participated in this experiment. Fourteen PWS and 13 controls who participated in experiment 1 also participated in this experiment. The severity of stuttering was rated as 8.4% (range, 0.8% to 36.7%) for PWS and 0.22% (range, 0% to 0.55%) for the control group. We excluded 1 subject because of low disfluency. The other conditions were the same as those described for experiment 1.
2.2.2 Stimulus delivery
Each auditory tone-burst stimulus of 250, 1000, and 4000 Hz (300-ms duration, with a 10-ms rise and 20-ms fall) was monaurally presented more than 128 times in a random order. The ISI was distributed between 2.5 and 3.5 s. The peak stimulus intensity was set at 30 dB above the hearing threshold.
2.2.3 MEG recording
The averaged evoked fields were referred to a baseline from –100 to –10 ms
and filtered from 1 to 20 Hz (Pantev et al., 1995; Elbert et al., 2002; Rojas et al., 2002).
The dipole moment, location, and latency of the N100m source were determined in a manner similar to that described for experiment 1. The calculated values were accepted for further analysis if they satisfied the following criteria: (1) an N100m latency
between 80 and 160 ms of the RMS peak; (2) a goodness-of-fit value of the ECD greater than 85%; and (3) a confidence volume less than 100 mm3 (Elbert et al., 2002;
Rojas et al., 2002).
2.2.4 Statistical analysis
The N100m source amplitudes, latency, and locations were analyzed using a repeated-measures MANOVA with a between-subject factor of group and within-subject factors of hemisphere and frequency (250, 1000, and 4000 Hz). Post-hoc analyses were performed using multiple comparisons with Bonferroni correction. In order to examine the expansion of the tonotopic map, we fitted linear regression lines for each direction of the x (medial-lateral) and y (anterior-posterior) axes and calculated the regression coefficient. When N100m dipole locations are plotted against the logarithm of frequency, they can be represented by a straight line (Pantev et al., 1995, 1998a).
Thereafter, we compared the regression coefficient by using a repeated-measures MANOVA with a between-subject factor of group and a within-subject factor of hemisphere. The association between tonotopic map expansion and stuttering rate was evaluated using Pearson’s correlation coefficient.
2.3 Experiment 3: Voxel-based morphometry
2.3.1 Subjects
Fifteen men who stutter (mean age, 30 ± 5.8 years; range, 21–41 years) and 15 control male subjects (mean age, 30.8 ± 6.4 years; range, 22–43 years) participated in
this experiment. Thirteen PWS who participated in both experiments 1 and 2 also participated in this study. The other conditions were the same as those described for experiment 2.
2.3.2 Image processing
Three-dimensional volumetric T1-weighted MR images were obtained using a 1.5-T MRI scanner (Achieva Nova Dual; Philips Medical Systems, Best, Netherlands).
We used a field-echo three-dimensional sagittal pulse sequence with the following parameters: TR = 25 ms, TE = 4.6 ms, field of view = 230 mm, flip angle = 30°, matrix
= 240 × 240, and slice thickness = 1 mm. The images were obtained in the sagittal plane and were then reconstructed into 1-mm-thick contiguous transverse images.
2.3.3 Analysis
VBM was performed using the toolbox Diffeomorphic Anatomical Registration Through Exponential Lie algebra (DARTEL) of SPM8 (Wellcome Department of Imaging Neuroscience, London, UK). DARTEL is a suite of tools for achieving more accurate intersubject registration of brain images (Ashburner, 2007). DARTEL preprocessing includes 3 steps. The first step involves generating the roughly aligned gray matter (GM) images of the subjects by using “New Segment,” which can be used with an East Asian template, and was found to be more robust than the “Unified Segmentation” of SPM8. The second step involves determining the nonlinear deformations for warping all the GM images by using “Run DARTEL (create
Template)” so that they matched each other. The final step involves generating 8-mm smoothed and modulated normalized GM images with a voxel size of 1.5 × 1.5 × 1.5 mm by using “Normalise to MNI Space.”
Group comparisons were conducted using a two-sample t test with an absolute
threshold mask of 0.05. Whole brain data were analyzed using a height threshold of T = 3.26 (P < 0.001, uncorrected) because of small group sizes. Uncorrected VBM data were also adopted in the previous studies (Chang et al., 2008; Beal, et al., 2007; Kell et al., 2009).
3 Results
3.1 Experiment 1: Auditory sensory gating
In both groups, 2 successive clicks evoked a well-defined P50m response in the hemisphere contralateral to the stimulated ear (Fig. 1). Figure 1A shows the data from 70 channels around the sensor with a maximal amplitude of P50m in the left hemisphere.
Figures 1B and 1C show the representative waveforms of P50m in a normal control and a stuttering subject, respectively. The amplitude of S2-P50m was apparently smaller than that of S1-P50m in the control subjects; however, no such amplitude difference between S1-P50m and S2-P50m was evident in stuttering subjects.
Table 1 summarizes the dipole moments (Q1 and Q2), latency of S1-P50m and S2-P50m, and the Q2/Q1 ratio (mean ± SEM). MANOVA of the Q2/Q1 ratio revealed a significant group × hemisphere interaction [F(1, 31) = 4.209, p = 0.048]. As shown in Fig. 2A, the Q2/Q1 ratio for the left hemisphere was significantly smaller than that for the right hemisphere in the controls (p = 0.024). In contrast, there was no significant difference between hemispheres in PWS. The Q2/Q1 ratio for the left hemisphere in PWS was significantly larger than that in the controls (p = 0.014).
The right S1-P50m latency in PWS was significantly shorter than the left S1-P50m latency (p = 0.047); however, this was not the case for the controls. In each subject, P50m dipolar sources were located in the superior temporal gyrus (STG) close to Heschl’s gyrus, and there were no significant differences in the source locations between the 2 groups. Moreover, there was no significant correlation between the
Q2/Q1 ratio and stuttering rate or between the S1-P50m latencies and stuttering rate.
3.2 Experiment 2: Tonotopic organization
In both groups, an N100m response was clearly evoked by each tonal frequency in the hemisphere contralateral to the stimulated ear. Figure 3A shows the data from 70 channels around the sensor with a maximal amplitude of N100m, and Figures 3B and 3C show representative waveforms of N100m in a control and a stuttering subject, respectively. Figure 4 shows tonotopic arrangements superimposed on individual MR images in representative subjects of both groups. Table 2 summarizes the ECD locations of N100m (mean ± SEM). Tonotopic organization was observed in x (medial-lateral) and y (anterior-posterior) coordinates in which higher frequencies were arranged medially and posteriorly. Regarding the y coordinate, there was a significant main effect of frequency [F(2, 24) = 22.7, p < 0.001] and hemisphere [F(1, 25) = 35.1, p
< 0.001], which confirmed that there was a tonotopic organization with laterality.
Although the main effect of group was not significant [F(1, 25) = 1.45, p = 0.239], a significant interaction between group and hemisphere was found [F(1, 25) = 4.458, p = 0.022]. A post-hoc analysis revealed that there was a significant difference between the 2 groups on the right side (p = 0.039) but not in the left hemisphere. This indicates that the N100m in PWS is located more anteriorly than that in the controls (Fig. 5A). In both controls and PWS, the right N100m is located more anteriorly than the left N100m (p = 0.018 and p < 0.001, respectively). The interaction between group and frequency was also significant [F(2, 24) = 4.458, p = 0.022]. Post-hoc tests revealed that there was a significant difference among each frequency in PWS, whereas 250 Hz was not different from 1000 Hz in the controls.
The slope of the y axis regression line of the right hemisphere was considerably steeper for PWS than for the controls (p = 0.040) (Fig. 5B), indicating that the tonotopic
map in the right hemisphere of PWS was larger than that in the controls. The correlation between the tonotopic map expansion and the stuttering rate was, however, not
significant.
Regarding the x coordinate (medial-lateral axis), a significant main effect of frequency was found [F(2, 26) = 5.472, p = 0.01]; however, there was no significant difference between the 2 groups. Similarly, there was no significant difference between the 2 groups for the z coordinate.
For N100m latency, there were significant main effects of frequency [F(2, 26)
= 203, p < 0.001] and hemisphere [F(1, 27) = 6.635, p = 0.015]. The interaction between hemisphere and frequency was also significant [F(1, 27), p = 0.004]. Post-hoc analysis revealed that the latency at 250 Hz was significantly longer than that at 4000 Hz (p <
0.001) and 1000 Hz (p < 0.001). The N100m latency at 250 Hz in the left hemisphere was shorter than that in the right hemisphere (p < 0.001). No significant group
difference was observed. There was also a main effect of frequency on the N100m dipole moment strength (p < 0.001); however, there was no significant difference between the 2 groups.
3.3 Experiment 3: Voxel-based morphometry
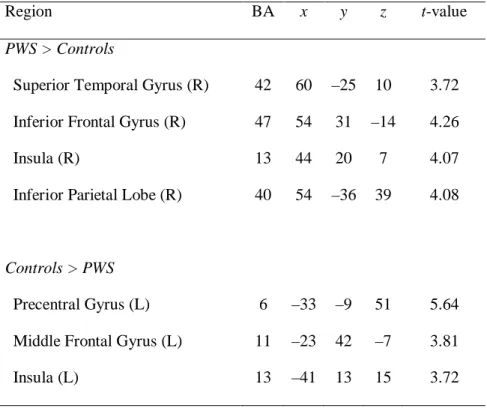
VBM analysis revealed 4 significant clusters of increased GM volume and 3 significant clusters of decreased GM volume in PWS (Table 3). Compared with the controls, PWS showed significant increases in GM volume in the right STG (BA42, Fig.
4C), right inferior frontal gyrus (BA47), right insula (BA13), and right supramarginal gyrus (BA40). Conversely, decreases in GM volume were observed in the left precentral gyrus, left middle frontal gyrus (L), and left insula (BA13). There was no significant decrease in GM volume in the left STG, left inferior frontal gyrus, medial frontal gyrus, and left supramarginal gyrus.
4 Discussion
We examined spatiotemporal signatures of the basic auditory system by using an auditory sensory gating paradigm and tonotopic maps with MEG and determined structural volumes by using VBM. The new findings of this study are summarized as impaired auditory sensory gating in the left hemisphere, functional map expansion of the right STG, and greater asymmetric tonotopic organization in PWS. We also found left-lateralized auditory sensory gating in normal controls.
4.1 PWS cannot “gate out”
Sensory gating involves the ability to both “gate in” relevant information and
“gate out” irrelevant information. A lack of P50m (or P50) suppression has been proposed as the index of abnormal auditory sensory gating (or “gate out”) in schizophrenia (Alder et al., 1982; Thoma et al., 2003; Hirano et al., 2010) and Alzheimer’s disease (Jessen et al., 2001). We first demonstrated the left hemispheric impairment of P50m suppression in PWS; this finding indicates that the normally present inhibitory mechanisms are markedly reduced in PWS and supports our working hypothesis that PWS cannot gate out ignorable auditory inputs, which lead to errors.
The observed P50m responses are located on both sides of the superior temporal gyri close to Heschl’s gyrus, consistent with the findings of previous studies in
non-stuttering subjects (Onitsuka et al., 2000; Lu et al., 2007; Hirano et al., 2008).
The phenomenon of sensory gating in PWS has previously been studied using EEG (Özcan et al., 2009). Özcan et al. (2009) examined the P50 suppression recorded from the vertex (Cz) and found no difference between PWS and controls. Auditory sensory gating in EEG is derived from at least 2 distinct generators, namely, the tangential component of the auditory cortex and the radial component of the frontal
cortex (Weisser et al., 2001; Korzyukov et al., 2007). Although scalp EEG is sensitive to both tangential and radial components of current sources in a spherical volume conductor, MEG detects only the tangential component. MEG therefore measures activity in the sulci selectively, whereas scalp EEG measures activity in both the sulci and at the top of the cortical gyri, but appears to be influenced to a greater extent by radial sources (Cohen and Cuffin, 1983). Thus, it is likely that the results of our MEG study differed from those of a previous EEG study of sensory gating in PWS (Özcan et al., 2009). Our study is notable in that unlike in the studies mentioned above, we found that auditory sensory gating in the left hemisphere is dysfunctional in PWS.
Interestingly, in the controls, the Q2/Q1 ratio for the left hemisphere was significantly smaller than that for the right hemisphere, which indicates that sensory gating in the left auditory cortex is more dominant than that in the right auditory cortex.
Such asymmetry in auditory sensory gating was not found in PWS. The left hemispheric specificity of gating in normal controls has not previously been reported. We suggest 3 possibilities that might explain this unexpected result. First, the left Q2/Q1 ratio in the controls in our study is almost comparable to that of previous MEG studies (Weiland et al., 2008; Hirano et al., 2010). Unlike the findings of previous studies, the left Q2/Q1 was also significantly lower than the right Q2/Q1 ratio; this finding can be attributed to binaural stimulation (Hirano et al., 2010; Lu et al., 2007; Hanlon et al., 2005; Thoma et al., 2003). The brain regions associated with language are left-sided in healthy
right-handers (Knecht et al., 2000). Thus, it is plausible that auditory sensory gating is left-lateralized. Second, we used strictly monaural stimulation for each ear separately so as not to induce cross-hearing. Most P50m suppression studies involve binaural
stimulations or stimulations at a high sound pressure level to induce cross-hearing (Thoma et al., 2003, 2004; Edgar et al., 2003, 2005; Lu et al., 2007; Weiland et al., 2008; Hirano et al., 2008, 2010). Third, since it is well known that P50 is affected by
vigilance (Cullum et al., 1993), we used silent movies to keep the subjects awake. Thus, the interhemispheric difference in auditory sensory gating in males could be evaluated more precisely in our study population.
4.2 Altered tonotopy in PWS
We first demonstrated expansion of the tonotopic representations in the right hemisphere of PWS. The auditory cortex is tonotopically organized in humans, such that higher frequencies are represented medially and posteriorly (Pantev et al., 1989, 1998b). When N100m dipole locations are plotted against the logarithm of frequency, they can be represented by a straight line (Pantev et al., 1995). The steeper the slope of this regression line, the more extended is the map of tonotopic representation (Elbert et al., 2002). Our results showed that the slope of the y-axis regression line of the right hemisphere was considerably steeper for PWS than for the controls, indicating that the tonotopic map of PWS was expanded in the right auditory cortex. The expansion of tonotopic representation could be ascribed to use-dependent cortical plasticity (Bakin and Weinberger, 1990; Elbert et al., 2002). Elbert et al. (2002) demonstrated auditory cortical plasticity attributable to expansion of the N100m tonotopic map in blind subjects who had to rely on nonvisual, primarily auditory, input. N100m tonotopic organizations have been generated from the secondary auditory cortex, which mirrored the tonotopic organization in the primary auditory cortex (Pantev et al., 1995). In a structural assessment using VBM, we demonstrated an increased volume of GM in the right STG near the N100m tonotopic organization. We also found that the N100m of the right hemisphere in PWS was more anterior than that in the controls, which could be related to the expansion of tonotopic representation. Taken together, these observations suggest that structural cortical plasticity could be induced in the right STG in PWS, which is in accordance with functional expansion of the tonotopic representation.
We found both functional and structural changes in the right STG. Kell et al.
(2009) showed functional overactivation in the right primary auditory cortex during speech. The following structural changes in the right auditory cortex have been reported in previous studies: reduced right-left asymmetry (Foundas et al., 2001), increased white matter (Jäncke et al., 2004), and alterations in the structure of the right-sided perisyvian region (Cykowski et al., 2008). To date, the relation between function and structure of the right auditory cortex is unclear, but our study revealed that the function of the right auditory cortex is related to structural changes.
Although there have been many VBM studies of PWS (Jäncke et al., 2004;
Beal et al., 2007; Chang et al., 2008; Kell et al., 2009; Lu et al., 2010), there exist considerable methodological differences among studies, and previous studies did not always reproduce the results of former studies. The results of our study did not replicate the changes of increased left STG (Beal et al., 2007). However, Lu et al. (2010) found that the GM volume in the left STG in PWS was lower than that in the controls.
Therefore, it is evident that no reproducible changes in the left STG were found in PWS.
Chang et al. (2008) did not report lateralized decreased GM volume; however, Kell et al.
(2009) found left-lateralized decrease in GM volume (e.g., inferior frontal gyrus, medial temporal gyrus, and supramarginal gyrus) in PWS but no increase in GM volume in the right hemisphere. Thus, our VBM results are partly consistent with those of Kell et al.
(2009).
4.3 Defect of auditory-motor integration
We have demonstrated the left hemispheric impairment of P50m suppression in PWS. This indicates that PWS cannot gate out ignorable auditory inputs, which in turn cause auditory error signals. Since the P50m suppression paradigm was inattention and an early response of 50-ms latency without cognition, auditory sensory gating is
believed to work automatically. Auditory error signals from impaired auditory sensory gating could cause abnormal auditory feedback. Max et al. (2004) assumed that stuttering would derive from a mismatch between predicted motor commands
(feedforward) and auditory and somatosensory (feedback) consequences of the executed movements (speech). This mismatch could result in an increased need for
feedback-based corrections but would make worse by abnormal auditory feedback.
Chang et al. (2009) demonstrated that PWS had less activation than controls in the left STG but greater activation in the right STG. Kell et al. (2009) inferred that the compensatory effect of auditory feedback integration in the motor program is
manifested via right auditory cortex activation. If defects in left auditory sensory gating induce some errors during auditory inputs in the left STG, PWS should show reduced auditory inputs in the left hemisphere and compensate by increasing auditory inputs from the right hemisphere. Increased auditory inputs from the right hemisphere could result in expansion of the tonotopic map. The expansion of tonotopic organization can occur under conditions of use-dependent plasticity, as seen in musicians (Pantev et al., 1998a, 2001; Gaser and Schlaug, 2003) and blind subjects (Elbert et al., 2002). The expansion of the tonotopic map could increase GM volume in the right STG. Cortical thickness can increase to compensate for impaired brain function. For example, an increase in cortical thickness was observed in the ipsilateral sensorimotor cortex of chronic stroke patients with subcortical lesions (Schaechter et al. 2006). Close functional coupling between the right and left auditory cortices is well known
(Brancucci et al., 2005; Mukamel et al., 2005). Therefore, we consider the defect of left auditory sensory gating as one of the causes underlying an increase in the volume of the right auditory cortex. Taken together, we believe that the defective auditory-motor integration is the neural basis of stuttering.
5 Conclusions
Our study demonstrated that the disturbed auditory sensory gating in the left hemisphere is an electrophysiological signature of stuttering, which reflects an inability of PWS to gate out unnecessary auditory information and the consequent stuttering. We also indicated an increase in GM in the right auditory cortex corresponding to the expansion of tonotopic organization. Our findings further suggest that altered auditory information processing provides a clue about stuttering pathophysiology.
Acknowledgements
This work was supported by a Grant-in-Aid for Japan Society for the Promotion of Science (JSPS) Fellows (Y. K.) and by a Grant-in-Aid for Young Scientists (B) (K. O.).
References
Adler, L.E., Pachtman, E., Franks, R.D., Pecevich, M., Waldo, M.C., Freedman, R., 1982. Neurophysiological evidence for a defect in neuronal mechanisms involved in sensory gating in schizophrenia. Biol. Psychiatr. 17, 639-654.
Altrows, I.F. and Bryden, M.P., 1977. Temporal factors in the effects of masking noise on fluency of stutterers. J.Commun.Disord. 10, 315-329.
Ashburner, J., 2007. A fast diffeomorphic image registration algorithm. Neuroimage 38, 95-113.
Bakin, J.S. and Weinberger, N.M., 1990. Classical conditioning induces CS-specific receptive field plasticity in the auditory cortex of the guinea pig. Brain Res. 536, 271-286.
Beal, D.S., Cheyne, D.O., Gracco, V.L., Quraan, M.A., Taylor, M.J., De Nil, L.F., 2010.
Auditory evoked fields to vocalization during passive listening and active generation in adults who stutter. Neuroimage 52, 1645-1653.
Beal, D.S., Gracco, V.L., Lafaille, S.J., De Nil, L.F., 2007. Voxel-based morphometry of auditory and speech-related cortex in stutterers. Neuroreport 18, 1257-1260.
Brancucci, A., Babiloni, C., Vecchio, F., Galderisi, S., Mucci, A., Tecchio, F., Romani, G.L., Rossini, P.M., 2005. Decrease of functional coupling between left and right auditory cortices during dichotic listening: an electroencephalography study.
Neuroscience 136, 323-332.
Chang, S., Erickson, K.I., Ambrose, N.G., Hasegawa-Johnson, M.A., Ludlow, C.L., 2008. Brain anatomy differences in childhood stuttering. Neuroimage 39, 1333-1344.
Chang, S., Kenney, M.K., Loucks, T.M., Ludlow, C.L., 2009. Brain activation abnormalities during speech and non-speech in stuttering speakers. NeuroImage 46 201-212.
Cohen, D. and Cuffin, B.N., 1983. Demonstration of useful differences between magnetoencephalogram and electroencephalogram. Electroencephalogr. Clin.
Neurophysiol. 56, 38-51.
Conture, E., 2001. Stuttering: Its nature, diagnosis and treatment. Needham Heights, MA: Allyn & Bacon.
Cullum, C.M., Harris, J.G., Waldo, M.C., Smernoff, E., Madison, A., Nagamoto, H.T., Griffith, J., Adler, L.E., Freedman, R., 1993. Neurophysiological and neuropsychological evidence for attentional dysfunction in schizophrenia.
Schizophr. Res. 10, 131-141.
Cykowski, M.D., Fox, P.T., Ingham, R.J., Ingham, J.C., Robin, D.A., 2010. A study of the reproducibility and etiology of diffusion anisotropy differences in developmental stuttering: a potential role for impaired myelination. Neuroimage 52, 1495-1504.
Cykowski, M.D., Kochunov, P.V., Ingham, R.J., Ingham, J.C., Mangin, J.F., Riviere, D., Lancaster, J.L., Fox, P.T., 2008. Perisylvian sulcal morphology and cerebral asymmetry patterns in adults who stutter. Cereb.Cortex 18, 571-583.
Decker, T.N., Healey, E.C., Howe, S.W., 1982. Brainstem auditory electrical response characteristics of stutterers and nonstutterers : A preliminary report. J. Fluency Disord. 7, 385-401.
De Nil, L.F., Kroll, R.M., Lafaille, S.J., Houle, S., 2003. A positron emission tomography study of short- and long-term treatment effects on functional brain activation in adults who stutter. J. Fluency Disord. 28, 357-80.
Edgar, J.C., Huang, M.X., Weisend, M.P., Sherwood, A., Miller, G.A., Adler, L.E., Canive, J.M., 2003. Interpreting abnormality: an EEG and MEG study of P50 and the auditory paired-stimulus paradigm. Biol. Psychol. 65, 1-20.
Edgar, J.C., Miller, G.A., Moses, S.N., Thoma, R.J., Huang, M.X., Hanlon, F.M.,
Weisend, M.P., Sherwood, A., Bustillo, J., Adler, L.E., et al., 2005. Cross-modal generality of the gating deficit. Psychophysiology 42, 318-327.
Elbert, T., Sterr, A., Rockstroh, B., Pantev, C., Muller, M.M., Taub, E., 2002. Expansion of the tonotopic area in the auditory cortex of the blind. J. Neurosci. 22, 9941-9944.
Foundas, A.L., Bollich, A.M., Corey, D.M., Hurley, M., Heilman, K.M., 2001.
Anomalous anatomy of speech-language areas in adults with persistent developmental stuttering. Neurology 57, 207-215.
Gaser, C. and Schlaug, G., 2003. Brain structures differ between musicians and non-musicians. J. Neurosci. 23, 9240-9245.
Giraud, A.L., Neumann, K., Bachoud-Levi, A.C., von Gudenberg, A.W., Euler, H.A., Lanfermann, H., Preibisch, C., 2008. Severity of dysfluency correlates with basal ganglia activity in persistent developmental stuttering. Brain Lang. 104, 190-199.
Hanlon, F.M., Miller, G.A., Thoma, R.J., Irwin, J., Jones, A., Moses, S.N., et al., 2005.
Distinct M50 and M100 auditory gating deficits in schizophrenia.
Psychophysiology 42, 417-427.
Hämäläinen, M., Hari, R., Ilmoniemi, R.J., Knuutila, J., Lounasmaa, O.V., 1993.
Magnetoencephalography-Theory, instrumentation, and applications to noninvasive studies of the working human brain. Rev. Mod. Phys. 65, 413-497.
Hampton, A. and Weber-Fox, C., 2008. Non-linguistic auditory processing in stuttering:
evidence from behavior and event-related brain potentials. J. Fluency Disord. 33, 253-273.
Hirano, Y., Hirano, S., Maekawa, T., Obayashi, C., Oribe, N., Monji, A., Kasai, K., Kanba, S., Onitsuka, T., 2010. Auditory gating deficit to human voices in schizophrenia: A MEG study. Schizophr. Res. 117, 61-67.
Hirano, Y., Onitsuka, T., Kuroki, T., Matsuki, Y., Hirano, S., Maekawa, T., Kanba, S., 2008. Auditory sensory gating to the human voice: a preliminary MEG study.
Psychiatr. Res. 163, 260-269.
Jäncke, L., Hanggi, J., Steinmetz, H., 2004. Morphological brain differences between adult stutterers and non-stutterers. BMC Neurol. 4, 23.
Jessen, F., Kucharski, C., Fries, T., Papassotiropoulos, A., Hoenig, K., Maier, W., Heun, R., 2001. Sensory gating deficit expressed by a disturbed suppression of the P50 event-related potential in patients with Alzheimer's disease. Am. J. Psychiatr. 158, 1319-1321.
Jones, M., Onslow, M., Packman, A., Williams, S., Ormond, T., Schwarz, I., et al., 2005.
Randomised controlled trial of the Lidcombe programme of early stuttering intervention. BMJ 331, 659-661.
Jones, M., Onslow, M., Harrison, E., Packman, A., 2000. Treating stuttering in young children: predicting treatment time in the Lidcombe Program. J. Speech Hear. Res.
43, 1440-1450.
Kalinowski, J., Armson, J., Roland-Mieszkowski, M., Stuart, A., Gracco, V.L., 1993.
Effects of alterations in auditory feedback and speech rate on stuttering frequency.
Lang. Speech 36, 1-16.
Kell, C.A., Neumann, K., von Kriegstein, K., Posenenske, C., von Gudenberg, A.W., Euler, H., Giraud, A.L., 2009. How the brain repairs stuttering. Brain 132, 2747-2760.
Knecht, S., Deppe, M., Drager, B., Bobe, L., Lohmann, H., Ringelstein, E., Henningsen, H., 2000. Language lateralization in healthy right-handers. Brain 123 ( Pt 1), 74-81.
Korzyukov, O., Pflieger, M.E., Wagner, M., Bowyer, S.M., Rosburg, T., Sundaresan, K., Elger, C.E., Boutros, N.N., 2007. Generators of the intracranial P50 response in auditory sensory gating. Neuroimage 35, 814-826.
Lincoln, M., Packman, A., Onslow, M., 2006. Altered auditory feedback and the treatment of stuttering: a review. J. Fluency Disord. 31, 71-89.
Lu, B.Y., Edgar, J.C., Jones, A.P., Smith, A.K., Huang, M.X., Miller, G.A., Canive, J.M., 2007. Improved test-retest reliability of 50-ms paired-click auditory gating using magnetoencephalography source modeling. Psychophysiology 44, 86-90.
Lu, C., Peng, D., Chen, C., Ning, N., Ding, G., Li, K., Yang, Y., Lin, C., 2010. Altered effective connectivity and anomalous anatomy in the basal ganglia-thalamocortical circuit of stuttering speakers. Cortex 46, 49-67.
Max, L., Guenther, F.H., Gracco, V.L., Ghosh, S.S., &Wallace, M.E., 2004. Unstable or Insufficiently Activated Internal models and feedback-biased motor control as sources of dysfluency: A theoretical model of stuttering. Contemp. Issues Commun.
Sci. Disord. 31, 105-122.
Medvedovsky, M., Taulu, S., Bikmullina, R., Paetau, R., 2007. Artifact and head movement compensation in MEG. Neurol. Neurophysiol. Neurosci. 4, 1-10.
Mukamel, R., Gelbard, H., Arieli, A., Hasson, U., Fried, I., Malach, R., 2005. Coupling between neuronal firing, field potentials, and FMRI in human auditory cortex.
Science 309, 951-954.
Naka, D., Kakigi, R., Hoshiyama, M., Yamasaki, H., Okusa, T., Koyama, S., 1999.
Structure of the auditory evoked magnetic fields during sleep. Neuroscience 93, 573-583.
Neumann, K., Preibisch, C., Euler, H.A., von Gudenberg, A.W., Lanfermann, H., Gall, V., Giraud, A.L., 2005. Cortical plasticity associated with stuttering therapy. J.
Fluency Disord. 30, 23-39.
Newman, P.W., Bunderson, K. and Brey, R. H., 1985. Brain stem electrical responses of stutterers and normals by sex, ears, and recovery. J. Fluency Disord. 10, 59-67.
Oldfield, R.C., 1971. Assessment and Analysis of Handedness - Edinburgh Inventory.
Neuropsychologia 9, 97-113
Onitsuka, T., Ninomiya, H., Sato, E., Yamamoto, T., Tashiro, N., 2000. The effect of
interstimulus intervals and between-block rests on the auditory evoked potential and magnetic field: is the auditory P50 in humans an overlapping potential? Clin.
Neurophysiol. 111, 237-245.
Onslow, M., Andrews, C., Lincoln, M., 1994. A control/experimental trial of an operant treatment for early stuttering. J. Speech Hear. Res. 37,1244-1259.
Özcan, Ö., Altınayar, S., Özcan, C., Ünal, S., Karlıdağ, R., 2009. P50 sensory gating in children and adolescents with developmental stuttering. Bull. Clin Psychoph. 19, 241-246
Pantev, C., Bertrand, O., Eulitz, C., Verkindt, C., Hampson, S., Schuierer, G., Elbert, T., 1995. Specific Tonotopic Organizations of Different Areas of the Human Auditory-Cortex Revealed by Simultaneous Magnetic and Electric Recordings.
Electroencephalogr. clin. Neurophysiol. 94, 26-40.
Pantev, C., Hoke, M., Lutkenhoner, B., Lehnertz, K., 1989. Tonotopic Organization of the Auditory-Cortex - Pitch Versus Frequency Representation. Science 246, 486-488.
Pantev, C., Lutkenhoner, B., Hoke, M., Lehnertz, K., 1986. Comparison between simultaneously recorded auditory-evoked magnetic fields and potentials elicited by ipsilateral, contralateral and binaural tone burst stimulation. Audiology 25, 54-61.
Pantev, C., Oostenveld, R., Engelien, A., Ross, B., Roberts, L.E., Hoke, M., 1998a.
Increased auditory cortical representation in musicians. Nature 392, 811-814.
Pantev, C., Ross, B., Berg, P., Elbert, T., Rockstroh, B., 1998b. Study of the human auditory cortices using a whole-head magnetometer: Left vs. right hemisphere and ipsilateral vs. contralateral stimulation. Audiol. Neurootol. 3, 183-190.
Postma, A. and Kolk, H., 1992. Error monitoring in people who stutter: evidence against auditory feedback defect theories. J.Speech Hear.Res. 35, 1024-1032.
Postma, A. and Kolk, H., 1993. The covert repair hypothesis: prearticulatory repair
processes in normal and stuttered disfluencies. J.Speech Hear.Res. 36, 472-487.
Postma, A., 2000. Detection of errors during speech production: A review of speech monitoring models. Cognition 77, 97-132
Rojas, D.C., Bawn, S.D., Carlson, J.P., Arciniegas, D.B., Teale, P.D., Reite, M.L., 2002.
Alterations in tonotopy and auditory cerebral asymmetry in schizophrenia. Biol.
Psychiatr. 52, 32-39.
Salmelin, R., Schnitzler, A., Schmitz, F., Jancke, L., Witte, O.W., Freund, H.J., 1998.
Functional organization of the auditory cortex is different in stutterers and fluent speakers. Neuroreport 9, 2225-2229.
Schaechter, J.D., Moore, C.I., Connell, B.D., Rosen, B.R., Dijkhuizen, R.M., 2006.
Structural and functional plasticity in the somatosensory cortex of chronic stroke patients. Brain 129, 2722-2733.
Sommer, M., Koch, M.A., Paulus, W., Weiller, C., Buchel, C., 2002. Disconnection of speech-relevant brain areas in persistent developmental stuttering. Lancet 360, 380-383.
Stager, S.V., 1990. Heterogeneity in stuttering: Results from auditory brainstem response testing. J. Fluency Disord. 15, 9–19.
Taulu, S., Simola, J., Kajola, M., 2005. Applications of the signal space separation method. IEEE Trans. Signal Process. 53, 3359–3372.
Taulu, S., Simola, J., Kajola, M., 2004. MEG recordings of DC fields using the signal space separation method (SSS). Neurol.Clin.Neurophysiol. 35, 1-4
Thoma, R.J., Hanlon, F.M., Moses, S.N., Edgar, J.C., Huang, M., Weisend, M.P., Irwin, J., Sherwood, A., Paulson, K., Bustillo, J., et al., 2003. Lateralization of auditory sensory gating and neuropsychological dysfunction in schizophrenia. Am. J.
Psychiatr. 160, 1595-1605.
Thoma, R.J., Hanlon, F.M., Sanchez, N., Weisend, M.P., Huang, M., Jones, A., Miller,
G.A., Canive, J.M., 2004. Auditory sensory gating deficit and cortical thickness in schizophrenia. Neurol. Clin. Neurophysiol. 62, 1-7
Thoma, R.J., Hanlon, F.M., Petropoulos, H., Miller, G.A., Moses, S.N., Smith, A., Parks, L., Lundy, S.L., Sanchez, N.M., Jones, A., et al., 2008. Schizophrenia diagnosis and anterior hippocampal volume make separate contributions to sensory gating.
Psychophysiology 45, 926-935.
Watkins, K.E., Smith, S.M., Davis, S., Howell, P., 2008. Structural and functional abnormalities of the motor system in developmental stuttering. Brain 131, 50-59.
Weiland, B.J., Boutros, N.N., Moran, J.M., Tepley, N., Bowyer, S.M., 2008. Evidence for a frontal cortex role in both auditory and somatosensory habituation: a MEG study. Neuroimage 42, 827-835.
Weisser, R., Weisbrod, M., Roehrig, M., Rupp, A., Schroeder, J., Scherg, M., 2001. Is frontal lobe involved in the generation of auditory evoked P50? Neuroreport 12, 3303-3307.
Figure legends
Figure 1: The source of the P50m response estimated by MEG. Seventy channels around the P50m peak in the left hemisphere (encircled) were used to fit a single dipole source (A). Single-channel response and root mean squares (RMS) over the selected channels in a representative control subject. The response to S2 is apparently smaller than that to S1 (B). The response to S2 is only slightly smaller than that to S1 in a representative stuttering subject (C).
Figure 2: (A) P50m auditory sensory gating ratios (Q2/Q1) in controls and PWS in the left and right hemispheres. The left gating ratio in PWS is significantly larger than that in the controls. The left gating ratio in controls is significantly smaller than the right gating ratio. (B) P50m latency in controls and PWS in the left and right hemispheres.
The right S1 latency is significantly shorter than the left S1 latency in PWS. Error bars represent SEM. * p < 0.05
Figure 3: Source of the N100m response estimated by MEG. Seventy channels around the N100m peak in the right hemisphere (encircled) were used to fit a single dipole source (A). Single-channel response and RMS over the selected channels in a representative control (B) and a representative stuttering (C) subject. No significant difference was observed between the N100m dipole moments of the 2 groups.
Figure 4: N100m sources for 3 tonal frequencies overlaid on MRI in the same control (A) and stuttering (B) subjects. Note that tonotopic organization in the right but not in the left hemisphere is enlarged in the stuttering subject (see right enlarged image). In the VBM result (C), the red patches in the right STG show statistically more significant increments in PWS than in controls and are overlaid onto a standard T1 template in
MRIcron (http://www.sph.sc.edu/comd/rorden/mricron/).
Figure 5: Source locations along the y axis (anterior-posterior) as a function of stimulus frequency (mean ± SEM) (A). There is a significant difference between PWS and controls in the right hemisphere. The sources of higher frequencies are located more posteriorly as a tonotopic arrangement. The regression coefficient of the y axis in each group (B). The tonotopic map for PWS was larger than that for controls on the right side.
* p < 0.05, ** p < 0.01
Table 1. The mean latency (ms) and dipole moment (nAm) of S1 and S2 and the Q2/Q1 ratio of P50m.
PWS Controls
Left Right Left Right
S1 Dipole moment (Q1) 15.3 ± 2.9 19 ± 2.4 15.6 ± 2.0 16.3 ± 1.9
S1 Latency 46.7 ± 2.0 42.6 ± 1.5 47.1 ± 1.1 44.3 ± 1.0
S2 Dipole moment (Q2) 12.9 ± 2.3 14.6 ± 1.9 9.8 ± 1.1 13 ± 1.5
S2 Latency 44.9 ± 1.8 43.5 ± 1.4 44.5 ± 1.4 45.1 ± 1.4
Q2/Q1 0.87 ± 0.08 0.81 ± 0.08 0.64 ± 0.04 0.86 ± 0.09
Values are expressed as mean ± SEM in this table and in Table 2.
Table 2. The 3D mean source locations of N100m (mm)
Frequency Dimension PWS Controls
Left Right Left Right
250 Hz x –54.8 ± 1 52.5 ± 1.2 –52.5 ± 1.3 53 ± 0.7
y 5.8 ± 1.6 13.6 ± 2 4.9 ± 1.3 7.4 ± 1.4
z 53.3 ± 2.4 49.5 ± 2 56.4 ± 1.2 53.2 ± 1.6
1000 Hz x –54 ± 0.7 50.7 ± 1.1 –51.8 ± 1.3 52.7 ± 0.8
y 4.4 ± 2.3 12.5 ± 1.7 4.4 ± 1.4 8.5 ± 1.3
z 51.8 ± 2.3 49.8 ± 1.7 55.9 ± 1.4 52.8 ± 1.4
4000 Hz x –51.6 ± 1.3 50.3 ± 1.2 –48.9 ± 1.6 52.4 ± 0.9
y 1.8 ± 2.4 9.1 ± 1.9 1.8 ± 1.3 6.5 ± 1.2
z 52.1 ± 2.3 50.3 ± 1.8 54.7 ± 1.2 53.6 ± 1.4
x: medial-lateral, y: anterior-posterior, z: superior-inferior.
Table 3. Regions, coordinates, and t-statistics of significantly different gray matter voxels in VBM.
Region BA x y z t-value
PWS > Controls
Superior Temporal Gyrus (R) 42 60 –25 10 3.72 Inferior Frontal Gyrus (R) 47 54 31 –14 4.26
Insula (R) 13 44 20 7 4.07
Inferior Parietal Lobe (R) 40 54 –36 39 4.08
Controls > PWS
Precentral Gyrus (L) 6 –33 –9 51 5.64
Middle Frontal Gyrus (L) 11 –23 42 –7 3.81
Insula (L) 13 –41 13 15 3.72
x, y, and z represent medial-lateral, anterior-posterior, and superior-inferior axes, respectively.