九州大学学術情報リポジトリ
Kyushu University Institutional Repository
Dynamical and Structural Analysis of Archaeal Oligosaccharyltransferase Using High-speed AFM and Electron Microscopy
川﨑, 由貴
http://hdl.handle.net/2324/4474955
出版情報:九州大学, 2020, 博士(システム生命科学), 課程博士 バージョン:
権利関係:
Dynamical and Structural Analysis of Archaeal Oligosaccharyltransferase
Using High-speed AFM and Electron Microscopy
by
Yuki Kawasaki A DISSERTATION
Submitted in partial fulfillment of the requirements for the degree DOCTOR OF PHILOSOPHY (Ph.D.) IN SYSTEM LIFE SCIENCES
Graduate School of Systems Life Sciences
KYUSHU UNIVERSITY Fukuoka, Japan
Feb 2021
Supervised by:
Professor Daisuke Kohda
Table of Contents
Acknowledgements ... iii
Publication ... iv
Abbreviations used in this thesis ... v
Abstract ... vi
Chapter1. Introduction ... 1
1.1. N-glycosylation ... 1
1.2. Structural biology of oligosaccharyltransferase ... 3
1.3. High-speed AFM ... 4
1.4. Solubilization methods for structural and dynamical analysis of membrane proteins ... 6
1.5. Motivation and outline of my research ... 8
Chapter 2. Two-state Exchange Dynamics in Membrane-Embedded Oligosaccharyltransferase Observed in Real-Time by High-Speed AFM ... 9
2.1 Materials and Methods ... 9
2.1.1. Expression, purification, and biotinylation of AfAglB ... 9
2.1.2. Oriented reconstitution of AfAglB in a lipid bilayer on the 2D tamavidin crystal ... 10
2.1.3. HS-AFM observation ... 11
2.1.4. Purification of AfLLO ... 12
2.1.5. Incorporation of LLO into an AfAglB-embedded lipid bilayer on the AFM sample stage ... 12
2.1.6. Preparation of NMR samples ... 13
2.1.7. NMR Spectroscopy ... 14
2.1.8. Modeling the state 2 structure of AfAglB ... 14
2.2 Results ... 16
2.2.1. Oriented reconstitution of AfAglB in a lipid bilayer for HS-AFM measurement ... 16
2.2.2. Two-state conformational exchange of AfAglB revealed by HS-AFM ... 19
2.2.3. Survival plots for the estimation of the exchange rates ... 22
2.2.4. LLO binding shifts the conformational equilibrium of AfAglB ... 25
2.2.5. NMR evidence for the two conformational states of AfAglB ... 27
2.3 Discussion ... 32
Chapter3. Single Particle Analysis of Archaeal Oligosaccharyltransferase ... 39
3.1 Materials and Methods ... 39
3.1.1. Preparation of AfAglB in the complex with Amphipol ... 39
3.1.2. Expression and purification of MSP1D1 ... 39
3.1.3. Reconstitution of AfAglB in nanodiscs ... 40
3.1.4. OST assay of AfAglB embedded in nanodiscs ... 40
3.1.5. Negative-staining electron microscopy ... 41
3.1.6. Single particle analysis ... 41
3.1.7. Visualization and segmentation of the 3D EM map and flexible fitting ... 41
3.1.8. Cryo-electron microscopic analysis of AfAglB in nanodiscs ... 42
3.2 Results ... 43
3.2.1. Single particle analysis of AfAglB trapped in Amphipol ... 43
3.2.2. Single particle analysis of AfAglB embedded in nanodiscs ... 45
3.3 Discussion ... 51
Chapter4. Overall discussion ... 55
References ... 58
Acknowledgements
I would like to express my sincere gratitude to Professor Daisuke Kohda (Kyushu University) for his cordial guidance, valuable discussion, and kind encouragement throughout the study.
I especially thank Dr. Kouta Mayanagi (assistant professor) for the technical support of electron microscopy single particle analysis. I also thank Dr. Daisuke Fujinami for his technical support of NMR experiments and HS-AFM measurements, Mr. Hajime Motomura for computer analysis of the HS-AFM data, and Ms. Maki Mitani for the oligosaccharyl transfer assay of the AfAglB* mutant. I thank Dr. Yuya Taguchi, Dr.
Takahiro Yamasaki, and Mr. Yuki Nakamura for teaching me various biological experiments. I really thank Ms. Miki Otsu for supporting my graduate school life. I would also like to thank all present and previous members in the structural biology laboratory, Dr. Atsushi Shimada (associate professor), Ms. Marie Ishikawa, Ms. Siqin Bala, Ms. Xiling Han, Ms. Miho Takeuchi, Mr. Seiichiro Hayashi, Dr. Takenori Nitta, Dr. Shunsuke Matsumoto, Dr. Sam-Geun Kong, Dr. Hiromi Ogino, Dr. Rei Matsuoka, Mr. Shigekazu Koya, and Mr. Takashi Yukimura for their kind advice and friendship.
I am very grateful to Drs. Hirotaka Ariyama, Noriyuki Kodera, Daisuke Noshiro, and Professor Toshio Ando (Kanazawa University) for their valuable technical assistance for the HS-AFM measurements, and Dr. Ashutosh Srivastava and Professor Florence Tama (Nagoya University) for the flexible fitting calculations. I thank the members of the Laboratory for Technical Support, Medical Institute of Bioregulation, Kyushu University, for DNA sequencing.
I am also grateful to the Suntory Foundation for Life Sciences for promoting my Ph.D.
study by the financial support.
Finally, I am great thankful to all my family and friends for their kind supports throughout my study.
Publication
Much of this thesis work has been published in the paper (Kawasaki et al., 2020) below, and represents the joint work and various contributions of the coauthors of the paper.
Kawasaki Y, Ariyama H, Motomura H, Fujinami D, Noshiro D, Ando T, Kohda D.
Two-State Exchange Dynamics in Membrane-Embedded Oligosaccharyltransferase Observed in Real-Time by High-Speed AFM.
J Mol Biol. 2020 Nov 6;432(22):5951-5965.
doi: 10.1016/j.jmb.2020.09.017.
Epub 2020 Sep 30. PMID: 33010307.
The negative staining 3D EM maps of AfAglB were deposited in the EMDB, with entries EMD-9858 (in nanodiscs) and EMD-9859 (in Amphipol).
Abbreviations used in this thesis
AfAglB, Archaeoglobus fulgidus AglB
AfAglB*, methionine-depleted AfAglB mutant AFM, atomic force microscopy
AglB, archaeal glycosylation B ClPglB, Campylobacter lari PglB
CMW, a mixture of chloroform, methanol, and water cryo-EM, cryo-electron microscopy
CTF, Contrast Transfer Function DC, direct constraint
DC-ENM, direct constraint-ENM DDM, n-dodecyl-β-D-maltopyranoside
DOPC, 1,2-dioleoyl-sn-glycero-3-phosphocholine DOPE, 1,2-dioleoyl-sn-glycero-3-phosphoethanolamine DPPC, Dipalmitoyl L-α-phosphatidylcholine
DTT, 1,4-dithiothreitol EL5, external loop 5 EM, electron microscopy ENM, elastic network model
HMQC,heteronuclear multiple quantum correlation spectroscopy HS-AFM, high-speed AFM
HSQC,heteronuclear single-quantum correlation spectroscopy IPTG, isopropyl β-D-1-thiogalactopyranoside
LLO, lipid-linked oligosaccharide MD, molecular dynamics
MSP, membrane scaffold protein OST, oligosaccharyltransferase PEG, polyethylene glycol PglB, protein glycosylation B
Stt3, staurosporine and temperature sensitivity 3 SUMO,small ubiquitin-like modifier
TAMRA, 5/6-carboxytetramethylrhodamine
Abstract
Oligosaccharyltransferase (OST) is a membrane-bound enzyme that catalyzes the transfer of oligosaccharide chains from lipid-linked oligosaccharides (LLO) to asparagine residues in polypeptide chains.
Using high-speed atomic force microscopy (AFM), I investigated the dynamic properties of OST molecules embedded in biomembranes. An archaeal single-subunit OST protein was immobilized on a mica support via biotin-avidin interactions and reconstituted in a lipid bilayer. The distance between the top of the protein molecule and the upper surface of the lipid bilayer was monitored in real-time. The height of the extramembranous part exhibited a two-step variation with a difference of 1.8 nm. The high and low states are designated as state 1 and state 2, respectively. The transition processes between the two states fit well to single exponential functions, suggesting that the observed dynamic exchange is an intrinsic property of the archaeal OST protein.
The two sets of cross peaks in the NMR spectra of the protein supported the conformational changes between the two states in detergent-solubilized conditions.
Considering the height values measured in the AFM measurements, state 1 is closer to the crystal structure, and state 2 has a more compact form. Subsequent AFM experiments indicated that the binding of the sugar donor LLO decreased the structural fluctuation and shifted the equilibrium almost completely to state 1. This dynamic behavior is likely necessary for efficient catalytic turnover. Presumably, state 2 facilitates the immediate release of the bulky glycosylated polypeptide product, thus allowing OST to quickly prepare for the next catalytic cycle.
I also conducted the structural analysis of archaeal OST trapped in Amphipol and embedded in nanodiscs using electron microscopy. Single particle analysis revealed that the archaeal OST in Amphipol had a similar structure to the crystal structure, whereas the archaeal OST embedded in nanodiscs adopted a more open conformation. The latter conformation is different from the two states observed in the HS-AFM analysis.
The dynamical analysis with HS-AFM and NMR and the structural analysis with electron microscopy consistently indicated that the relative orientation between the N-terminal transmembrane region and the C-terminal globular domain is highly plastic.
The dynamic feature of the conformational changes between the two domains would be important for the oligosaccharyl transfer activity of OST.
Chapter 1. Introduction 1.1. N-glycosylation
Asparagine-linked glycosylation (N-glycosylation) is an essential posttranslational protein modification conserved in all domains of life [1–4]. The 14-residue canonical N-oligosaccharide structure, Glc3Man9GlcNAc2-Asn, and its shorter forms are widely conserved in Eukarya [5,6]. In contrast, the N-oligosaccharide structures are quite diverse in Archaea and Eubacteria [7–9]. The N-linked oligosaccharides on proteins play essential roles in glycoprotein folding, quality control, sorting, secretion, and degradation [5,10,11]. Oligosaccharyltransferase (OST, OTase) catalyzes the transfer of oligosaccharides onto the asparagine residues in the consensus sequences (NXS or NXT, where X≠P, referred to as sequons) in a polypeptide chain (Fig. 1-1a) [12]. Most eukaryotic OST enzymes are multi-subunit protein complexes, consisting of four to nine non-identical subunits, but lower eukaryotic protozoan OSTs and prokaryotic (i.e., archaeal and eubacterial) OSTs are single-subunit enzymes [13,14]. The catalytic subunit of the OST enzyme is referred to as differently in the three domains of life: Stt3 (staurosporine and temperature sensitivity 3) in Eukarya, AglB (archaeal glycosylation B) in Archaea, and PglB (protein glycosylation B) in Eubacteria. The oligosaccharide donor is a glycophospholipid, commonly termed a lipid-linked oligosaccharide (LLO).
In LLO biosynthesis, several sugar residues are assembled sequentially on a lipid-phospho carrier [1,15], which is dolichol diphosphate in Eukarya and polyprenol diphosphate in Eubacteria. In contrast, Archaea have two types of carriers with different numbers of phosphate groups. The phylum Crenarchaeota and probably other modern phyla in the TACK superphylum use dolichol diphosphate, as in Eukarya, but the ancient phylum Euryarchaeota exceptionally uses dolichol monophosphate [16–18].
Since these LLOs are synthesized in membranes and remain embedded, OST is a membrane protein enzyme located in the endoplasmic reticulum membranes of eukaryotic cells and the plasma membranes of prokaryotic cells.
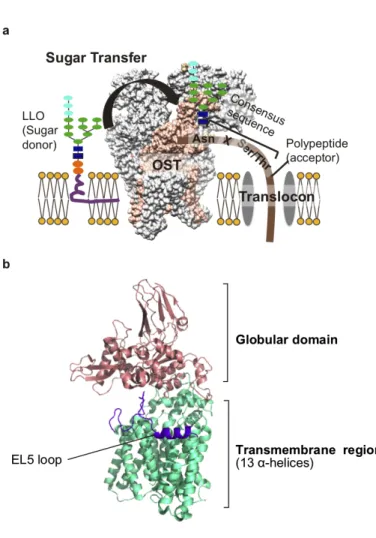
Figure 1-1. N-glycosylation and the crystal structure of AfAglB
(a) Oligosaccharyl transfer reaction in Eukaryotes. OST catalyzes the oligosaccharyl transfer reaction.
(b) The crystal structure of AfAglB (PDB: 3wak). The structure consists of the C-terminal globular domain and the N-terminal transmembrane region consisting of 13 transmembrane α-helices.
1.2. Structural biology of oligosaccharyltransferase
Over the past ten years, remarkable progress has been made in the structural understanding of the OST enzymes [14,19]. The first crystal structure of the full-length PglB protein from Campylobacter lari (ClPglB) was determined in a complex with the acceptor peptide, GDQNAT(p-nitroF), containing a eubacterial sequon (underlined, [DE]XNX[ST], where X≠P,) [20]. The same group also reported the ternary complex structures, consisting of ClPglB, the acceptor peptide, and an LLO analog [21,22]. In parallel, the crystal structures of the full-length AglB protein from Archaeoglobus fulgidus (AfAglB) were determined in the apo state (Fig. 1-1b)[23] and the complex state with an acceptor peptide, RYNVTAC, containing a sequon (underlined) and a cysteine residue for disulfide-bond tethering (italicized) [24]. A. fulgidus belongs to the phylum Euryarchaeota, and its LLO is the monophosphate type [17]. Despite the different chemical properties of the oligosaccharide donors, the structural comparison of the two distantly related enzymes has provided a common structural basis for understanding the catalytic mechanism of the oligosaccharyl transfer and the recognition mechanism of the N-glycosylation sequon. Specifically, the N-terminal 13 transmembrane helical region contains the catalytic site, and the C-terminal globular domain contains the binding site for the Ser/Thr residue in the sequon. Recently, two groups determined the single-particle cryo-EM structures of the yeast OST [25,26] and the human OSTs [27]. As expected, the catalytic STT3 subunits in the yeast and human OSTs share the same catalytic structure and Ser/Thr-binding pocket as those in the single-subunit OSTs, AglB and PglB.
The crystal structures of ClPglB and AfAglB in the complexes with LLO and sequons highlighted the need for an analysis of the conformational changes that occur during the oligosaccharyl transfer. The external loop 5 (EL5) is an extracellular/luminal segment in the N-terminal transmembrane region, and its conformational changes are considered to be essential for the binding of LLO and sequons to the enzyme [20]. The electron densities of the N-terminal and C-terminal halves of the EL5 segment independently become ordered and disordered, in response to LLO binding and sequon binding, respectively [21–24,28]. The catalytic structure, consisting of two conserved acidic amino acid residues and a bivalent metal ion, must be formed dynamically since one of
the two acidic residues is present in the EL5 loop [20,23]. The dynamic role of EL5 has attracted keen attention, but other parts of the protein may also contribute to the dynamic recognition and catalytic processes. Our previous NMR study suggested the dynamic nature of the Ser/Thr-binding pocket in a paralogous protein of AfAglB [29].
We proposed that the dynamic formation and disruption of the Ser/Thr pocket would facilitate the efficient scanning of an N-glycosylation sequon along a long polypeptide chain. We also provided experimental evidence for the active involvement of different conformations, in addition to those in the crystal structure. A conformationally restricted OST protein from another archaeon, Pyrococcus furiosus, was inactive in a disulfide bond-locked conformation but returned to the fully active state after the cleavage of the engineered disulfide bond [29]. Undoubtedly, a dynamic viewpoint is necessary for understanding the catalytic mechanism of the OST enzymes, to complement the information obtained from the atomic, but inevitably static, crystal and cryo-EM structures.
1.3. High-speed AFM
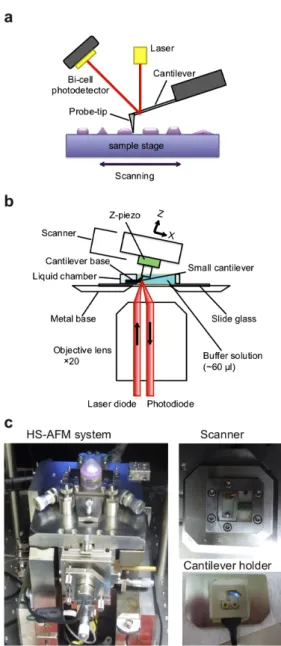
High-speed AFM (HS-AFM) enables direct observations of dynamical events of protein molecules in real-time. Ando group at Kanazawa University developed a HS-AFM observation system. Though the conventional AFM took at least 1 min to acquire an image, the scanning rate of HS-AFM is 10-16 frames/s [30-35]. HS-AFM allows us to observe protein molecules in solution, so that the dynamics of protein molecules have been successfully visualized, for example, myosin V walking on actin filaments, F1-ATPase rotational movements, and dynamic GroEL-GroES interactions [36-39]. AFM produces images by acquiring sample height information over many points with a sharp probe tip attached to the cantilever (Fig. 1-2a) [40]. The HS-AFM system uses a tapping mode to image the biological samples loosely fixed on a sample stage at high speed. The cantilever is excited to oscillate at its first resonant frequency and the amplitude and phase of the oscillation are both modulated when the probe tip intermittently contacts the surface. The bi-cell photodetector detects deflection of the cantilever by detecting a laser beam reflected back from the cantilever (Fig. 1-2a). Via a feed-back control, the sample stage is moved in the Z-direction to maintain the tip-sample interaction force constant, which enables to form an image without damage
of the sample by the tip. The schematic of a HS-AFM system is shown in Fig. 1-2b. A cantilever is held with its tip facing upward and the z-scanner with sample stage is placed downward over the cantilever. The pictures of a HS-AFM system in Ando laboratory are shown in Fig. 1-2c.
Figure 1-2. High-speed AFM apparatus (a) Schematic of a tapping mode of AFM.
(b) Schematic of HS-AFM measurement principle.
(c) The pictures of a HS-AFM system. The pictures were taken at Ando laboratory in Kanazawa University.
1.4. Solubilization methods for structural and dynamical analysis of membrane proteins
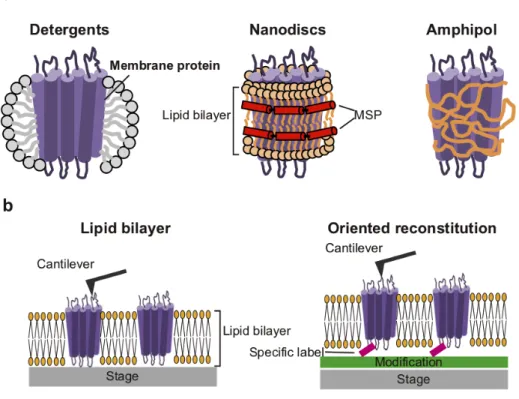
Structural and dynamical analyses of membrane proteins are still more challenging than those of soluble proteins due to the difficulty in the sample preparations of membrane proteins. It requires isolation and stabilization of membrane proteins in solution environment, engineering of the protein constructs, and selection of expression platforms [41]. The most versatile method for solubilization of membrane proteins is the use of detergent micelles (Fig. 1-3a, left). Development of new detergents in recent years has improved the stability of membrane proteins, but empty detergent micelles frequently interfere the single particle analysis with electron microscopy [41]. The detergent-free solubilization methods such as nanodiscs or Amphipol are useful for single particle analysis. Nanodiscs are a useful model membrane mimetic that provides a native-like environment for membrane proteins, which are comprised of a small circular patch of lipid bilayer encircled by two amphipathic α-helical membrane scaffold proteins (MSPs) (Fig. 1-3a, center) [42-44]. To prepare nanodiscs, the detergent-solubilized membrane proteins are mixed with lipids and membrane scaffold proteins (MSPs) at controlled ratios, followed by detergents removal. Amphipol is a short amphipathic polymer that can wrap around the hydrophobic surfaces of membrane proteins directly (Fig. 1-3a, right) [45-46].
For HS-AFM measurements, precise experimental design is needed to visualize dynamical events of protein molecules [40]. In particular, membrane protein observations require special protocols for the formation of a lipid bilayer on the sample stage and the properly oriented reconstitution of the target membrane protein within the lipid bilayer (Fig. 1-3b) [47–50]. The chemical modifications of the sample stage have been used for immobilization of protein molecules. For example, the KcsA potassium channel was immobilized onto the sample stage with a specific orientation by the interactions between the histidine-tag and Ni2+-coated mica surface, prior to the reconstitution in the lipid bilayer [48]. The oriented reconstitution system is necessary to observe the specific dynamics of membrane proteins.
Figure 1-3. Solubilization methods for membrane proteins for structural analyses (a) Representative solubilization methods of membrane protein.
(b) Observation of membrane proteins using HS-AFM.
1.5. Motivation and outline of my research
To study the dynamical aspect of the AfAglB protein molecule, I conducted the HS-AFM analysis. I used the specific interactions between a biotin-labeled AfAglB protein and an avidin-coated surface for the oriented immobilization on the sample stage. This system enabled observations of the dynamic two-state exchange in the height of the AfAglB molecules in a lipid bilayer environment. To support the result of HS-AFM measurements, solution NMR analyses of the AfAglB protein in a detergent-solubilized environment was also conducted. The presence of two sets of cross peaks demonstrated the slow conformational changes between the two states, not only in the C-terminal globular soluble domain but also in the EL5 loop in the N-terminal transmembrane region. I will discuss the functional implications of the dynamic state exchanges in the OST molecule.
To reveal the structure of AfAglB in lipid bilayers, I conducted the single particle analyses of AfAglB trapped in Amphipol and embedded in nanodiscs. AfAglB embedded in nanodiscs adopted an open conformation. This conformation is different from the crystal structure and the two states observed in the HS-AFM analysis. I am not sure that this third state represents a genuine state in solution or an artifact due to the staining with uranyl acetate. In conclusion, AfAglB consists of the two domains, of which relative orientation is in a dynamic equilibrium between several conformational states.
Chapter 2. Two-state Exchange Dynamics in Membrane-Embedded Oligosaccharyltransferase Observed in Real-Time by High-Speed AFM 2.1. Materials and Methods
2.1.1. Expression, purification, and biotinylation of AfAglB
The DNA sequence encoding the A. fulgidus AglB triple mutant, D188C/E307C/E457C, was generated using a KOD Plus mutagenesis kit (TOYOBO).
The AfAglB mutant protein was expressed and purified as described previously [24].
Briefly, the transformed Escherichia coli C43 (DE3) cells (Lucigen) were grown at 37°C to an OD600 of 0.9-1.2 in Terrific Broth medium supplemented with 100 mg L-1 ampicillin. After overnight induction with 0.5 mM isopropyl β-D-1-thiogalactopyranoside (IPTG) at 25°C, the cells were harvested by centrifugation and disrupted by sonication in buffer A (50 mM Tris-HCl, pH 8.0, 100 mM NaCl). The membrane fractions were collected by ultracentrifugation at 100,000 × g for 2 h and solubilized in buffer A containing 1% (w/v) n-dodecyl-β-D-maltopyranoside (DDM, Dojindo). After ultracentrifugation at 100,000 × g for 1 h, the recombinant protein in the supernatant was subjected to affinity chromatography on Ni Sepharose High Performance resin (GE Healthcare), equilibrated in buffer A containing 0.1% DDM. To avoid unwanted disulfide bond formation, 1,4-dithiothreitol (DTT) was added to the elution at a final concentration of 5 mM. The protein was further purified by gel filtration chromatography on a Superdex200 10/300 GL column (GE Healthcare) in buffer B (50 mM Tris-HCl, pH 7.4, 300 mM NaCl) containing 0.05% DDM.
Biotin-PEAC5-maleimide (Dojindo), dissolved in dimethyl sulfoxide, was added to the purified AfAglB mutant protein in a 20-fold molar excess. The solution was incubated at room temperature for 18 h. L-Cysteine (Wako) was added to the solution in 5-fold molar excess to the biotin-PEAC5-maleimide to stop the reaction, and the solution was further incubated for 30 min. The biotin-labeled protein was purified by gel filtration chromatography on a Superdex200 10/300 GL column, in buffer B containing 0.05% DDM.
2.1.2. Oriented reconstitution of AfAglB in a lipid bilayer on the 2D tamavidin crystal
Tamavidin 2-LPI (FUJIFILM Wako Pure Chemical Corporation) was diluted to 0.2 mg mL-1 in 25 mM HEPES-NaOH, pH 8.5, containing 500 mM NaCl, 250 mM MgCl2, and 20% PEG 6000, and incubated at 20°C for 30 min. The tamavidin solution (3 µl) was placed on freshly cleaved mica and left at room temperature for 10 min. The excess tamavidin was removed by washing, and the 2D crystalline state of tamavidin was chemically fixed by 0.01% glutaraldehyde in 20 mM HEPES-NaOH, pH 8.5, containing 200 mM MgCl2, for 10 min. The cross-linked tamavidin crystal was rinsed with buffer C (20 mM Tris-HCl, pH 7.4, 100 mM NaCl).
Destabilized liposomes were prepared as previously described [48], except for the lipid and buffer compositions. 1,2-Dioleoyl-sn-glycero-3-phosphocholine (DOPC, Avanti Polar Lipids) and biotinylated 1,2-dioleoyl-sn-glycero-3-phosphoethanolamine (biotin-cap-DOPE, Avanti Polar Lipids), each dissolved in chloroform at a concentration of 10 mg mL-1, were mixed at a 9:1 (w/w) ratio of DOPC to biotin-cap-DOPE. The mixture was dried under a nitrogen gas stream and then overnight in a SpeedVac concentrator (Thermo Savant). The lipid film formed on the bottom of the tubes was re-dissolved in buffer C, to adjust the concentration of the total phospholipids to 8 mg mL-1. The solution was frozen in liquid nitrogen and melted at room temperature five times, for liposome formation. The solution containing liposomes was stored at -80°C until use. The stored solution was melted at room temperature and diluted two-fold with buffer C containing 2.4 mM DDM to generate DDM-destabilized liposomes. The solution was then diluted three-fold with buffer C.
The final lipid and DDM concentrations were 1.3 mg mL-1 and 0.4 mM, respectively.
The biotin-labeled AfAglB mutant, at a concentration of 300 - 500 ng mL-1 in buffer C containing 0.05% DDM, was adsorbed on the 2D tamavidin crystal via the biotin-tamavidin interactions. After an incubation for 5 min, the excess AfAglB protein was washed away with buffer C containing 0.4 mM DDM. The DDM-destabilized liposomes were then overlaid and incubated for 10 min, to form the supported bilayer.
Finally, the DDM in the supported bilayer was washed away with buffer C.
2.1.3. HS-AFM observation
The high-speed (HS)-AFM imaging of AfAglB embedded in a lipid bilayer was conducted at ambient temperature (25°C), using a laboratory-built HS-AFM operated in the tapping mode, as described [40]. The AFM tip was fabricated on the original tips of cantilevers (BL-AC7DS-KU4 or BL-AC10DS-A2, Olympus) by electron-beam deposition in ferrocene gas. The cantilever free oscillation amplitude was set at 1-2 nm, and the set-point amplitude for the feedback control was 90% of the free oscillation amplitude. The feedback parameters were optimized during the observations to minimize the tip-sample interaction force. The scan size, pixel size, and imaging rate are described in the relevant Figure legends.
HS-AFM images were analyzed using the laboratory-built software, Kodec4.4.7.39 [51] and the NIH ImageJ Fiji 1.52g/Java 1.8.0_66 software suite [52]. The plugins, Surface Plot, Gaussian Blur 3D, and Subtract Background, were used for image processing. Particle detection, tracking, and height measurements were performed using the plugin, TrackMate v3.8.0 [53] (“Height_Tracker.sh”, Program S1). The vertical distance from the lipid bilayer surface (i.e., the mean background level) to the highest point of the membrane-embedded AfAglB is defined as the height of the extramembranous part of AfAglB. In practice, the observed values in the range of 3 to 7 nm were considered as the molecular height. The time variation of the height was analyzed with the program R v3.3.3. The height distribution of AfAglB was fitted to a linear combination of Gaussian functions, using the EM algorithm in the Mixtools version 1.1.0 package [54] (“FitGauss_to_histogram.sh”, Program S2). The switching points between the low and high states in the time variation of height were identified with the Changepoint v2.2.2 package [55] and used to determine the dwell-times of the low and high states (“Detect_change_points.sh”, Program S3). The survival curves for the two states were fitted to single exponential functions (“Survival_plot.sh”, Program S4).
2.1.4. Purification of AfLLO
LLO was purified from A. fulgidus cells, as described previously [17]. Briefly, the extracted A. fulgidus membrane fractions were resuspended in 50 mM Tris-HCl, pH 7.4.
Methanol and chloroform were added to the membrane fractions at a 2:1:0.8 (v/v/v) ratio of CH3OH:CHCl3:membrane fraction. After stirring at room temperature overnight, the mixture was centrifuged at 900 × g for 30 min. Chloroform and water were added to the supernatant at a 1:1:3.8 (v/v/v) ratio of the CHCl3:H2O:mixture. The lower organic phase was recovered and dried overnight under a nitrogen gas stream. The crude LLO was resuspended in CMW [CHCl3:CH3OH:H2O, 10:10:3 (v/v/v)) and stored in a glass container at -30°C until use.
The LLO was first separated by anion exchange chromatography. The crude LLO was injected into a HiTrap DEAE FF column (GE Healthcare), equilibrated in CMW containing 3 mM acetic acid, and left for 30 min for adsorption. After washing with the initial solvent, the LLO was eluted with CMW containing 0.3 M ammonium acetate.
CHCl3 (0.43 mL) and H2O (0.12 mL) were added per 1 mL of the eluted solution, and then the mixture was vortexed and centrifuged. The lower organic phase was dried in a SpeedVac concentrator and resuspended in CMW. The LLO was further purified by normal-phase HPLC on a SUPELCO column (4.6 mm × 25 cm, 581513-u, Sigma-Aldrich) and detected by a QSTAR Elite ESI-mass spectrometer (ABSciex).
Solvent A was CHCl3:CH3OH:NH4OH at 800:195:5 (v/v/v), and solvent B was CHCl3:CH3OH:H2O:NH4OH at 450:450:95:5 (v/v/v/v). A linear gradient of solvent B was applied at a gradient rate of 2% mL-1 from 0% to 100%, with a flow rate of 1 mL min-1. The fractions containing LLO bearing hexa- and heptasaccharide chains modified with a sulfate group were pooled and used for the AFM analysis.
2.1.5. Incorporation of LLO into an AfAglB-embedded lipid bilayer on the AFM sample stage
The DDM-destabilized liposome solution, consisting of 4 mg mL-1 total phospholipids and 1.2 mM DDM, was added to the dried LLO, vortexed, and sonicated in a bath-type sonicator, to incorporate the LLO into the destabilized liposomes. The
solution was then diluted three-fold with buffer C. The DDM-destabilized liposomes containing LLO were overlaid on the 2D tamavidin crystal, to form supported lipid bilayer containing LLO. After an incubation for 10 min, the DDM in the supported bilayer was washed away with buffer C.
To test the oligosaccharyl transfer activity of the AfAglB immobilized on the sample stage, the substrate peptide in buffer C was added at a final concentration of 10 µM. The amino acid sequence of the substrate peptide is NH2-AAYNVTKRK(TAMRA)-COOH, where the N-glycosylation sequon is underlined, and a fluorescent dye, TAMRA (5/6-carboxytetramethylrhodamine), is attached to the side-chain amino group of the C-terminal lysine residue. After an 8 h incubation for the reaction, the solution on the sample stage was recovered and subjected to SDS-PAGE for the detection of glycopeptide formation [56,57]. The fluorescent image of the SDS-PAGE gel was recorded with a Fusion Solo 7S imager (Vilber Lourmat).
2.1.6. Preparation of NMR samples
For the methionine 1H-13C methyl NMR measurements, all of the methionine residues in the wild type AfAglB protein were replaced with other amino acid residues.
The methionine-depleted AfAglB (AfAglB*) is a mutant containing M198L, M228V, M316F, M328I, M389I, M408L, M417V, M510L, M564I, M614L, M622L, M678I, M695L, M730T, M740L, M756L, and Q2A. The last mutation at the second N-terminal glutamine residue is necessary to facilitate the removal of the N-terminal translation initiator methionine by the methionyl aminopeptidase. The oligosaccharyl transfer activity assay of AfAglB* was performed as reported previously [56,57]. Two methionine mutations, N341M and A359M, in the N-terminal and C-terminal regions of the EL5 loop, respectively, were then introduced as the conformational probe in AfAglB*. After transformation, the E. coli host cells were grown in M9 minimal medium consisting of 99.9% 2H2O (ISOTEC), supplemented with [U-1H, 13Cε] L-methionine (Cambridge Isotope Laboratories) and [U-2H] glucose.
The uniformly 15N-labeled peptide, AAYNVTACK, was expressed as an N-terminally SUMO-tag fused protein in E. coli host cells, grown in M9 minimal medium supplemented with [15N] ammonium chloride. The SUMO tag was removed by SUMO protease (Nacalai Tesque, Japan). The resultant peptide was purified by
reverse-phase HPLC. Asparagine residue-selective 15N-labeled peptides were chemically synthesized. First, the α-amino and side-chain amide groups of [2,3,3-2H, U-15N] L-asparagine (Cambridge Isotope Laboratories) were protected by an Fmoc (9-fluorenylmethyloxycarbonyl) group and a Trt (trityl) group, respectively (custom synthesized by Watanabe Kagaku Kougyou, Japan). The protected asparagine was then used in the custom synthesis of two peptides, AAYNVTACK and AAYNPTACK, containing 15N2-Asn (Toray Research Center, Japan). The N-terminal α-amino and C-terminal α-carboxy groups were unmodified. The uniformly 15N-labeled and selectively 15N-labeled peptides were tethered to the non-labeled AfAglB(G617C) mutant protein via a disulfide bond, to generate [U-15N]NVT-AfAglB, [15N2-Asn]NVT-AfAglB, and [15N2-Asn]NPT-AfAglB.
2.1.7. NMR Spectroscopy
All NMR experiments were performed using a Bruker Avance600 spectrometer, equipped with a TCI cryoprobe. All NMR data were processed by the program nmrPipe version 3.0 and displayed by the program nmrDraw [58]. 1H-13C SOFAST-HMQC spectra [59] were recorded at 323 K for 14 h, using 7 µM [U-1H, 13Cε-Met, U-2H-other amino acids]AfAglB*(N341M or A356M), dissolved in 10 mM HEPES-d18-NaOH (Cambridge Isotope Laboratories), pH 7.5, 50 mM NaCl, 0.1%
dodecylphosphocholine-d38 (DPC, Cambridge Isotope Laboratories), and 5 mM MgCl2
in 100% 2H2O. 1H-15N HSQC spectra were recorded at 298 K for 10 h, using 0.34 mM [U-15N]NVT-AfAglB, 0.40 mM [15N2-Asn]NVT-AfAglB, and 0.48 mM [15N2-Asn]NPT-AfAglB, dissolved in 20 mM MES-NaOH, pH 6.0, 80 mM NaCl, 10 mM MgCl2, and 0.03% DDM in 1H2O/2H2O (90:10, v/v). After the HSQC measurement, DTT was added to the NMR sample tubes at a final concentration of 100 mM, to dissociate the peptides from the proteins by the reduction of the disulfide bond. 1H-15N HSQC spectra in the presence of DTT were recorded at 298 K for 1 h.
2.1.8. Modeling the state 2 structure of AfAglB
The state 2 structural model was built using the DC-ENM web server (https://enm.lobos.nih.gov/start_dc.html) [60]. The input data were the coordinates of
the crystal structure and the distance constraints (DC), to pull the initial structure to the unknown bent structure. The crystal structure of AfAglB in the complex with zinc and sulfate ions (PDB: 3WAJ) was used as the initial structure, because of its highest resolution (2.50 Å). I used three different DC sets for comparison. DC set 1 contains
“A426, A625, 10.0, 1.0”, where the target distance is 10.0 Å with weight 1.0 between the Cα atoms of residues 426 and 625 in chain A. DC set 2 contains “A426, A739, 15.0, 1.0”, and DC set 3 contains “A375, A630, 5.0, 1.0”. The distance changes during the DC-ENM calculations were 20.0 Å→ 10.0 Å with DC set 1, 27.3 Å→ 15.0 Å with DC set 2, and 27.6 Å→ 5.0 Å with DC set 3. After the DC-ENM runs, the transmembrane regions (residues 15-494) of the initial and end structures were superimposed by the pair_fit command in PyMOL 2.3.2 (Schrödinger).
2.2. Results
2.2.1. Oriented reconstitution of AfAglB in a lipid bilayer for HS-AFM measurement
By reference to the method used for the KcsA potassium channel [48], I developed an optimized protocol for the oriented reconstitution of AfAglB in a lipid bilayer (Fig. 2-1).
First, three cysteine residues were introduced in the cytoplasmic loops of the AfAglB protein. Biotin groups were conjugated with an AfAglB triple mutant (D188C/E307C/E457C) via the thiol-maleimide reaction. To do so, tamavidin, a novel avidin-like biotin-binding protein from the Tamogitake mushroom, was two-dimensionally crystallized on a mica surface (Fig. 2-1a, Step 1). The biotin-labeled AfAglB, solubilized in DDM micelles, was then immobilized onto the tamavidin crystal, with its C-terminal globular domain oriented upward (Step 2). The three-point interactions between the biotins and tamavidins contributed to the stable adhesion (Fig.
2-1c). In parallel, liposomes were formed with DOPC and biotin-capped DOPE, and subsequently destabilized by the addition of DDM. The destabilized liposomes were overlaid on the tamavidin-coated mica, to form a lipid bilayer thereon (Step 3-1). The lipid and DDM concentrations were optimized to generate gap-less lipid bilayers containing AfAglB on the surface of the tamavidin 2D crystals. In comparison to the previous report, in which a His-tagged protein was attached to Ni2+-coated mica [48], a higher concentration of DDM was necessary to fix a biotin-labeled protein on tamavidin-coated mica. Finally, the DDM was removed from the lipid bilayer by washing with a DDM-free buffer (Step 3-2). The AFM image at the last step confirmed the uniform distribution of particles with the expected size, indicating that the AfAglB molecules were successfully embedded in the lipid bilayer (Step 4).
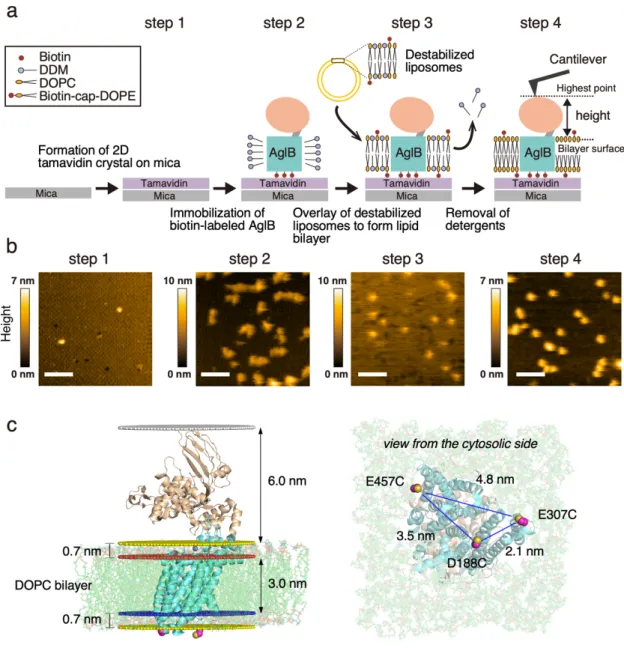
Figure 2-1. HS-AFM measurement of AfAglB embedded in a lipid bilayer.
(a) Procedure for the oriented reconstitution of AfAglB molecules in a lipid bilayer on the sample stage.
Step 1: Tamavidin is two-dimensionally crystallized on the mica surface. Step 2: The AfAglB protein bearing three biotin molecules on the cytoplasmic side is immobilized on the tamavidin crystal, in the presence of DDM detergent. Step 3: Liposomes consisting of DOPC and biotin-cap-DOPE are mixed with a small amount of DDM. The resultant destabilized liposomes are overlaid on the tamavidin crystal to form a supported lipid bilayer, and the DDM is removed from the lipid bilayer. Step 4: To monitor the conformational changes of AfAglB, the vertical distance from the lipid bilayer surface to the highest point of an AfAglB molecule is measured as the molecular height. (b) Still HS-AFM images recorded
separately after each step. The corresponding movies captured at a rate of 3.3 frame s-1 are available as Videos S1-S4 in the Supplemental Information. The scanning area was 200 nm × 200 nm with 100 × 100 pixels for Steps 1 and 4, 120 × 120 pixels for Step 2, and 200 × 200 pixels for Step 3. Scale bars, 50 nm.
(c) AfAglB embedded in a bilayer and three biotinylated sites for HS-AFM measurements. The crystal structure (3WAJ) was embedded in a DOPC lipid bilayer using the Membrane/Bilayer builder in the CHARMM-GUI [61]. The predicted membrane positions were retrieved from the OPM database [62].
The red and blue planes indicate the boundary positions between the hydrophilic choline head groups and hydrophobic part at the extracellular and cytoplasmic side, respectively. The yellow planes indicate the membrane surfaces and the white plane indicates the top of the protein molecule. The three cysteine residues introduced at residues D188, E307, and E457 for biotinylation are depicted in the sphere model.
2.2.2. Two-state conformational exchange of AfAglB revealed by HS-AFM
I performed HS-AFM measurements of AfAglB embedded in the lipid bilayer, by monitoring the vertical distance from the surface of the lipid bilayer to the highest point of the molecule (Fig. 2-1a, Step 4). The height of the extramembranous part of the molecule has two distinct states. Representative image frames corresponding to the two states of a single molecule are shown in Fig. 2-2a. I defined the high state as state 1, and the low state as state 2. One state was sustained for a certain amount of time and then quickly changed to the other state, without any intermediate state in between them, in a series of successive images recorded at time intervals of 0.15 s (Fig. 2-2b, Fig. 2-3a).
The height variations of the single molecule were summarized as a histogram of the height distribution (Fig. 2-2c). State 1 has a longer occupancy time than state 2, and the height difference between the two states is 2.0 nm.
I collected the time-series data of 73 single molecules and presented the data as a height distribution histogram (Fig. 2-2d). This histogram also showed two peaks corresponding to state 1 and state 2. The height difference between the two states is 1.8 nm with wider peak widths than the single molecule case. The single AfAglB molecules in a lipid bilayer exhibit intermittent changes of the heights during the HS-AFM observations. The change in the motion frequency is considered to be slow compared to the AFM recording time, typically 40 - 100 s. The time trace of the height in Fig. 2-2b corresponds to an average case of motion. Typical examples corresponding to resting and moving phases are shown in Fig. 2-3b. Similar intermittent behaviors of single molecules were reported in the observations of actomyosin interaction [63], DNA-protein interaction [64], diffusion of ion channels in cell membranes [65], and electron transfer between two nanoparticles [66].
Figure 2-2. Height measurement of the AfAglB molecules in the lipid bilayer.
(a) The left AFM image shows a frame when the height of a single AfAglB molecule was high (state 1), and the right image shows another frame captured when the height of the same molecule was low (state 2).
The scanning area was 50 nm × 50 nm with 50 × 50 pixels. Scale bars, 10 nm. (b) A time trace of the height changes of the AfAglB molecule shown in (a). The imaging rate was 6.7 frames s-1. (c) Histogram of the height distribution, made from the time trace data shown in (b). (d) Histogram of the height distribution of all observed AfAglB molecules (N=73).
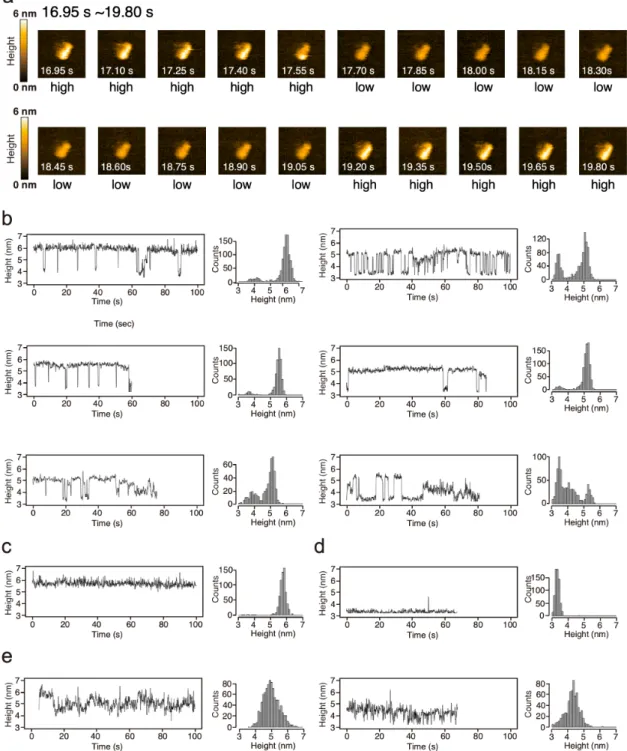
Figure 2-3. Successive AFM images and representative examples of the height changes in the HS-AFM measurements.
(a) The changes in height of one AfAglB molecule in the lipid bilayer (Fig. 2-2b) are shown from 16.95 s to 19.80 s. (b-e) Some typical time traces of the height changes and their height distribution histograms.
The imaging rate was 6.7 and 10 frames s-1. (b) Examples of the high-low exchange dynamics. (c) An example of the high-state stuck dynamics. (d) An example of the low-state stuck dynamics. (e) Hard-to-classify examples.
2.2.3. Survival plots for the estimation of the exchange rates
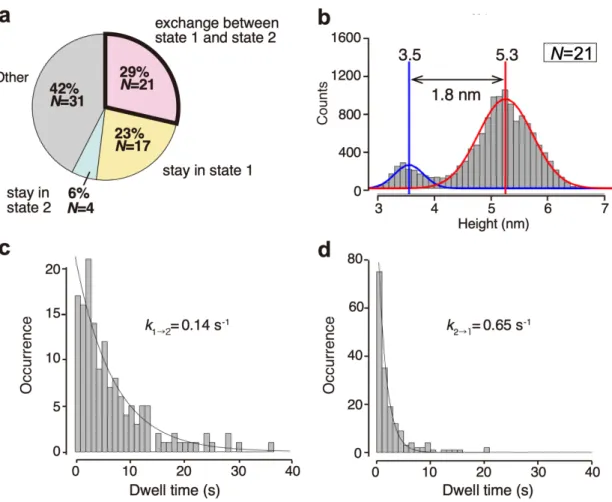
Among the 73 single molecules, 29% (N=21) showed clear-cut two-state exchange dynamics, 23% (N=17) stayed in state 1, 6% (N=4) stayed in state 2, and the remaining 42% (N=31) displayed unclassified behaviors (Fig. 2-4a). Representative examples of the four categories are shown in Fig. 2-3b. I selected the 21 single molecules with the two-state exchange property to calculate the dwell-times of the two states. Survival plots were constructed to estimate the exchange rates from one state to the other (Fig.
2-4c and 2-4d). The two rate constants, k1→2, and k2→1, were 0.14 s-1 and 0.65 s-1, respectively. The rate ratio (4.6) is different from the area ratio (7.3) of state 1 to state 2 in the histogram (Figs. 2-4b and 2-5b). The discrepancy is attributed to the different criteria for the state assignment. In the histogram, the peaks were fitted by Gaussian curves. In the survival plots, the molecular height was assigned to state 1 or state 2 when the mean height for a certain short time was greater or less than the overall mean height, respectively (Fig. 2-5a). If the states in the histogram with the criterion used for the survival plots are reassigned, then the area ratio is 4.6 (Fig. 2-5b), which matches the rate ratio obtained from the survival plots. Thus, the data in the histograms and the survival plots are consistent with each other considering the differences in the state assignment criteria.
Figure 2-4. Dynamic height analysis of the AfAglB molecules in the lipid bilayer.
(a) Classification of the dynamic behaviors of AfAglB molecules in the lipid bilayer. The total number of observed molecules in the AFM measurements was 73, among which 21 molecules (29%) showed exchanging dynamics between state 1 and state 2. (b) Histogram of the height distribution appearing in the AFM images of the 21 molecules. (c, d) Survival plots of state 1 and state 2, made from the time traces of the heights for the 21 molecules. The survival curves were fitted to single exponential functions.
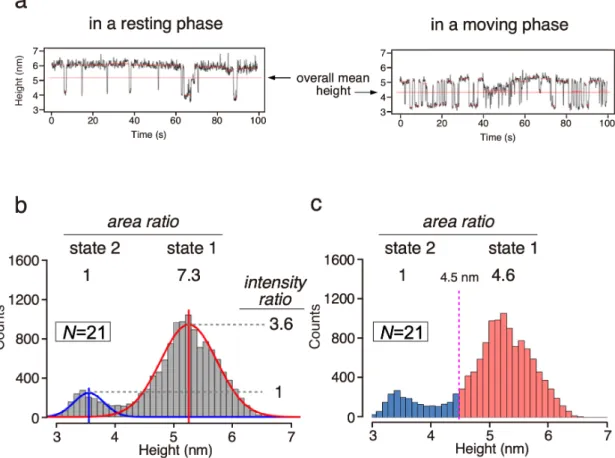
Figure 2-5. Estimation of the abundance ratio of state 1 to state 2 from the height distribution histogram.
(a) Representative examples of the time trace corresponding to a resting state and a moving state of the height changes. The switching points between the states were identified with the Changepoint package (red lines). The molecular height is assigned to state 1 or state 2 when the mean height for a certain short time is greater or less than the overall mean height. (b) Area and intensity ratios are calculated after the Gaussian curve fitting. (c) Area ratio was calculated using the boundary value of 4.5 nm.
2.2.4. LLO binding shifts the conformational equilibrium of AfAglB
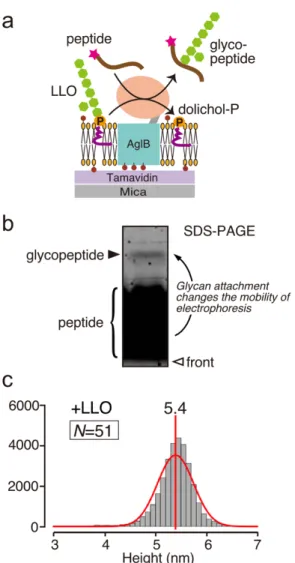
I assessed the possible effects of the binding of the sugar donor substrate, LLO, on the two-state exchange equilibrium of AfAglB. LLO was introduced to the lipid bilayer on the sample stage. Briefly, purified LLO extracted from archaeal cell membranes was mixed with DOPC and biotin-capped DOPE, to prepare liposomes. The liposomes were then destabilized by the addition of DDM and overlaid on the AfAglB-preloaded sample stage. The amount of LLO was at least a 100-fold molar excess over that of AfAglB at the time of the AFM observation. Before the AFM measurements, I checked the oligosaccharyl transfer activity of the AfAglB immobilized on the sample stage. A fluorescent dye-labeled substrate peptide was added to the solution on the sample stage (Fig. 2-6a). After an incubation, the solution was recovered and subjected to SDS-PAGE. The fluorescent image of the SDS-PAGE gel revealed the production of glycopeptides (Fig. 2-6b), indicating that AfAglB and LLO were both active when reconstituted in the lipid bilayer. The time variation of the molecular height was measured in the presence of LLO. The histogram with LLO (N=51) showed only one peak corresponding to state 1 (Fig. 2-6c), and its peak width was decreased, as compared to the histogram (N=73) without LLO (Fig. 2-2d). Thus, the binding of the sugar donor LLO shifted the equilibrium almost completely to state 1 and decreased the structural fluctuation of the AfAglB molecules. I then attempted to observe the effect of peptide substrate addition on the height change of the AfAglB-LLO binary complex by HS-AFM measurements but did not observe any differences in the height distributions.
Figure 2-6. Dynamic height analysis of AfAglB molecules embedded in an LLO-containing lipid bilayer.
(a) Schematic showing the oligosaccharyl transfer activity measurement. The sugar donor substrate, LLO, was pre-embedded in the lipid bilayer. Note that the A. fulgidus LLO used here is a monophosphate (P) type containing six or seven hexose residues (green hexagons) [17,67]. A sugar acceptor peptide substrate (brown curved lines), which contains the N-glycosylation sequon and a fluorescent dye (magenta stars) for detection, was added to the solution in the AFM sample chamber, to initiate the reaction. (b) Fluorescent image of the SDS-PAGE gel used to show the oligosaccharyl transfer activity. The contrast was adjusted with a sigmoid tone curve. The assay was performed as reported previously [57,58]. After an incubation at 25 °C, the solution in the AFM sample chamber was recovered and subjected to SDS-PAGE. The upper band corresponding to the glycopeptide product indicated that AfAglB and LLO were both enzymatically active in the reconstituted system. (c) Height histogram of AfAglB in the presence of LLO.
2.2.5. NMR evidence for the two conformational states of AfAglB
The methyl group of a methionine residue is useful to monitor the conformational states of large protein molecules by NMR [59]. The AfAglB protein contains 17 methionine residues, including the N-terminal initiator methionine. To avoid accidental overlaps of the 1H-13C cross peaks of the methyl groups and facilitate the resonance assignment, the 17 methionine residues were replaced with other amino acids by mutagenesis. The amino acid residues chosen for substitution were selected by reference to the sequence alignment of closely related AglB proteins (Fig. 2-7a). The methionine-depleted mutant (AfAglB*) retained about 70% of the original oligosaccharyl transfer activity (Fig. 2-7b). Then one methionine residue was reincorporated as a probe, to monitor the local conformational states around the single methionine site. Residues 341 and 359 were selected, which reside in the N-terminal half and the C-terminal half of the EL5 loop, respectively. For metabolic labeling, [U-1H, 13Cε] methionine was included in the growth medium of the E. coli host culture.
The 1H-13C SOFAST-HMQC spectra of AfAglB* (N341M) and AfAglB* (A359M), in the presence of deuterated dodecyl phosphocholine (DPC) detergent, were recorded at 323 K (Fig. 2-8a). Note that DPC was used as a substitute for DDM, because of the availability of the deuterated material. Two cross peaks (plus at least one minor cross peak) were observed for N341M, suggesting the existence of at least two states in the N-terminal half of the EL5 loop. In contrast, A359M had a single cross peak, suggesting one average state in the C-terminal half of the EL5 loop. The latter result confirmed that the multiple cross peaks were not caused by the partial oxidation of the sulfur atom of the methionine residues during sample preparation.
The conformational state of the AfAglB molecule was also monitored, using the
1H-15N cross peaks of a substrate peptide tethered to the protein via an engineered disulfide bond. This tethering was necessary to shift the association-dissociation equilibrium to the bound state, to overcome the weak affinity. The cross-linked AfAglB-peptide was previously shown to be active in glycopeptide formation in an intramolecular fashion, which justifies the use of the tethered complex for structural and functional studies [24]. The peptide, AAYNVTACK, which contains the N-glycosylation sequon (underlined) and a cysteine residue (italicized) for tethering,
was uniformly 15N-labeled by metabolic labeling. Separately, one cysteine was introduced at residue 617 by replacing G617, to create a single anchoring point on the protein side. The 1H-15N HSQC spectrum of the tethered peptide in the cross-linked complex state with the unlabeled AfAglB(G671C) was recorded at 323 K (Fig. 2-8b).
The observed number of backbone 1H-15N cross peaks was twice the expected number, again suggesting the existence of two conformational states with a slow conversion rate.
After recording the HSQC spectrum of the complex, DTT was added to release the peptide by reduction. As expected, a single set of cross peaks was observed, demonstrating the integrity of the peptide. For further confirmation of the two conformational states in solution, an asparagine residue-selective 15N-labeled peptide with the same sequence, AAYNVTACK, was prepared by chemical peptide synthesis.
As expected, two backbone cross peaks of the 15N-labeled asparagine residue were observed in the cross-linked complex, while only one cross peak was present after the reduction by DTT (Fig. 2-9a). The two cross peaks could result from the exceptionally slow association-dissociation of the peptide to the active site of the AfAglB protein. To exclude this possibility, another asparagine residue-selective 15N-labeled peptide was prepared, with the sequence AAYNPTACK. Although the proline in the sequon prevented the peptide from binding to the active site, the two backbone cross peaks of the 15N-labeled asparagine residue in the cross-linked complex were still observed (Fig.
2-9b), indicating that the very slow association-dissociation of the peptide is unlikely.
In summary, the methyl signal splitting of the methionine residues in the EL5 loop of the apo state of AfAglB, and the backbone amide signal splitting in a peptide in the cross-linked complex state indicated the existence of two conformational states of AfAglB, with a slow interconversion rate. The same conclusions from the two different NMR experiments demonstrated that the detected conformational changes are not local fluctuations, but spread throughout the AfAglB protein molecule. Finally, the characterization of the dynamic states of AfAglB molecules in the presence of LLO is interesting. However, the requirement of a large amount of LLO prevented us from conducting such a demanding NMR experiment.
Figure 2-7. Methionine-depleted mutant used in the NMR experiments.
(a) Design of a methionine-depleted AfAglB mutant (AfAglB*) by reference to the sequence alignment of closely related AglB proteins. (b) Oligosaccharyl transfer assay of AfAglB*. The error bars represent the standard deviations of triplicate measurements. AfAglB* retained about 70% of the activity of the wild-type AfAglB. The p-value of the two-sided Welch’s t-test is 0.03.
Figure 2-8. NMR spectra of the AfAglB molecules in the detergent micelle solution.
(a) 1H-13C SOFAST-HMQC spectra of the ε-methyl group of singly reincorporated methionine residues at residue 341 (left) and residue 359 (right), in the methionine-depleted mutant (AfAglB*) in the presence of deuterated DPC. [U-1H, 13Cε] L-Methionine was used for metabolic labeling. The insets show the 1D 1H projections. The measurement temperature was 323 K. (b) 1H-15N HSQC spectra of a uniformly
15N-labeled peptide substrate in the bound state (left) to AfAglB and in the free state (right), both in the presence of DDM. The amino acid sequence of the peptide was AAYNVTACK, where the N-glycosylation sequon is underlined. The second cysteine residue from the C terminus was used to tether the peptide via a disulfide bond to the cysteine at residue 617 in the AfAglB(G617C) mutant. DTT was added to release the peptide by reduction. The measurement temperature was 298 K.
Figure 2-9. Dynamic NMR analysis of AfAglB using residue-selective 15N-labeled peptides.
1H-15N HSQC spectra of the asparagine-specific 15N-labeled peptide in the bound state (left) and the free state (right), both in the presence of DDM.
(a) The amino acid sequences of the peptides are AAYNVTACK, where the N-glycosylation sequon is underlined, and (b) AAYNPTACK, which possesses an inactive sequon. The second cysteine residue from the C terminus was used to tether each peptide via a disulfide bond to the cysteine at residue 617 in AfAglB(G617C). DTT was added to release the peptide. The measurement temperature was 298 K.
2.3. Discussion
The internal dynamics of protein molecules play important roles in various functions, including enzymatic catalysis. In this study, I performed an HS-AFM analysis of the single-subunit oligosaccharyltransferase from an archaeon, Archaeoglobus fulgidus (AfAglB). The AfAglB molecules were first immobilized on a solid surface, with the globular domain oriented upward (Fig. 2-1). The AfAglB molecules were then reconstituted in lipid bilayers that were aligned parallel to the solid surface. The distance between the top of the protein molecule and the upper surface of the lipid bilayer (i.e., the mean background level) was monitored in real-time, as the time-dependent changes in the height of the extramembranous domain of AfAglB. The HS-AFM measurements identified a two-state transition with a height change of 1.8 nm (Fig. 2-4b). The average molecular height of the extramembranous domain is 5.3 nm in state 1 and 3.5 nm in state 2 (Fig. 2-4b). The lifetimes of the respective states fit well to single exponential functions, suggesting that the observed dynamic exchange is an intrinsic property of the AfAglB molecules (Fig. 2-4c and 2-4d).
As shown in Figure 2-3, one-molecule measurements for AfAglB showed various features, but I only focused on the molecules showed two-state conformational exchange. The survival plots indicated that the observed dynamics was physically meaningful for AfAglB (Figure 2-4) so that I think the selection was reasonable. It is possible that about 70% of molecules didn’t show two-state conformational exchange dynamics because some AfAglB molecules were enzymatically inactive or the conditions of HS-AFM imaging were not suitable.
By comparison with the AfAglB crystal structure embedded in a lipid bilayer (Fig.
2-1c), I concluded that state 1 more closely resembles the crystal structure than state 2. I have to account for the smaller measured height values (5.3 nm) than the actual height (6.0 nm) of the extramembranous domain of the molecule. I consider that the large pixel size (1 nm × 1 nm) of the AFM imaging and the volume of the biotin group attached to the DOPE molecules in the upper half of the lipid bilayer may explain the height underestimation. Of course, I cannot rule out a different assignment of the two states.
State 2 may correspond to the crystal structure, whereas state 1 is a new open state. As an even drastic option, the crystal structure is neither state 1 nor state 2. With all things
considered, however, the stabilization of the state 1 by the binding of LLO (Fig. 2-6c) is favorable to the assignment of state 1 to the crystal structure.
The measured height difference of 1.8 nm between the two states is considered accurate. Thus, the structure in state 2 must be much more compact than the crystal structure, and I should consider the structural basis of state 2. The three-dimensional structure of state 2 has not been characterized yet, because the other crystal and cryo-EM structures of the catalytic subunits from other species are all similar to the crystal structure of AfAglB. One possibility for state 2 is the detachment of a small subdomain from the core region (Fig. 2-10a, left). The most distal region of the C-terminal globular domain, residues 777-868, forms the β-structure-rich subdomain P1 in the three-dimensional structure of AfAglB [23]. It is conceivable that this independent domain fluctuates in position, while maintaining its three-dimensional structure or unfolding transiently. The separated part in the rapid fluctuation movements cannot be detected by HS-AFM, regardless of the folded/unfolded state. I cannot rule out this possibility but regard it as unlikely due to the many interactions between the subdomain and the other part of the globular domain (Fig. 2-11). Another possibility is the spontaneous narrowing of the inter-domain gap in the apo state by a bending motion (Fig. 2-10a, right). In the apo state, the EL5 loop and its preceding TM9 helix are detached from the core structure to create an inter-domain space [20,68]. This large space could allow a decrease in the height of the molecule.
To assess the possibility of the bending motion model (Fig. 2-10a, right), I applied the elastic network model (ENM) to the apo structure of the AfAglB molecule (PDB:
3WAJ) (Fig. 2-12). The DC (direct constraint)-ENM method uses a linear combination of multiple low-frequency normal modes of a molecule to deform the shapes of proteins and nucleic acids [69]. The deforming direction is guided by a few pairs of distance constraints. Here, the purpose of the DC-ENM calculation is not to obtain the correct state 2 structure or transition path, but to estimate the feasibility of the mechanism for the reduction of the inter-domain space. The amino acid residue pairs were selected by visual inspection of the crystal structure. For simplicity, I used only one constraint for each DC set. The different DC sets resulted in similar decreases in height, ~1.5 nm (Fig.
2-12b). The DC-ENM calculations revealed that the bending motion of the AfAgB molecule is conceivable as the molecular mechanism for the generation of state 2. The Im group conducted four-microsecond molecular dynamics (MD) simulations of the
PglB protein embedded in a POPC (1-palmitoyl-2-oleoyl-sn-glycero-3-phosphocholine) bilayer in complexes with various combinations of two substrates/products [70]. Since the interconversion from state 1 to state 2 is of the order of seconds, an MD simulation with a special technique, such as targeted MD, is necessary to obtain a more realistic view of the dynamic AfAglB protein in the future.
The presence of the two sets of NMR signals suggested that the AfAglB protein in the detergent micelle solution also exists in two distinct states, the apo state (Fig. 2-8a) and the complex state with substrate peptides (Figs. 2-8b and 2-9). The abundance ratio is almost 1:1 in the two different types of NMR measurements. In contrast, state 1 has a larger population than state 2 (Fig. 2-2) in the AFM measurements. This discrepancy is attributable to the environmental differences, i.e., detergent micelles in the NMR experiments and lipid bilayers in the AFM experiments.
The time scale of the exchange between the two states was on the second-order in both the AFM and NMR experiments and appeared to be much slower than those in usual enzymatic reactions. One possible explanation is the non-ideal measurement conditions for a thermophilic archaeal enzyme. In living archaeal cells, AfAglB functions at high temperatures (70 – 80 °C) in plasma membranes consisting of Archaea-specific isoprenoid lipids. Accordingly, the lower temperature measurement in the present study decreases the exchange rate, and the non-physiological phospholipid bilayer may hamper the interconversion process. Even though the experimental conditions were not optimal, AfAglB had detectable oligosaccharyl transfer activity in the model phospholipid bilayer at 25 °C (Fig. 2-6b). Therefore, I assume that the observed state exchange phenomenon is related to the oligosaccharyl transfer reaction.
I now focus on the association of the two-state exchange dynamics with the catalytic function. The binding of the sugar donor LLO shifted the equilibrium to state 1 (Fig.
2-6c). This result is consistent with the fact that the ClPglB crystal structure in the apo state is almost identical to that in the complex with LLO. LLO also decreased the peak width of state 1 (Figs. 2-2d and 2-6c). Although the two models can equally account for the stabilization effect of LLO, I will adopt the bending mechanism (Fig. 2-10a, right) for further discussion, considering its feasibility. I assume an equilibrium between the two conformations in the apo state in the natural archaeal plasma membrane (Fig. 2-10b, apo state). First, LLO binds and stabilizes the conformation in state 1 (binary complex state). The resultant binary complex is ready for the arrival of a sequon in a polypeptide