Kinetics of cerebral blood flow in the
moderate and heavy exercise intensity domains estimated using the transcranial Doppler
method
著者 HIURA Mikio, IZUMI Shigeki
出版者 法政大学スポーツ健康学部
journal or
publication title
法政大学スポーツ健康学研究
volume 1
page range 25‑34
year 2010‑03
URL http://doi.org/10.15002/00007229
Kinetics of cerebral blood flow in the moderate and heavy exercise intensity domains estimated using the transcranial Doppler method
Mikio Hiura1), Shigeki Izumi1)
[Abstract]
Purpose: The purpose of this study was to investigate the kinetics of cerebral blood flow (CBF) in conjunction with cardiopulmonary response during constant-work rate cycling exercise of moderate and heavy intensities.
Methods: Seven subjects (6 males and 1 female; age, 25.4 ± 7.7 yr; height, 171.9 ± 4.3 cm; body mass, 67.7 ± 11.4 kg) participated in the present study. The subjects completed incremental cycle ergometer test to assess VO2peak, the gas exchange threshold (GET), and the respiratory compensation threshold (RCT). Secondary, the subjects performed two sets of constant workload of exercise bouts (10 min) by cycle ergometer corresponding to the level of 10% below GET (moderate intensity) and RCT (heavy intensity). Respiratory gas analysis and the middle cerebral blood flow mean velocity (MCA Vmean) were measured simultaneously using the transcranial Doppler (TCD) method. PaCO2 was estimated (ePaCO2) using PETCO2 and VT. We assumed that MCA Vmean
could be used as an index of the global CBF. Results: VO2 and ePaCO2 remained stable after the onset at moderate intensity whereas VO2 increased throughout the trail and ePaCO2 decreased after the onset at heavy intensity. The percentage change from baseline for MCA Vmean (∆MCA Vmean) increased within 2 min to a peak value within 2 min by 32.8 ± 9.1% and 31.8 ± 11.8% at moderate and heavy intensity, respectively. In the heavy-intensity exercise ∆MCA Vmean decreased further below the response to moderate exercise as time progressed prior to the recovery phase (trials × time: F = 3.84, P < 0.05). Conclusion: The different kinetics of MCA Vmean between moderate and heavy-intensity exercise was identified during a constant work rate cycling exercise. We found that in heavy-intensity trials, the relationship between ePaCO2 and MCA Vmean was different to that at moderate intensity during the recovery phase.
Key Words: Cerebral blood flow, transcranial Doppler, exercise
Introduction
Perturbation of cerebral blood flow (CBF) should be a concern when the central command from the brain terminates exercise at volitional exhaustion 1,2). Previous studies have reported that the middle cerebral artery blood flow mean velocity (MCA Vmean), measured using the transcranial Doppler (TCD) method, decreases during high-intensity exercise 3, 4, 5). Further, it has been suggested that MCA Vmean can be used as an index of
the global CBF rather than the regional CBF since the volume perfused by the middle cerebral artery between the cerebral hemispheres is quite large, although individual differences exist 6). This finding obtained during exercise suggests that hyperventilation-induced hypocapnia could affect CBF since carbon dioxide (CO2) plays an important role in regulating CBF.
Recently, we investigated MCA Vmean during incremental exercise tests 7) and reported that MCA
1)Faculty of Sports and Health Studies, Hosei University
Vmean peaked at the respiratory compensation threshold (RCT) where the end-tidal pressure of CO2 (PETCO2) began to decrease 8). In the present study, we investigated the kinetics of MCA Vmean
during constant work rate cycling exercise. In moderate-intensity constant work rate exercise, during which oxygen uptake (VO2) remains in the steady state of phase III 9), PETCO2, which reflects the arterial CO2 pressure (PaCO2) to some extent, also has a steady phase. In contrast, PETCO2 could be affected during heavy-intensity constant work rate exercise. During steady-state exercise, it appears that the CBF could be stable if PETCO2 remained stable during low-intensity exercise but altered if PETCO2 changed during high-intensity exercise.
The purpose of this study was to investigate the kinetics of CBF detected by TCD during two trials that consisted of moderate and heavy constant work rate cycling exercise. The domains of moderate and heavy intensity have been described in previous studies based on VO2 and lactate response 10). As the phase III of VO2 kinetics occurs below the lactate threshold (LT) or the gas exchange threshold (GET) 8, 9), the power output at the GET in the incremental test was defined as the criterion for constant work rate at moderate intensity. Considering that the exercise intensity at the RCT can be regarded as the cut-off point where volitional exhaustion begins in incremental tests, we selected the power output at the RCT as the criterion for constant work rate at heavy intensity.
We hypothesized that the kinetics of CBF would be different between the two trials and investigated whether the kinetics of CBF would be similar to that of systematic PaCO2 estimated from pulmonary gas exchange. Since systematic PaCO2 changes in response to increased metabolic demand of energy consumption for working muscles and hyperventilation during exercise, PaCO2 was
estimated using the formula that was proposed and applied in previous studies 11, 12) using PETCO2 and tidal volume (VT) during the trials.
METHODS Subjects
Seven volunteers (6 males and 1 female; age, 25.4 ± 7.7 yr; height, 171.9 ± 4.3 cm; body mass, 67.7 ± 11.4 kg), having given written informed consent, took part in this study, which conformed to the standards set by the Declaration of Helsinki. All subjects were healthy and none reported any history of neurological or cardiovascular diseases. All subjects had abstained from exercise and caffeine for at least 12 h before the day of the experiment. Prior to any data collection, the subjects were familiarized with all procedures and measurements.
Experimental design
Subjects visited the laboratory on two occasions, with a minimum of two days of recovery between each test, and all tests were performed within four weeks. On the first visit, the subjects followed a ramp protocol for the determination of VO2peak, GET, and RCT on an electromagnetically braked cycle ergometer (Lode Excalibur Sport, Groningen, The Netherlands). On the second visit, subjects performed two trials of different constant work rate cycling exercise with sufficient rest for recovery between each trial. On the second visit, MCA Vmean was measured using TCD.
Determination of VO2peak, GET, and RCT
Each subject adjusted the ergometer for comfort and the seat height was adjusted so that there was a slight bend in the knee joint when the pedal was at its lowest point. VO2peak, GET, and RCT were determined using a ramp protocol that consisted of 1 min of unloaded baseline pedaling and then a 25 W exercise started with a 30 W・min–1 or
25 W・min–1 increase in work rate until volitional exhaustion. Subjects were instructed to maintain their preferred cadence (60–80 r.p.m.) for as long as possible. The test was terminated when the subjects could no longer maintain the pedaling frequency above 60 r.p.m. for more than 10 s despite strong verbal encouragement. Throughout the test, pulmonary gas exchange was measured breath-by-breath as described below. VO2peak was determined as the highest average VO2 over a 30-s period. Data were reduced to 10-s averages for the estimation of GET and RCT.
Constant work rate tests
These tests were performed after 1-min unloaded pedaling of the preferred cadence (60–80 r.p.m.). The first trial was of moderate intensity corresponding to approximately 10% below the GET; the second trial was of heavy intensity approximately 10% below the RCT. Between each trial, the subjects rested for at least 3 h so that the baseline state was not different among trials.
Pulmonary gas exchange was measured breath-by-breath throughout the tests. During the tests, measurements of the middle cerebral artery blood flow velocity (MCA Vmean) were performed using TCD ultrasound.
Equipment
The subjects breathed through a facemask (Hans Rudolph, MO, USA) connected to an online gas analyzer (CPET; Cosmed, Rome, Italy). The inspired and expired gas volume and gas concentration signals were continuously sampled at 100 Hz, the latter using paramagnetic (O2) and infrared (CO2) analyzers via a capillary line connected to the facemask. These analyzers were calibrated before each test with gases of known concentration, and the turbine volume transducer was calibrated using a 3-L syringe (Hans Rudolph,
MO, USA). The volume and concentration signals were time aligned by accounting for the delay in capillary gas transit and analyzer rise time relative to the volume signal. VO2, CO2 production (VCO2), VT, minute ventilation (VE), and PETCO2 were calculated and displayed breath-by-breath. Heart rate (HR) was monitored every 5 s by short range radio telemetry (Polar S-610; Polar Electro, Kempele, Finland). MCA Vmean was determined using TCD (Companion III, Nicolet Vascular, CO, USA). The proximal segment of the middle cerebral artery was insonated at a depth of 50–54 mm from the temporal bone depending on the position with the best signal-to-noise ratio 13). Once the optimal signal-to-noise ratio was obtained, the probe was covered with an adhesive ultrasonic gel and secured with headbands because the probes of the TCD should be accurately insonated with an appropriate volume of the sample to be detected.
Data Analysis
Measurements of pulmonary gas exchange were averaged over 10-s intervals for subsequent analysis. PaCO2 was estimated from measurements of PETCO2 and VT (in liters) using the equation described by Jones and colleagues 11). The estimated PaCO2 (ePaCO2) was calculated as 5.5 + (0.9 × PETCO2) – (0.0021 × VT). MCA Vmean was computed as the time average of continuously sampled maximum frequency Doppler shift for each heart beat, which thereafter were averaged over 10-s intervals. In this study, we determined MCA Vmean as the time-averaged maximum velocity (TAVmax) that was calculated from the peak systolic velocity (PSV) and the end-diastolic velocity (EDV) during each heart beat as TAVmax = (PSV + 2 × EDV)/3 14). TAVmax was obtained by an A/D converter and the softwares Power Lab ML840 and Chart version 7.0 (ADInstruments, CO, USA).
Statistical Analysis
Unless otherwise stated, all data are presented as the mean ± SD. Normality of the data was checked using the Shapiro-Wilk test, and homogeneity of variance was checked using the Levene test. Baseline variables for the two trials were compared using a paired t-test. One-way repeated-measures analysis of variance (ANOVA) was performed to evaluate the differences within trials. For the differences between trials and time, two-way repeated-measures ANOVA was performed.
The source of any significant main effect was examined using Bonferroni post hoc analysis. The data were analyzed using the statistical package Prism 5.0 (GraphPad Software, CA, USA) and Medcalc 10.0 (Medcalc Software bvba, Mariakerke, Belgium). The level of statistical significance was set at P < 0.05.
RESULTS
Incremental tests and baseline measurements in the two trials
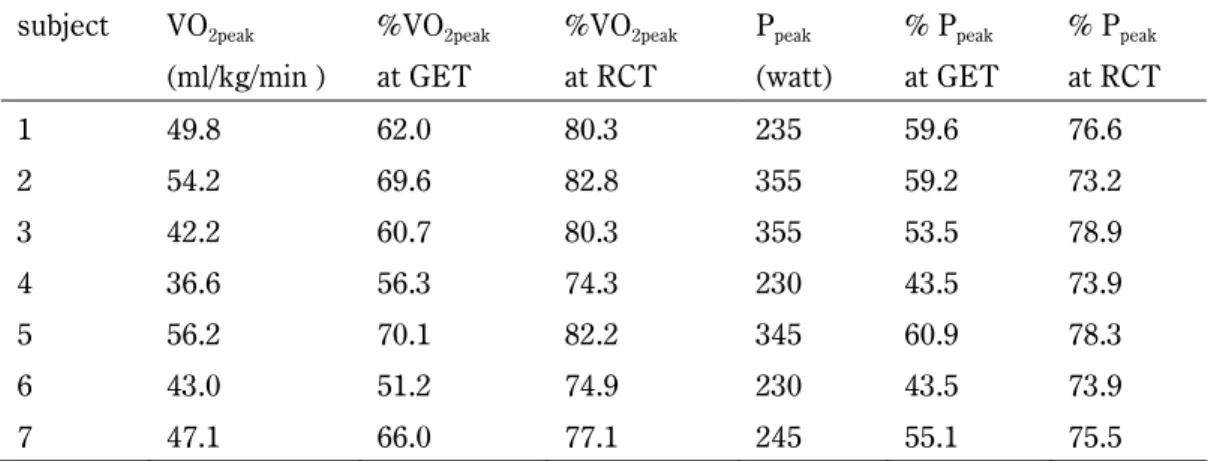
Peak values of oxygen uptake (VO2peak) and percentage values relative to VO2peak at the GET and RCT are presented in Table 1. On the basis of the results of the incremental tests, the power output for constant work rate trials at moderate intensity
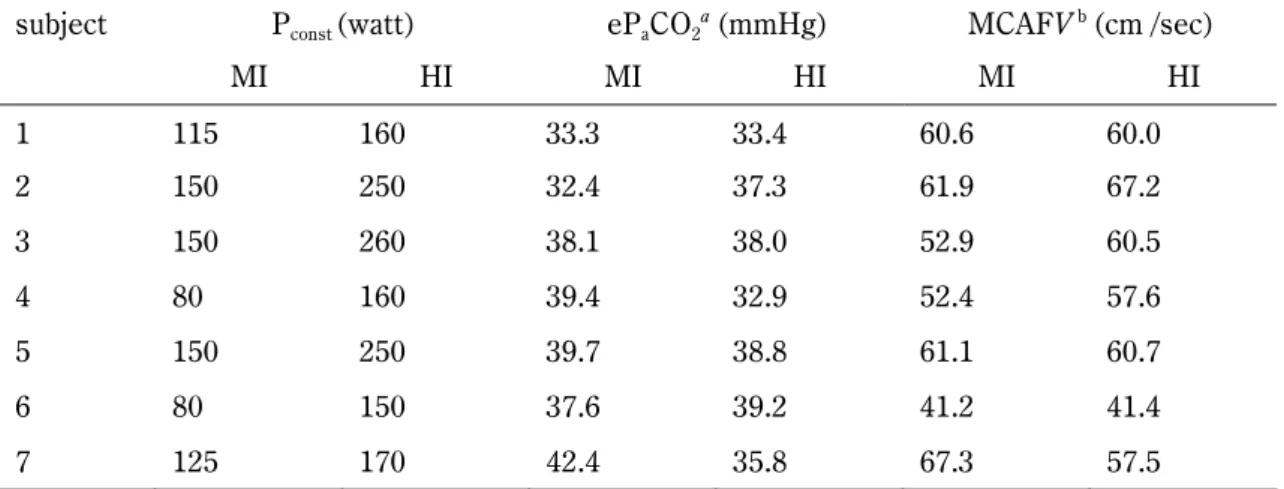
and heavy intensity were determined for each subject (Table 2). The individual baseline values of respiratory and cerebral hemodynamic variables for the two trials are presented in Table 2. ePaCO2 and MCA Vmean were similar at rest before the two trials.
Cardiopulmonary responses
The VO2 and ePaCO2 recorded during exercise and recovery are presented in Fig. 1. VO2 increased at the onset and did not change during exercise in the moderate-intensity trial, whereas it increased gradually in the heavy-intensity trial. ePaCO2 increased at the onset and began to decrease toward the end of exercise in the heavy-intensity trial, whereas it did not change until the end of exercise in the moderate-intensity trial. ePaCO2 decreased in the recovery phase of both trials, but with lower values in the heavy-intensity trials than in the moderate-intensity trials at 11 min and 14 min.
Cardiopulmonary data at the end of the trials (10 min) were significantly higher in heavy-intensity trials than in the moderate-intensity trials (Table 3).
Cerebral hemodynamics
TCD measurements of MCA Vmean were performed bilaterally; however, there were discrepant results between the sides in three subjects that may have been attributable to head
Table 1. Individual values of oxygen uptake and power output for selected intensities derived from the incremental tests.
subject VO2peak (ml/kg/min )
%VO2peak at GET
%VO2peak at RCT
Ppeak (watt)
% Ppeak at GET
% Ppeak at RCT
1 49.8 62.0 80.3 235 59.6 76.6
2 54.2 69.6 82.8 355 59.2 73.2
3 42.2 60.7 80.3 355 53.5 78.9
4 36.6 56.3 74.3 230 43.5 73.9
5 56.2 70.1 82.2 345 60.9 78.3
6 43.0 51.2 74.9 230 43.5 73.9
7 47.1 66.0 77.1 245 55.1 75.5
movement artifacts. Accordingly, in the cases of discrepancy, the side yielding higher values was selected for further investigation. As the baseline values of MCA Vmean were different among subjects (Table 2), the percentage change from baseline (∆MCA Vmean) for each subject was used for investigation in both trials. The ∆MCA Vmean values recorded during exercise and recovery are presented in Fig. 1 in conjunction with cardiopulmonary variables. ∆MCA Vmean increased within 2 min to a peak value by 32.8 ± 9.1% and 31.8 ± 11.8% at moderate and heavy intensity, respectively. In the heavy-intensity exercise ∆MCA
Vmean decreased further below the response to moderate exercise as time progressed prior to the recovery phase (trials × time: F = 3.84, P < 0.05).
During the recovery phase, there was no significant difference in ∆MCA Vmean between the moderate- and heavy-intensity trials.
Time course of ePaCO2 and∆MCA Vmean
Individual values of ePaCO2 and ∆MCA Vmean
were observed in relation to the duration from start to peak and from end to nadir, and expressed as Tpeak and Trec,respectively (Fig. 2). As shown in Fig. 3, for both ePaCO2 and ∆MCA Vmean, Tpeak was shorter in Table 2. Individual power output for constant work load (Pconst) and baseline values of respiratory and cerebral hemodynamic variables for moderate-intensity (MI) and heavy-intensity (HI) trial.
subject Pconst (watt) ePaCO2a (mmHg) MCAFV b (cm /sec)
MI HI MI HI MI HI
1 115 160 33.3 33.4 60.6 60.0
2 150 250 32.4 37.3 61.9 67.2
3 150 260 38.1 38.0 52.9 60.5
4 80 160 39.4 32.9 52.4 57.6
5 150 250 39.7 38.8 61.1 60.7
6 80 150 37.6 39.2 41.2 41.4
7 125 170 42.4 35.8 67.3 57.5
aePaCO2, b MCAFV were not significantly different between the two trials.
Table 3. Cardiopulmonary data at 10 min in moderate-intensity (ExMI) and heavy-intensity (ExHI) trial.
ExMI at 10 min ExHI at 10 mina
V&E (L/min) 42.7±6.0 94.0±28.4
V&O2 (ml・min-1・kg-1) 27.7±4.1 44.5±8.3
%V&O2peak 58.9±1.8 94.9±11.1
RER 0.88±0.04 0.94±0.06
fb (breaths per minute) 24.4±4.6 41.5±5.7
VT (L) 1.82±0.53 2.27±0.62
HR (beats per minute) 121±18 169±17
petCO2 (mmHg) 43.6±2.9 36.3±2.8
aAll variables in ExHI at 10 min were significantly higher than those in ExMI.
heavy-intensity trials than in moderate-intensity trials and Trec in high-intensity trails was longer than in moderate-intensity trials. Tpeak in MCA Vmean
lagged that in ePaCO2 by 28.6 s (P < 0.05) at heavy intensity and by 32.9 s (P < 0.05) at moderate intensity as well. During the recovery phase, Trec in MCA Vmean lagged that in ePaCO2 by 50.0 s (P <
0.05) at heavy intensity, whereas Trec in MCA Vmean
did not differ from that in ePaCO2 (P = 0.67) at moderate intensity. Furthermore, values of ePaCO2 and ∆MCA Vmean at 0 min, Tpeak, 10 min and Trec beyond 10 min were investigated as time-aligned data, including the onset and endpoint (Fig. 4).
There was a significant difference between the moderate- and heavy-intensity trials (trial × time F
= 3.41 and 6.43, P < 0.05 and 0.001 for ePaCO2 and
∆MCA Vmean, respectively). It was commonly found Figure 1.
VO2 (A), ePaCO2 (B), and ∆MCA Vmean (C) during 10 min of cycling exercise and recovery at moderate intensity (○) and heavy intensity (●) trial. Values are mean ± SEM; n=7. Significantly different from 1 min for VO2 (A), ePACO2 (B) and from 2 min for ∆MCA Vmean (C) within trial: P
<0.05 and ** P <0.01. Significantly different from moderate-intensity trial: †P <0.05 and ‡ P
<0.01. NS: Not significantly changed.
Figure 2.
ePaCO2 (A) and ∆MCA Vmean (B) in relation to the duration from start to peak (Tpeak)and from end to nadir (Trec) during 10 min of cycling exercise and recovery at moderate intensity (○) and heavy intensity (●) trial. Values are mean ± SEM; n=7.
that ePaCO2 and ∆MCA Vmean at Tpeak did not differ between the moderate- and heavy-intensity trials.
At heavy intensity, ePaCO2 decreased further below the response to moderate exercise as time progressed at the endpoint. In the heavy-intensity trial, ∆MCA Vmean was lower than in the moderate-intensity trial only at the end of exercise (10 min), but was similar at Trec.
DISCUSSION
The main finding of the present study is that
the time curse of the MCA Vmean change in heavy-intensity trials differed from that at moderate intensity during a constant work rate cycling exercise. As shown in Figs. 1, 2, and 4, there was also a difference between the two trials in terms of the kinetics of VO2 and ePaCO2. In the moderate-intensity trials, MCA Vmean decreased during exercise, whereas the kinetics of VO2 and ePaCO2 remained stable after the onset. In heavy-intensity trials, the decrease in MCA Vmean
during exercise was steeper than that in the Figure 3.
Tpeak (A) and Trec (B) of MCA Vmean and ePaCO2 during 10 min of cycling exercise and recovery at moderate-intensity (MI) and heavy-intensity (HI) trial. Values are mean ± SEM; n=7.
*Significantly different from MI trial (P <0.05).
†Significantly different from MCAVmean(P <0.05).
Figure 4.
ePaCO2 (A) and ∆MCA Vmean (B) at 0 min, Tpeak. 10 min and 10 min plus Trec at moderate-intensity (MI) and heavy-intensity (HI) trial. Values are mean ± SEM; n=7. Significantly different from MI trial at a given time point: *P <0.05 and ** P
<0.01.
moderate-intensity trials. This enhanced change in MCA Vmean is similar to that observed in extreme conditions such as during heat stress, where MCA Vmean has been demonstrated to decrease during intense exercise by 20%–30% due to hyperventilation-induced hypocapnia 1,12, 15). The finding that MCA Vmean was closely correlated with ePaCO2 confirms that CO2 plays an important role in regulating CBF 16, 17). However, in the moderate-intensity trials of the present study, MCA Vmean decreased without a change in ePaCO2 and this finding suggests that factors other than CO2 regulate CBF. Although arterial blood pressure, cardiac output, and sympathetic activation could influence the regulation of CBF 1, 3, 18), these factors were not investigated in the present study. Whereas the range of ePaCO2 differed between the two trials, that of MCA Vmean was similar (Fig. 4). This discrepancy was identified during the recovery phase, during which MCA Vmean did not decrease in the heavy-intensity trials as much as expected from the cerebral vascular response (CVR) to CO2 recorded in the moderate-intensity trials.
Accordingly, it is speculated that CBF would not decrease beyond a certain extent under circumstances where hypoperfusion disturbs the homeostasis of the central nerve system. In the present study, CBF was approximately 20% below the baseline where MCA Vmean decreased to a nadir during the recovery phase in heavy-intensity trials.
If the CVR to CO2 in the moderate-intensity trials was applied at the endpoint in the heavy-intensity trials, the MCA Vmean would decrease to nearly 50%
below the baseline. Considering that a previous study reported that presyncopal symptoms occur when MCA Vmean decreased by approximately 50%
from the resting value 19), it is likely that factors other than CO2 play a role in regulating CBF in order to prevent hypoperfusion during heavy-intensity exercise. Differences between the
two trials with respect to ePaCO2 andMCA Vmean
were also suggested by the temporal changes (Fig.
3). In both Tpeak and Trec, changes in MCA Vmean
lagged behind those in ePaCO2 in the heavy-intensity trials, whereas synchronized change between MCA Vmean and ePaCO2 was identifiedin the moderate-intensity trials. These findings suggest that CBF reacts rapidly to a change in ePaCO2 in moderate-intensity trials but that this was not the case in the heavy-intensity trails. During constant work rate exercise, the kinetics of PaCO2 differed between heavy- and moderate-intensity domains during both the onset and recovery 20). With regards to ePaCO2, these findings were confirmed in the present study and, additionally, we made a new discovery concerning MCA Vmean..
Secondly, we suggest the possibility that the kinetics of MCA Vmean could indicate a boundary between the moderate- and heavy-intensity domains, i.e., the LT or GET that is identified using pulmonary gas exchange criteria or analysis of blood lactate response during the staged protocol of the incremental tests 8). This boundary could not be detected using the kinetics of VO2 and ePaCO2 with a single bout of constant work rate exercise and could reflect the fitness status of the observed subjects 21). In one study of prolonged exercise 12), which was carried out for 60 min in a thermoneutral environment at a constant work rate of approximately 57% VO2max, MCA Vmean
increased at the onset by 20% and remained stable, and the kinetics of ePaCO2 were similar to those of MCA Vmean. In the present study, the steady state of VO2 was identified in the moderate-intensity trials with a mean of 58.9% VO2peak at the end of trials, but MCA Vmean decreased. The heterogeneous characteristics of subjects with a VO2peak of 47.0 ± 7.0 ml·min–1·kg–1 in the present study (Table 1) were quite different from the homogeneous characteristics of subjects with a VO2max of 70 ± 1
ml·min–1·kg–1 in the previous study. The intensity of 57% VO2max observed among highly trained subjects in the previous study is expected to be sufficiently below the GET, whereas the moderate intensity of 58.9% VO2peak recorded in the present study was close to the mean of 62.3% VO2peak at the GET. From a comparison of our data with those from the previous study described above, we speculated that MCA Vmean would remain stable after the onset phase if the constant work rate is sufficiently below the GET for subjects. It is likely that the kinetics of MCA Vmean could be determined by the relationship between the given intensity and fitness status of the subjects. Consequently, from a single bout of constant-work rate exercise of moderate intensity, in which VO2 remains stable after the onset, one could obtain further information relevant to the GET from the kinetics of MCA Vmean. It is notable that in only one bout of constant work rate exercise with measurements for pulmonary gas exchange and MCA Vmean were we able to detect the GET or the boundary between the moderate- and heavy-intensity domains without an additional incremental test.
However, we should investigate other constant work rate tests at an intensity sufficiently below the GET in order to examine this possibility.
Simultaneous analysis for response of blood lactate could confirm the domain of exercise intensity.
Furthermore, it should be taken into consideration that head movement during the trials may have yielded artifacts that suggested a tendency of decreasing MCA Vmean values. With respect to this issue, we could estimate whether measurements were valid or not by comparing values obtained from both sides of the head.
In conclusion, the different kinetics of MCA Vmean between moderate and heavy exercise intensity was identified during a constant work rate cycling exercise. We found that in heavy-intensity
trials, the relationship between ePaCO2 and MCA Vmean was different to that at moderate intensity during the recovery phase. The additional finding that MCA Vmean decreased without a change in ePaCO2 implies that CBF is regulated by factors other than CO2. Furthermore, we suggest the possibility that the kinetics of MCA Vmean during constant work rate cycling exercise could represent a threshold related to the fitness level of subjects.
REFERENCES
1 ) Nybo, L. and P. Rasmussen (2007). Inadequate cerebral oxygen delivery and central fatigue during strenuous exercise. Exerc Sport Sci Rev 35(3): 110–18.
2 ) Nielsen, H. B., R. Boushel, et al. (1999).
Cerebral desaturation during exercise reversed by O2 supplementation. Am J Physiol 277(3 Pt 2): H1045–52.
3 ) Secher, N. H., T. Seifert, et al. (2008). Cerebral blood flow and metabolism during exercise:
implications for fatigue. J Appl Physiol 104(1):
306–14.
4 ) Linkis, P., L. G. Jorgensen, et al. (1995).
Dynamic exercise enhances regional cerebral artery mean flow velocity. J Appl Physiol 78(1):
12–16.
5 ) Jorgensen, L. G., M. Perko, et al. (1992). Middle cerebral artery flow velocity and blood flow during exercise and muscle ischemia in humans.
J Appl Physiol 72(3): 1123–32.
6 ) Tatu, L., T. Moulin, et al. (1996). Arterial territories of human brain: brainstem and cerebellum. Neurology 47(5): 1125–35.
7 ) Hiura, M., T. Mizuno, et al. (2010). Cerebral oxygenation in the frontal lobe cortex during incremental exercise tests: the regional changes influenced by volitional exhaustion. Adv Exp Med Biol 662: 257–63.
8 ) Beaver, W. L., K. Wasserman, et al. (1986). A
new method for detecting anaerobic threshold by gas exchange. J Appl Physiol 60(6): 2020–27.
9 ) Whipp, B. J., S. A. Ward, et al. (1982).
Parameters of ventilatory and gas exchange dynamics during exercise. J Appl Physiol 52:
1506–13
10) Burnley, M., J. H. Doust, et al. (2006). A 3-min all-out test to determine peak oxygen uptake and the maximal steady state. Med Sci Sports Exerc 38(11): 1995–2003.
11) Jones, N. L., D. G. Robertson, et al. (1979).
Difference between end-tidal and arterial PCO2 in exercise. J Appl Physiol 47(5): 954–60.
12) Nybo, L. and B. Nielsen (2001). Middle cerebral artery blood velocity is reduced with
hyperthermia during prolonged exercise in humans. J Physiol 534(Pt 1): 279–86.
13) Aaslid, R., T. M. Markwalder, et al. (1982).
Noninvasive transcranial Doppler ultrasound recording of flow velocity in basal cerebral arteries. J Neurosurg 57(6): 769–74.
14) Valdueza, J. M., S. J. Schreiber, et al. (2008).
Neurosonology and Neuroimaging of Stroke.
Thieme, New York.
15) Nybo, L. and N. H. Secher (2004). Cerebral perturbations provoked by prolonged exercise.
Prog Neurobiol 72(4): 223–61.
16) Kety, S. S. and C. F. Schmidt (1948). The effects of altered arterial tensions of carbon dioxide and oxygen on cerebral blood flow and cerebral oxygen consumption of normal young men. J Clin Invest 27(4): 484–92.
17) Ainslie, P. N., J. C. Ashmead, et al. (2005).
Differential responses to CO2 and sympathetic stimulation in the cerebral and femoral circulations in humans. J Physiol 566(Pt 2):
613–24.
18) Claassen, J. A., R. Zhang, et al. (2007).
Transcranial Doppler estimation of cerebral blood flow and cerebrovascular conductance
during modified rebreathing. J Appl Physiol 102(3): 870–77.
19) Jorgensen, L. G., M. Perko, et al. (1993). Middle cerebral artery velocity during head-up tilt induced hypovolaemic shock in humans. Clin Physiol 13(4): 323–36.
20) Wasserman, K. and R. Casaburi (1991).
Acid–base regulation during exercise in humans 405–48. In Exercise: Pulmonary physiology and pathophysiology. B. J. Whipp and Wasserman eds.
21) Jacobs, I. (1986). Blood lactate. Implications for training and sports performance. Sports Med 3(1): 10–25.