63
DOI: http://dx.doi.org/10.14246/irspsd.2.1_63
Copyright@SPSD Press from 2010, SPSD Press, Kanazawa
Application and Assessment of Crime Risk Based on Crime Prevention Through Environmental Design
Seok-Jin Kang1, Dong-Jin Kim1*, Kyung-Hoon Lee2, and Seung-Jae Lee3
1 School of Architecture, Engineering Research Institute,GyeongsangNational University,Korea 2 Department of Architecture, Korea University,Korea
3 Division of Architecture, Mokwon University,Korea
* Corresponding Author, Email: [email protected] Received 30 May 2013; Accepted 9 November 2013 Key words: CPTED, Crime risk assessment, CCTV, MLRA
Abstract: This study is to suggest a new methodology of crime risk assessment and application method. The current crime risk assessment method is to infer the possibility of crime occurrence by analyzing the past crime data. But there are many limitations and problems to depend on the analysis with past data.
Considering these problems, this study proposes the new methodology to assess crime risk integrated with the existing methods and various factors based on the CPTED principle. This methodology is named as 'Multi-Layered Risk Assessment (MLRA)' because it uses the various factors layered using GIS. The results of MLRA represent a visual graphic for easy interpretation after grading the crime risk. The characteristics of MLRA are able to grade the crime risk on the street and intersection and to be applied in CCTV positioning.
1. INTRODUCTION
Crime Prevention is a significant social issue that affects the quality of life.
Recently frequent crimes on vulnerable society members (e.g., children and women, etc.) have become serious social problems and increased in Korea. And the countermeasures against these problems are summarized as installing CCTV, reinforcement of patrol and application of Crime Prevention Through Environmental Design1 (CPTED). In case of CCTV, it is utilized as important crime prevention method since CCTV that installed in England to watch terrorists from Ireland has been proved to be very effective to prevent crime. In 2009, 4.2 million CCTVs were installed in England. In Korea, around 2 million (0.3 million by the public sector and 1.7 million by the private sector) are installed since five were done for the first time to prevent crime at residential area of Nonhyun-Dong, Kangnam in 2004.
However, although the number of CCTVs for crime prevention is being increased rapidly, crime occurrence does not decrease and that of serious crime is even being increased. The reason is under discussion in various perspectives and it is thought that the wrong or inefficient positioning of CCTVs is one of
1CPTED has emerged and been given considerable academic and administrative attention recently as a new paradigm and an important dimension in crime prevention. CPTED, as proposed by C. Ray Jeffery in 1972, is a theory for crime prevention and community activation composed of five design principles: natural surveillance, access control, territoriality reinforcement, activity support, and maintenance. CPTED in Korea has been developing since the 2000s (Kang, 2013).
major cause of an increase in crime occurrence. Especially the much arrest of major criminals are accomplished by CCTV for traffic control or other intention not CCTV for crime prevention, and this is one of reasoning for inference that the CCTV positioning for crime prevention is wrong or inefficient. It was found that CCTV positioning for crime prevention in Korea is determined by the hot- spot analysis dependent on the existing crime occurrence data, the inference of experienced policeman and a civil petition according to an interview with the persons concerned police administration. However CCTV positioning is determined randomly on the alley of the residential area and the connected spot between main road and residential area for the uncertainty of hot-spot analysis by inadequate crime data and furthermore the CCTV for crime prevention is not installed sufficiently as a demand for crime prevention by reason of limitation of a crime prevention budget.
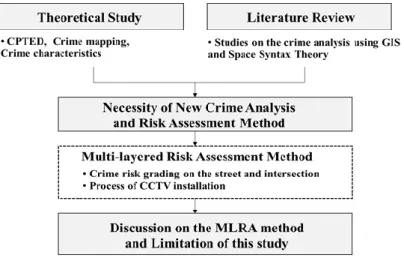
In this respect, this study is to suggest a new methodology of crime risk assessment method and CCTV positioning. The scope and process of this study are as follows: 1) a theoretical study and literature review about crime analysis and risk assessment through space analysis software; 2) a discussion of new methodology about crime risk assessment and CCTV positioning.
2. THEORETICAL STUDY AND LITERATURE REVIEW
2.1 CPTED and Crime Mapping
2.1.1 CPTED (Crime Prevention through Environmental Design)
CPTED has emerged and been given considerable academic and administrative attention recently as a new paradigm and an important dimension in crime prevention. CPTED is a theory for crime prevention and community activation composed of five design principles: natural surveillance, access control, territoriality reinforcement, activity support, and maintenance. CPTED is applied in the area of architectural and urban planning to eliminate of criminal opportunities through a comprehensive analysis of three main elements that lead to crime: motivated criminals, vulnerable victims, and environmental opportunities (Kang, 2013).
Figure 1. Research Process
2.1.2 Crime Mapping
Crime mapping and crime analysis are used to understand the environmental conditions of crime occurrence through analysis of spatial and temporal statistics with crime data and various materials. And Crime risk assessment is to grade the crime risk considering various factors based on the crime analysis. The most common method of the crime risk assessment is crime analysis only depending on existing crime data. Based on this, the route of police patrol and the location of CCTV are adjusted. The result of crime analysis is visualized to be easily understood through crime mapping: point map, district map and density map are commonly used2.
The method and technology of crime analysis are rapidly improving through coordination with spatial geography and computer science. Especially, technical progress of GIS (Geographic Information System) software that can analyze spatial distribution of data statistically and visualize the spatial analysis result activates the research of crime analysis (Hirschfield and Browers, 1997). The common software for crime analysis are Map Info and ArcView GIS and the plug-ins are Spatial Analyst, Crime View, Crime Analysis Extension, Crime Analyst and Spatial Crime Analysis System (SCAS), etc. In United States, CrimeStat (3.0) is used for crime analysis and crime mapping. It is GIS-based software developed by New York Police Department and its early version was presented by Crime Mapping Research Centre (CMRC) of National Institute of Justice (NIJ). The characteristics of CrimeStat are as follows: 1) a target crime is set as dependent variable and socio-economic factors are set as independent ones; 2) applied methods for crime analysis are STAC (Spatial and Temporal Analysis of Crime), KDE (Kernel Density Estimation), NNA (Nearest Neighbour Analysis) and K-function; 3) crime risk area is able to be partly predicted by time sequential analysis (Janet, R., Daniel M., et al., 1999).
2Crime mapping which is the base of crime analysis is progressing as combined with Routine Activity Theory, CPTED and Environmental Criminology. Representative institutes researching crime mapping and crime analysis are Crime Mapping Research Centre (CMRC, US) which is affiliated with National Institute of Justice (NIJ) and Jill Dando Institute of Crime Science (UK) which is affiliated research centre of London University (Brunsdon, C., Corcoran, J., et al., 2007).
Figure 2. Crime Mapping Process
Figure 3. Screen shot of CrimeStat analysis (Levin, N., Levine, N., et al., 2004) In Korea, Crime Information Management System (CIMS) which is plug-in of Crime Stat and Geopros is commonly used for crime analysis.
2.2 Literature Review
Regarding verification of the environmental factors causing crime occurrence, there are many researches in urban and architectural planning field focusing on CPTED through statistical analysis of relationships among urban planning variables (building use, characteristics of street and spatial structure, etc.), social-economic variables and demographic variables using GIS and Space Syntax Theory, etc.
2.2.1 Studies on the Crime Analysis using GIS
Researches using GIS usually analyse the environmental conditions of crime occurrence among districts or cities by analyzing the layered variables in macro level. This method using GIS has a strong point that various analyses can be possible if provided with geographic variables. But because it is very complicated and time-consuming work to set up geographic variables, it is difficult to be used for generalized method. In spite of this problem and limitation, crime analysis researches using GIS are being activated because crime occurrence in itself has relation to geographical attributes. The essence of this method is hot-spot analysis. Among various methods, Kernel Density Estimation (KDE) is known to get the most consistent result in hot-spot analysis of crimes occurred on the road (Chainey, S., Tompson, L., et al., 2008)3. Through crime analysis researches using GIS, it has been known that crime is related to various factors including building use, distance from main road and bus stop, the deteriorated level of building, adjacency with park and empty lot, the ratio of vacant house, the density of streetlighting and existence of dead-end alley, etc (Brantingham, P. L. and Brantingham, P. J., 1993; Goff and Vigne, 2001; Eck, J., Chainey, S., et al., 2005).
2.2.2 Studies on the Crime Analysis using Space Syntax Theory
Natural surveillance and target accessibility are considered as major factors of crime occurrence or deterrence in field of CPTED and these factors can be analyzed with axial map to calculate integration value, connectivity value, control value and space depth of Space Syntax Theory. For this reason, crime
3The effectiveness of hot-spot analysis on the district level using Kernel Density Estimation has been verified steadily (Ackerman and Murray, 2003).
analysis researches using indexed of Space Syntax have been increased.
According to the literature review, it has been known that the traffic and pedestrian pattern or volume are closely related to natural surveillance, and the pattern or volume can be inferred by integration value. And also the traffic and pedestrian pattern or volume are related to land use and space structure, and those can be inferred by spatial configuration analysis using connectivity value, control value and space depth (Hillier and Hanson, 2005).For example, it is known that commercial areas are usually located in the centre of the region and residential areas are relatively located in the secluded region, and this contribution of land use can be inferred by axial map analysis. For this reason, the relationship among land use, traffic and pedestrian volume and crime occurrence can be inferred using Space Syntax Theory4.However as it is hard to get meaningful result by only Space Syntax analysis, the Space Syntax analysis integrated with GIS by parameter using axial lines is increased. According to those studies, it was known that there was much possibility of burglary occurrence in the area with low integration and connectivity value(Hillier and Sahbaz, 2005) or low integration and high space depth value within 2km from residence of criminal (Shu, 2000).
2.3 The Necessity of New Crime Risk Assessment Method
Although it is known that studies on crime pattern analysis by spatial analysis software and studies on searching the relation between urban and architectural planning elements and crime occurrence focusing on CPTED have been much processed, there has been little discussion about crime risk assessment and more specifically the positioning of CCTV for crime prevention.
The results of studies processed in field of urban and architectural planning are actively used as guideline for crime prevention focusing on CPTED. But the results of studies of crime risk assessment and hot-spot analysis dependent on the statistical analysis of the existing crime occurrence data are not activated as practical crime prevention measure, the reason is thought that crime analysis or risk assessment method has some problems as follows: 1) As less than half (about 1/3) of real occurred crime are being announced officially as crime statistical data, it is hard to trust the result of existing crime occurrence data analysis. In other words, there are a lot of hidden crimes. Therefore, depending only on the existing data analysis, it cannot be assessed the accurate crime risk of target area in which crime occurred but not recorded;2) A wrong or rough address information of spot on the crime occurred can make it hard to infer the hot-spot. Using spatial analysis software, the most important thing is geographical information of crime (street address). Therefore wrong or rough information such as 'alley in Sangdae-dong, Jinju city' or 'neighbourhood of Jinju city hall' unlike '296-76, Sangdae-dong, Jinju city' cannot be used for crime analysis and risk assessment;3) In redevelopment region and new town, the result of existing crime occurrence data analysis cannot be used for risk assessment. Because the physical, socio-economic environment and population composition are changed completely under those circumstances, it is necessary to assess crime risk through a new analysis measure; 4) Because the hot-spot analysis is a macroscopic analysis, the result of that cannot be classified by crime risk grade in micro area such as street and intersection. Therefore if CCTV positioning is determined by only hot-spot analysis, its positioning would be
4It was known that there was close relationship among the street crime, spatial configuration and pedestrian volume (Hillier and Hanson, 2005).
generally inferred but could not be inferred an accurate spot. For these reason, it is thought that it is necessary to study the other methodology for crime risk assessment and CCTV positioning on microscopic area in new perspective.
3. CRIME RISK ASSESSMENT THROUGH MLRA METHOD
3.1 Summary of Multi-Layered Risk Assessment (MLRA) Method
It is impossible to assess crime risk exactly because crime is a complicated social phenomenon and is affected by many uncertain parameters. By this reason, there were few researches regarding quantitative and effective risk assessment.
But crime risk assessment is certainly necessary for urban safety management, this assessment should be processed. In this respect, this study proposes the new methodology to assess crime risk integrated with the existing methods and various factors. And this methodology is named as ‘Multi-Layered Risk Assessment (MLRA)’ because it uses the various factors layered on GIS. The result of MLRA represents a visual graphic for easy interpretation after grading the crime risk.
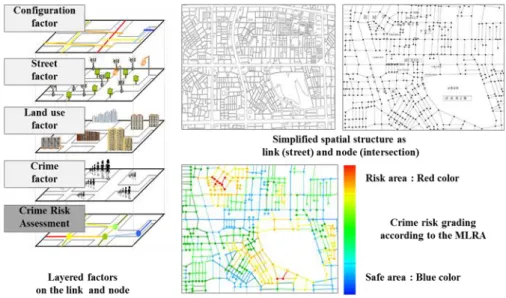
To grade crime risk in space, it is necessary to decide how to analyze the spatial structure. Generally, urban space is composed of streets, intersects, and blocks formed by streets and intersects. Therefore, complicated spaces can be analysed with simplified method by considering streets as links and intersects as nodes. The MLRA method uses the simplified method with attributed value applying specific algorithm. The reason for this is that most crimes except burglary occur in streets and CCTVs are usually installed at streets and intersects5.
5In the criminology aspect, most crimes occur on the street and criminal considers the street and intersection as an escape route. In urban and architecture aspect, human behaviour takes place in the space composed of point (intersection), line (street) and plane (block).
Therefore it is thought that crime risk assessment method by classification space with street and intersection is a reasonable method.
Figure 4. Example of MLRA process
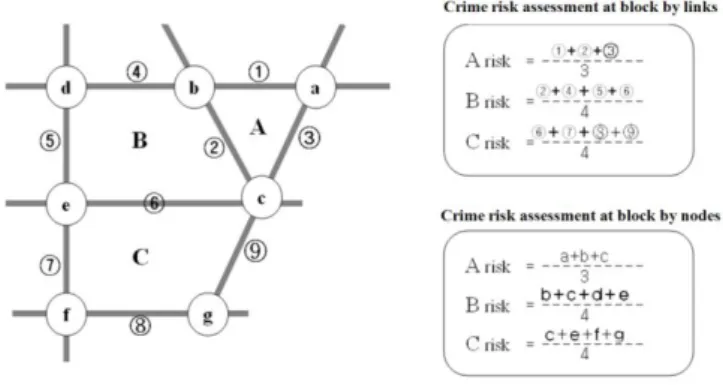
Figure 5. Summary of crime risk assessment at streets, intersects and blocks
3.2 Crime Risk Assessment Variables and Method
3.2.1 Crime Risk Assessment Variables
Variables to assess crime risk of each street are classified by crime factor (street crime and burglary), configuration factor (integration value of Space Syntax), land use factor (ratio of commercial building and distance to school) and street factor (street width and number of streetlight). And attributes of the variables are summarized by CPTED principle such as ‘the higher the surveillance opportunity is, the lower the crime risk will be’. And the hypothesized attributes are as follows: 1) regarding crime factor, it is supposed that the higher the crime ratio is, the higher the crime risk will be; 2) regarding configuration factor, integration value by Space Syntax that has been proved to be related closely to crime occurrence by previous researches is to be used. It can be inferred that the higher the integration value, the lower the crime risk will be because pedestrian volume inferred from integration value is related to natural surveillance; 3) regarding land use factor, it is supposed that the higher the ratio of commercial buildings is, the lower the crime risk will be because pedestrians led by those can make higher possibility of natural surveillance. And it is supposed that crime risk will be higher when there is a school in the site.
This reflects the possibility of violence or burglary by students. For this assumption, risk level around school is set by 50m radius such as 50m, 100m and 150m to assess crime risk; 4) regarding street factor, it is supposed that the wider the street is, the lower the crime risk will be. In the case of street lighting, the lower the interval of street lighting is, the lower the crime risk will be.
Variables and factors above are assigned with weighed value per each importance and a functional formula is set up to be used at GIS. The crime risk by these factors are graded into “100(very risky) to 0(very safe)” to be easily understood visually.
3.2.2 Method to set up weighed value of each variables and to assess crime risk
Linear interpolation is used to calculate variables for crime risk assessment.
Interpolation is a method to estimate function value f(xi) for arbitrary parameter value xi which is within the range of known data points of parameters xi (i = 1, 2, …, n), when the function is not complete such as y=f(x) and the parameter values (xi)s are known. This is one of the easiest method to get wanted result using a linear function (y = ax + b).
The characteristics of interpolation are to reflect existing condition of a region and to standardize data. And also it can be used for comparison analysis with the other region applied the same data because it draws median value of each variable based on the maximum and minimum value of it. And it can resolve the difficulty in comparison when the standard units of the variable are different each other. If range of each variable is set between 100and0point using interpolation based on the maximum and minimum, all variables can be compared within the range. In this study, the linear interpolation is thought to be appropriate as basic formula for MLRA method because the relationship between crime and related factors is unknown as whether it is linear, quadratic or cubic function.
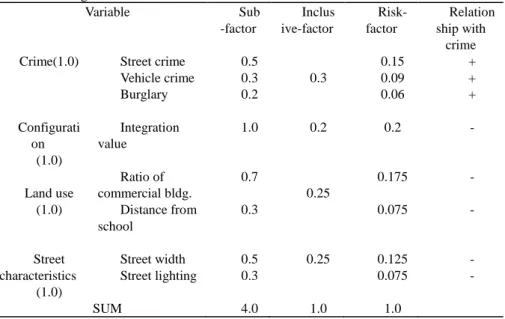
Table 1.Weighed value of each factor for MLRA method
Variable Sub
-factor
Inclus ive-factor
Risk- factor
Relation ship with
crime Crime(1.0) Street crime 0.5
0.3
0.15 +
Vehicle crime 0.3 0.09 +
Burglary 0.2 0.06 +
Configurati on
(1.0)
Integration value
1.0 0.2 0.2 -
Land use (1.0)
Ratio of commercial bldg.
0.7
0.25
0.175 -
Distance from school
0.3 0.075 -
Street characteristics
(1.0)
Street width 0.5 0.25 0.125 -
Street lighting 0.3 0.075 -
SUM 4.0 1.0 1.0
The sum of inclusive-factors drawn from function based on the interpolation such as crime, configuration, land use and street factor is set to 1 point. Since this is the method to assess crime risk, weighed value of the crime factor is set to 0.3 and that of configuration factor by integration value which is used to infer the crime risk from pedestrian volume is set to 0.2. And land use factor and street factor are weighed value of 0.25 because influence of those to crime is judged to be similar from each other.
And also the sum of sub-factors of inclusive-factor is set to 1 point. Weighed value of the street crime is set to 0.5 under assumption that CCTV generally watches criminal behaviour on the street, that of crime related vehicle is 0.3 and that of burglary is 0.2. Integration value is weighed 1 because integration value (r = n) is only used for configuration factor. Weighed value of commercial building is set to 0.7 and that of school is 0.3. Weighed value of street width is 0.5 and that of street lighting is 0.5.
The relationship between crime and variables is expressed as + when the value of variable is positive related to crime risk and it is –for inverse case.
4. CRIME RISK ASSESSEMENT AND CCTV INSTALLATION ON RESEARCH AREA 4.1 Research Area
Yeonsoo-1-dong, Incheon city was selected as the research area and field survey was carried out to identify factors hard to verify in maps such as street lighting, spatial structure and building use, etc.
It was found that the area was composed of residential buildings, residential- commercial buildings (commercial on the ground level and residential on the second or higher level) and commercial buildings. In the middle of the area, there was T-shaped circulation road and along the road, commercial buildings and street lightings were located.
Figure 6. The distribution of buildings, street lightings, and street trees
4.2 Discussion of results
It was found that the research area was composed of 139 streets (links) and 87 intersections (nodes) through analysis by simplifying spatial structure of the area into link and node.
Figure 7. Simplified spatial structure of the research area 4.2.1 Crime risk assessment by crime factor
In this study, the hot-spots of crime (street crime, vehicle crime, and burglary) occurred in the research area in 2007 were analyzed. The GIS ArcMap 9.3 was used to analyze crime spots.
Figure 8.Crime spots in the research area in 2007
For the risk assessment by crime factor, the point of crime occurrence is matched up the near street and the result shows in figure. 9 that visualized as various colour. Red lines show streets with much crime occurrence (high crime risk) and blue lines do those for inverse case (low crime risk).
Figure 9. The result of crime risk assessment by crime factor 4.2.2 Crime risk assessment by configuration factor
Crime risk by configuration factors was assessed based on the general principal that the higher the integration value is the more the pedestrians are.
That is to say, it was inferred that the possibility of surveillance changes according to spatial structure. It was visualized as below that red lines show streets with more pedestrian volume (safer street) and blue lines do those with less volume (more dangerous street)6.
6 For the factor analysed through Space Syntax, red line shows lower crime risk unlike other factors of which red line shows higher crime risk. The reason is that the result of Space Syntax is applied as it is. Red line shows higher integration value in Space Syntax.
Figure 10. The result of crime risk assessment by configuration factor 4.2.3 Crime risk assessment by land use factor
Rectangles are commercial or residential-commercial buildings. For the risk assessment by land use factor, the point of building was matched up to the near street. Because it was premised that the more commercial buildings were the more the pedestrian volumes would be, and this increased the possibility of natural surveillance. Therefore the streets with higher commercial building ratio are blue (lower crime risk) and those with lower ratio are red (higher crime risk) as shown below.
Figure 11. The result of crime risk assessment by land use factor: commercial building ratio
Meanwhile, there are two schools across the main street in the south. Crime risk by school factor is assessed through the formula per 50m. The result shows that bottom left and bottom right areas have higher risk and the areas the further from schools towards north have lower risk.
Figure 12. The result of crime risk assessment by land use factor: distance from school 4.2.4 Crime risk assessment by street factor
In case of street lightings, street lightings were presumed to be more likely to reinforce natural surveillance. The result shows that crime risk on the street without lightings is high.
Figure 13. The result of crime risk assessment by street factor: the number of street lightings
Streets are classified from 1st grade (wider) to 5th grade (narrower) in Korea and the research area is composed of three kinds of street: 1st, 2nd and 4th. The result shows that the inner streets with narrow width are risky (red color) and the main streets and the circulation roads with wide width are safe (blue and green color).
Figure 14. The result of crime risk assessment by street factor: width of street
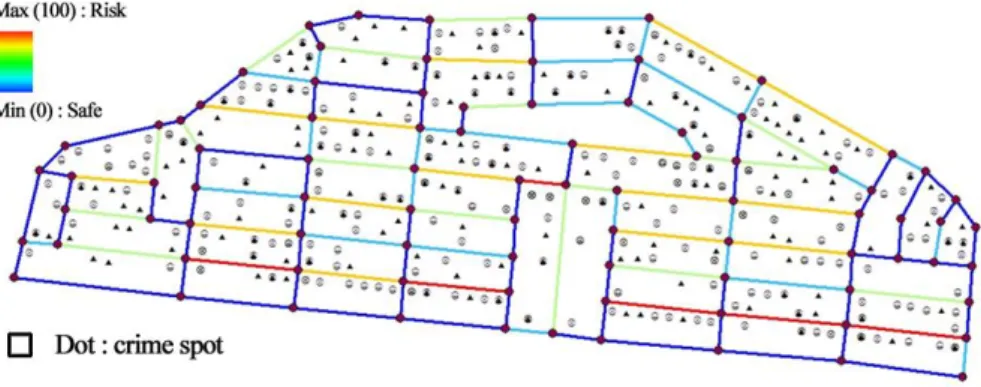
4.2.5 Crime risk assessment through MLRA method
Gathering individual results, crime risk per each street through MLRA method was assessed. Red lines show streets with high crime risk and blue ones show low crime risk.
Figure 15. Crime risk of streets assessed through MLRA method
Crime risk at each intersection is assessed by average value of streets connected to those. Red dots show intersections with high crime risk and blue ones show low crime risk.
Figure 16. Crime risk of intersections assessed through MLRA method
4.3 CCTV Installation through MLRA Method
The process of CCTV installation through MLRA method is as follows.
Figure 17. The process of CCTV installation
As the CCTV positioning is shown below, some CCTVs are allocated first to intersections of the main street which is entrance to target area and others are allocated to intersections according to crime risk grade in second priority. By the way, where the streets are too long to exceed the visible range of CCTV, it can be installed somewhere in between the two intersections and the spacing depends on the performance of CCTV. The locations of 20 CCTVs are as shown in figure 18.
Figure 18. The locations of 20 CCTVs on the target area
The ‘+’ marks indicate where CCTVs are installed. If the range of CCTV’s surveillance overlaps according to the visibility range, some CCTV can be eliminated for effective surveillance. For example, because the surveillance ranges of CCTV 1, 2 and 3 overlap as shown in figure 18, the CCTV 2 can be eliminated and installed other risk point.
Figure 19. The comparison of CCTV positions and hot-spots
It is inferred that the CCTV positions through MLRA method correspond with hot-spots by approximately 50% as shown in figure 19. This result can be interpreted that the correspondence comes from the highly weighed crime values.
Therefore, it is necessary to study about the method of crime risk assessment without crime factor through succeeding research.
5. CONCLUSION
Korea is ranked 24th in quality of life among 30 OECD countries notwithstanding the top 10 ranked for economic size evaluation. But it is a pressing question to develop social security measures including crime prevention measure because one of the most significant current discussions in Korea is the crime problem.
In the crime prevention aspect, it is necessary to develop technology and to support research such as ‘crime analysis and crime risk assessment methodology’, ‘making a safe society by application of crime prevention through environmental design on vulnerable areas and facilities’, ‘optimized and efficient technology for crime prevention facility such as CCTV’ and ‘integrated urban crime prevention system design’ for public welfare and safety. Especially, it is thought that attention and support for crime analysis and crime risk assessment methodology are urgent and necessary.
The essence of CPTED is to prevent crime and minimise damage by controlling and eliminating various situational factors that provide crime opportunity. Therefore, it is necessary to assess crime risk on target area objectively and accurately so that CPTED may be effective crime prevention measure.
Existing crime risk assessment was processed through the analysis of criminal records. This method is possible because the opportunistic crime focused on environmental criminology occurs in specific patterns in the frequency and distribution where present conditions are maintained. But criminal records have their limitations and not all the number of crimes occurred are recorded, therefore, alternatives for crime risk assessment are needed in case there is no criminal records, and also for areas that have undergone redevelopment (and reorganization) of the existing urban configuration, making the previous data meaninglessness. For this reason, it is important that crime risk is assessed without criminal records and it should be processed with crime- related variables, which consists of various factors.
In this study, MLRA method for crime risk assessment on the street and intersection of urban space is proposed based on the CPTED principle. It is the
characteristic of MLRA method to enable to grade the crime risk and assess crime risk on the micro level (area) by various data analysis focused on the street and intersection contrary to the existing method that is inferred the hot- spot through only crime data analysis. But this method has some problems such as complexity of methodology and insufficient verification of variables, etc. In conclusions, it is considered that the MLRA method is worthwhile on behalf of the existing crime analysis and risk assessment has both its merits and demerits such as follows: The pros of the MLRA method are 1) applicable without criminal records, 2) various analysis ranges from large urban area to small block area, 3) and optimization of CCTV installation. The cons are 1) insufficient verification of risk assessment variables and functional formula for MLRA method, 2) limited method with focused physical factors, 3) and impossible method without geographical data used in GIS. Therefore, following research has to be succeeded for improvement of above problems. If following research related crime risk assessment similar to MLRA method is continued, it may be able to apply the fitted crime prevention measures and especially to install the CCTVs according crime risk grade and to designate the optimized route of patrol.
ACKNOWLEDGEMENT
This research was supported by Basic Science Research Program through the National Research Foundation of Korea (NRF) funded by the Ministry of Science, ICT and Future Planning (NRF-2013R1A1A1012738).
REFERENCES
Ackerman, W. V. and Murray, A. T. (2003). “Assessing spatial patterns of crime in Lima, Ohio”, Cities, 21(5), 423-437.
Brantingham, P. L. and Brantingham, P. J. (1993). “Nodes, Paths and Edges: Considerations on the complexity of crime and the physical environment”, Journal of Environmental Psychology, 13(1), 3-28.
Chris Brunsdon. C., Corcoran, J., et al. (2007). “Visualizing space and time in crime patterns:
A comparison of methods”, Computers, Environment and Urban Systems, 31, 52-75.
Eck, J. E., Chainey, S., et al. (2005). Mapping Crime: Understanding Hot Spots, National Institute of Justice, Washington, DC.
Groff, E. R. and Vigne, N. G. (2001). “Mapping an opportunity surface of residential burglary”, Journal of Research in Crime and Delinquency, 38(3), 257-278.
Hillier, B. and Hanson, J. (2005). The social logic of space, Cambridge University Press, London.
Hillier, B. and Sahbaz, O. (2005). “High resolution analysis of crime pattern in urban street networks: an initial statistical sketch from an ongoing study of a London”, Proceedings of the 5th international symposium on space syntax, Delft, Netherlands, Purdue University Press, Indiana, 451-478.
Hirschfield, A. and Browers, K. J. (1997). “The development of a social, demographic and land use profile for areas of high crime”, British Journal of Criminology, 37(1), 103-120.
Kang, S. J. (2013). “Crime Prevention in Ethnic Areas Focusing on Crime Prevention through Environmental Design”, Journal of Building Construction and Planning Research, 1(1), 15-23.
Levin, N., Levine, N., et al. (2004). CrimeStat III-A spatial statistics program for the analysis of crime incident locations, U.S. Department of Justice, Houston.
Reno, J., Marcus, D., et al. (1999). Mapping Crime: principle and practice, National Institute of Justice, Washington, DC.
SmonChih-FengShu, S. F. S. (2000). “Housing layout and crime vulnerability”, Urban Design International, 5(2), 178-188.
Spencer Chainey, S., Tompson, L., et al. (2008). “The utility of Hotspot Mapping for predicting spatial patterns of crime”, Security Journal, 21, 4-28.