Effect of herbaceous biomass and food waste addition in anaerobic digestion of sewage sludge
著者 古 ??
著者別表示 Gu Tingting journal or
publication title
博士論文要旨Abstractおよび要約Outline 学位授与番号 13301甲第4482号
学位名 博士(学術)
学位授与年月日 2016‑09‑26
URL http://hdl.handle.net/2297/46605
博 士 論 文
Effect of herbaceous biomass and food waste addition in anaerobic digestion of sewage sludge
下水汚泥の嫌気性消化における草本系バイオマス および食品廃棄物の混合効果
金沢大学大学院自然科学研究科 環境科学専攻 古 婷婷
Effect of herbaceous biomass and food waste addition in anaerobic digestion of sewage sludge
下水汚泥の嫌気性消化における草本系バイオマスおよび食品廃棄物の混合効果自然科学研究科 環境科学専攻 古 婷婷
1. Introduction
The generation of sewage sludge is increasing rapidly around the world, and there is a great need for effective methods to treat the existing and future accumulations of sewage sludge. In recent years, 220 million tons (dry weight) of sewage sludge is being generated every year in Japan. Approximately 80% of the sludge solids is organics, and only 23.9% is used as biomass.
Anaerobic digestion (AD) is suggested as an effective method for treating sewage sludge, by which the organic contents can be biodegraded and methane gas can be produced and used as energy. AD has thus been widely applied in many wastewater treatment plants (WWTPs) throughout the world. In recent years, based on the AD of sewage sludge, addition of other biomass in the sludge digestion process to conduct co-digestion has drawing attentions all over the world. Target biomass includes kitchen garbage, food waste, agroforestry waste, animal excreta, etc. By co-digestion of sludge and waste biomass, it is possible to achieve more effective utilization of waste biomass, reduction of treatment cost, increasing in biogas yield and reduction of carbon dioxide emission, which could contribute to build low carbon and resource recycling-based society. Especially in some rural areas, where biomass abundance is quite large, effective conduction of the co-fermentation can be expected. In the present study, the co-digestion of sewage sludge generated from small-scale sewage treatment facilities, and other kinds of waste biomass generated in local town, was proposed. The study focused on the methane gas recovery of several kinds of biomasses, the digester performance of co-digestion, and the variation of dissolved organic compositions and microbial community in the anaerobic digestion, with the addition of biomass. First, a high solid anaerobic digestion of sewage sludge generated from oxidation ditch process (OD), which is widely applied in small-scale sewage treatment facilities, and fried tofu which is generated as
waste from a tofu manufacturing plant in local town, was conducted under thermophilic condition. The biogas production, digesting performance under different organic loading, and the variation of microbial community were studied. Then, a co-digestion of raw sludge and rice straw was conducted. The biogas production of rice straw, and the dewaterability of digested sludge were evaluated, to study the effect on the dewaterability of digested sludge due to rice straw addition in the sludge digestion process. To further study the effect of rice straw addition on sludge digestion, a co-digestion of sludge and rice straw was conducted focusing on the variation of dissolved organic matters (DOM) in the supernatant of digested sludge with the addition of rice straw.
2. Materials and methods
2.1 Thermophilic co-digestion of OD sludge and fried tofu
Two lab-scale anaerobic reactors, each with a working volume of 3 L, were used in the experiment. Operating temperature was 55°C and sludge retention time (SRT) was 10 days.
Run 1-1 was set as a control, and the feed
substrate was OD sludge. In Run 1-2, a mixture
of OD sludge, raw fried tofu and dry fried tofu
was fed as a ratio of 1:0.39:0.06 (dry weight
basis). The substrates TS in Run 1-1 was
increased gradually, and in Run 1-2, input TS
was increased gradually and then decreased in
period IV to study whether the inhibited
methane fermentation could recover. Operating
condition is shown in Table 1. DNA samples of
digested sludge during the stable phases of each
period were extracted, and PCR-DGGE
technology was applied to study the bacteria
and archaea community. Methane yields and
content, total solids (TS), volatile solids (VS),
dissolved organic carbons (DOC), total
dissolved nitrogen (DTN), volatile fatty acids
(VFAs), pH of digested sludge were analyzed
regularly.
Table 1 Operating conditions of co-digestion experiment of OD sludge and fried tofu
2.2 Mesophilic co-digestion of raw sludge and rice straw (10 L-scale)
Two plastic tanks with each working volume of 10 L were used as reactors. Operating temperature was 35°C and SRT was 25 days.
Acting as a control, Run 2-1 was fed with sewage sludge, while Run 2-2 was fed with the mixture of sludge and rice straw pre-treated by softening and compression. The mixing ratio of sewage sludge to rice straw was 1:0.5 (dry weight basis). Input TS of sludge was 30 g/L.
After 129 days of operation, to evaluate the dewatering characteristics of digested sludge, a dewatering experiment was conducted. First, a coagulant selection test was conducted using five kinds of coagulants, and two coagulants showing better dewatering performance were selected. In the dewatering experiment, selected coagulants were diluted and added into 3 L of sludge and mixed uniformly. When no more flocs increased, digested sludge was filtered by gravity, and then dewatered by a belt filter press. Specific filtration rate and water content of dewatered sludge were used to evaluate the dewaterability of digested sludge.
2.3 Mesophilic co-digestion of raw sludge and rice straw (1 L-scale)
Three digesters of sludge digester (Run 3-1), rice straw digester (Run 3-2) and a co-digester (Run 3-3) were operated in this experiment.
Digestion was conducted at 35°C. Working volume of each digester was 1 L. SRT was 25 days. TS of sludge was 30 g/L and rice straw was 15 g/L. Produced biogas was collected in a gas pack, and the gas volume and composition were measured occasionally. Analysis of pH, TS, VS, DOC, organic acids and ions of digested liquid were conducted once per week.
Concentrations of proteins and humic matter were measured according to Frolund et. al.
(1995). The concentrations of carbohydrates were measured by Phenol–Sulfuric Acid method. Excitation-emission matrix (EEM) fluorescence spectroscopy was used to examine
the dissolved organic matters (DOM) in the digested liquor. On Day 115, a biodegradability evaluation batch experiment was conducted.
Digested sludge of each reactor was centrifuged and supernatants were mixed with activated sludge (10:1 v/v) and cultivated under aerobic condition. Samples were taken at 0, 6, 24 and 48 h and filtered through 0.2μm membrane filter. Concentrations of COD, proteins, humic matter, VFAs and carbohydrates were measured.
3. Results and discussion
3.1 Thermophilic co-digestion of OD sludge and fried tofu
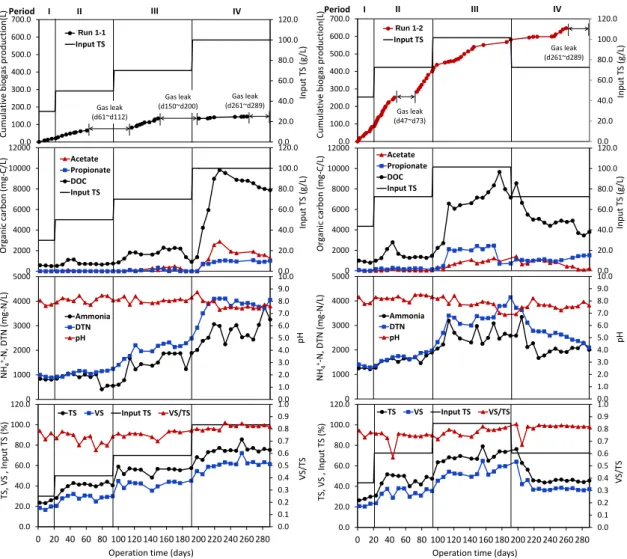
The thermophilic digestion experiment was performed for 288 days. Cumulative biogas production, concentrations of DOC, VFAs, DTN, NH 4 + -N, TS and VS are shown in Figure 1, and the results of methane yields and VS removal rates are summarized in Table 2. The biogas collection was failed during day 61-112, 150-200 and 261-289 in Run 1-1; and during day 47-73 and 261-289 in Run 1-2, due to the leak problem of gasbags. Results of methane yields were calculated excluding data of gas leaking periods, and VS removal rates during period I was not calculated due to the short SRT.
3.1.1 Digesting performance of sludge In the sludge digestion (Run 1-1), in periods I and II, TS and VS were degraded stably, and average VS removal rate of period II was 31%.
Stable generation of biogas was achieved, with methane yields of 0.08 and 0.05 L/g-TS, respectively. pH was not controlled and maintained stably during the periods and NH 4 + -N concentrations were below 1050 mg/L.
In addition, no VFAs were detected. In period III, input TS was increased to 70 g/L, and OLR was 5.9 kg-VS/m 3 /d. Concentrations of DOC, DTN increased, and acetate and propionate with concentrations up to 470 and 330 mg/L detected from day114, respectively.
Parameter Period I Period II Period III Period IV Period I Period II Period III Period IV
Sludge TS (g/L) 30 50 70 100 30 50 70 50
Fried tofu TS (g/L) - - - - 13.5 22.5 31.5 22.5
OLR (kg/m 3 -VS/d) 2.5 4.2 5.9 8.5 3.8 6.3 8.8 6.3
Operation time (d) 1-20 21-93 94-191 192-288 1-20 21-93 94-191 192-288
Run 1-1 Run 1-2
Figure 1 Cumulative biogas production, variation of input TS, organic carbons, ammonium, DTN, and TS and VS of the digested sludge in the co-digestion experiment of OD sludge and fried tofu
Table 2 Results of CH 4 production rate, CH 4 yields and content, TS and VS removal ratios of digestion experiment of OD sludge and fried tofu
However, accumulation of VFAs disappeared after day 177. The VS removal rate and methane yield were the same as those of period II, and sludge digestion was considered stable with OLR up to 5.9 kg-VS/m 3 /d. In Period IV, when the substrate concentration was increased to 100 g/L, and OLR was 8.5 kg-VS/m 3 /d, the generation of biogas almost stopped, and VS
removal rate decreased to 27%. At the initial stage of period IV, a dramatic increase in DOC was observed. Accumulations of VFAs were also observed, and concentrations up to 2280 mg-C/L of acetate, 1070 mg-C/L of propionate were detected. Meanwhile, decrease in pH was observed. In addition, concentrations of TN and NH 4 + -N also showed an obvious increase with
0.0 20.0 40.0 60.0 80.0 100.0 120.0
0.0 100.0 200.0 300.0 400.0 500.0 600.0 700.0
Input TS (g /L )
Run1Input TS
Cum ul at ive bi oga s pr oduct io n(L ) Period I II III IV
Gas leak (d61~d112)
Gas leak
(d150~d200) Gas leak (d261~d289)
0.0 20.0 40.0 60.0 80.0 100.0 120.0
0.0 100.0 200.0 300.0 400.0 500.0 600.0 700.0
Input TS (g /L )
Run2Input TS
Cum ul at ive bi oga s pr oduct io n(L ) Period I II III IV
Gas leak (d47~d73)
Gas leak (d261~d289)
0.0 20.0 40.0 60.0 80.0 100.0 120.0
0 2000 4000 6000 8000 10000 12000
Input TS (g /L )
Acetate Propionate DOCInput TS
Or ga ni c ca rbo n (m g- C/ L)
0.0 1.0 2.0 3.0 4.0 5.0 6.0 7.0 8.0 9.0 10.0
0 1000 2000 3000 4000 5000
pH
Ammonia DTNpH
NH
4+-N , DT N (m g- N/ L)
0.0 0.1 0.2 0.3 0.4 0.5 0.6 0.7 0.8 0.9 1.0
0.0 20.0 40.0 60.0 80.0 100.0 120.0
0 20 40 60 80 100 120 140 160 180 200 220 240 260 280
VS /TS
Operation time (days)
TS VS Input TS VS/TSTS ,VS , Input TS (%)
0.0 20.0 40.0 60.0 80.0 100.0 120.0
0 2000 4000 6000 8000 10000 12000
Input TS (g /L )
Acetate Propionate DOCInput TS
Or ga ni c ca rbo n (m g- C/ L)
0.0 1.0 2.0 3.0 4.0 5.0 6.0 7.0 8.0 9.0 10.0
0 1000 2000 3000 4000 5000
pH
Ammonia DTNpH
NH
4+-N , DT N (m g- N/ L)
0.0 0.1 0.2 0.3 0.4 0.5 0.6 0.7 0.8 0.9 1.0
0.0 20.0 40.0 60.0 80.0 100.0 120.0
0 20 40 60 80 100 120 140 160 180 200 220 240 260 280
VS /TS
Operation time (days)
TS VS Input TS VS/TSTS ,VS , Input TS (%)
Operation period CH
4production rate (L/d)
CH
4yield (L/g-TS)
CH
4yield of tofu mixture (L/g-TS)
Average CH
4content (%V/V)
VS removal ratio of total input (%)
VS removal ratio of tofu mixture (%)
Period I 0.70 0.08 - 67 - -
Period II 0.81 0.05 - 63 31 -
Period III 0.98 0.05 - 59 31 -
Period IV 0.10 0.00 - 54 27 -
Period I 2.87 0.22 0.54 65 - -
Period II 3.87 0.18 0.45 59 46 64
Period III 1.53 0.05 0.06 50 38 58
Period IV 0.03 0.00 - 57 43 -
Run 1-1
Run 1-2
Run 1-1 Run 1-2
the increase of substrate concentration. NH 4 + -N concentrations sharply increased to 3760 mg/L in period IV. These results indicated that methane fermentation was inhibited. The operating performance showed that at thermophilic temperature, stable operation of OD sludge could be possible when the substrate TS was below 70 g/L.
3.1.2 Co-digestion performance
In the co-digestion (Run 1-2), VS removal and methane yield of tofu mixture were calculated assuming that the degradation of sludge in Run 1-2 was the same as that of Run 1-1. In period I, methane yield of total input substrates was 0.22 L/g-TS, and approximately 0.54 L methane was generated from 1 g tofu mixture, and this result was close to the methane production potential, 0.55 L/g-TS that obtained in our previous study.
In period II, the input TS was increased to 72.5 g/L (OLR was 6.3 kg-VS/m 3 /d). Concentrations between 22-84 mg/L of acetate, and 160-280 mg/L of propionate were detected, and NH 4 + -N concentrations between 1270-1900 mg/L were detected. Methane yields of total input substrates and tofu mixture were 0.18 and 0.45 L/g-TS. Slight decrease in biogas production and accumulation of VFAs were observed in period II, however, approximately 64% of tofu mixture was degraded and 0.45 L CH 4 gas was generated from 1 g tofu mixture (0.52 L/g-VS), which was close with the theoretical methane yields of raw garbage, cow slurry and municipal waste (0.51, 0.54 and 0.47 L/g-VS, respectively), thus methane fermentation was suggested to be conducted stably in period II and waste fried tofu was considered as good biomass resource for methane recovery. In period III, a rapid increase in DOC was observed, and high concentrations of acetate (340-1220 mg/L) and propionate (460-2450 mg/L) were detected. During the same period, decrease in pH values was observed.
Meanwhile, a dramatic increase in NH 4 + -N concentration was observed, with concentrations up to 4150 mg/L were detected.
Since fried tofu contains high content of protein, the degradation of which was considered to contribute greatly to the high ammonia concentration in Run 1-2. Biogas generation almost stopped after day 145, and average methane yield of this period was 0.03 L/g-TS.
Meanwhile, methane gas production of tofu mixture was -0.01 L/g-TS, indicating that the
methane generation was suppressed in the period. It is indicated that ammonia inhibition occurred in period III. In period IV, substrate TS was decreased to the same as in period II decrease in DOC, VFAs, TN and NH 4 + -N concentrations were observed; and increase in methane content and VS removal rates were also obtained. However, compared with period II, higher concentrations of NH 4 + -N (1930-3300 mg/L), acetate (90-1400 mg/L) and propionate (920-1510 mg/L) were detected, and VS removal rate of 43% was lower than that of period II. In addition, recovery of biogas production was not observed. It is indicated that by decreasing the substrate concentration, inhibition to methane fermentation was mitigated slightly, but complete recovery was not obtained.
On the other hand, compare the co-digestion with the sludge digestion, during periods I and II, the addition of fried tofu significantly increased the biogas production and VS removal efficiency. The methane yields of total substrates increased by 175% and 260% in periods I and II, respectively; and the VS removal rates of total substrates in period II increased by 44%. In addition, methane yields of tofu mixture during stable periods were 6.8-9 folds of those of OD sludge, and thus waste fried tofu was considered as a good bioresource for methane recovery.
3.1.3 Microbial community analysis
The DGGE profile of microbial community is shown in Figure 2 (a).
(a) Bacteria profiles (b) Achaea profiles Figure 2 DGGE profiles of microbial community in the digestion of OD sludge and fried tofu.
The banding patterns showed that most bands detected during period I and II in Run 1-1 were similar to those of seed sludge, and some bands
B1 B2
B3
B4B5B6
B7 B8
Marker Ⅰ Ⅱ Ⅲ ⅣSludge seed
Run1 Run2
Ⅰ Ⅱ Ⅲ Ⅳ
A1 A2 A3A4 A5
A6 A7A8
Run 1-1 Run 1-2 Run 1-1 Run 1-2
(B1 and B4) disappeared when the input TS was increased; however, no significant change was observed with the change of organic loading rate. In period IV, methane fermentation was inhibited due to high ammonia concentration, but no obvious change of detected bands was observed, indicating that the bacteria was relatively resistant to the inhibition. On the other hand, the bacteria banding patterns of Run 2-2 showed that most bands detected in Run 1-2 were detectable in Run 1-1; however, with addition of fried tofu, Band B3 was significantly strengthened;
meanwhile, Band B4 disappeared. In the co-digester, most bands disappeared in period III, and then detected in period IV. The results revealed that the bacteria was inhibited at OLR of 8.8 kg-VS/m 3 /d; and when the substrate TS was decreased, inhibition to bacteria was recovered.
The archaea DGGE profile is shown in Figure 2 (b). The banding patterns showed that the addition of fried tofu had little effect on archaea community structure. On the other hand, the bands of archaea in Run 1-1 were the same during period I to III, which was in agreement with the result that anaerobic digestion of OD sludge was stable when input TS was below 70 g/L. However, most bands detectable disappeared in period IV, and this was considered to be caused by the inhibition to methanogens. The results in Run 1-2 also indicated that when input TS was decreased in period IV, some bands recovered. These results were in accordance with the results of the digesting performances. Sequence analysis results showed that Bands A1, A2 and A3 were close (99%) to Methanosarcina thermophile, which is an extremely anaerobic thermophilic archaeal and uses acetate to produce methane.
Bands A4 and A5 were close (98%) to Methanothermobacter thermautotrophicus, which uses H 2 and CO 2 to produce methane, and Bands A6 and A7 were close to Methanothermobacter crinale, which uses only H 2 to produce methane.
The results of microbial community analysis showed that in the sludge digestion process, bacteria was resistant to the inhibition while most methanogens were inhibited due to the high concentration of ammonia; in the co-digestion process, activity of both bacteria and archaea was affected by the inhibition; in
addition, the fried tofu addition showed an effect on the bacteria community structure, while little effect on archaea community structure was observed.
3.2 Mesophilic co-digestion of raw sludge and rice straw (10 L-scale)
3.2.1 Digesting performance
The digestion performance was evaluated based primarily on the pH, TS, VS, volatile fatty acids (VFAs), ammonia-nitrogen, methane yields and contents. During 129 days of operation, biogas was generated stably in both digesters as shown in Figure 3. The pH and DOC variation of digested sludge are shown in Figure 4, and the TS, VS of input substrates and output of digested sludge is shown in Figure 5. The figures showed that methane gas were generated stably in both runs during all periods.
pH values varied between 6.9~7.3 in Run 2-1 and 7.0~7.3 in Run 2-2, which was suggested optimal range for methane production bacteria.
After day 19, DOC concentrations of 90-180 mg-C/L was detected in Run 2-1, and 90~190 mg-C/L detected in Run 2-2. VFAs were quantified, and only acetate and propionate were detected. Concentrations of VFAs were detected Run 2-2 were below 10 mg/L.
Figure 3 Cumulative methane production of co-digestion of sewage sludge and rice straw (10 L scale).
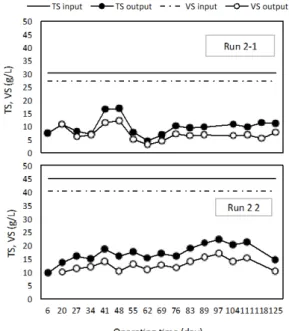
According to Figure 5, the TS and VS of digested sludge in Run 2-1 increased slightly during day 41 to day 48, but kept stable after day 48, suggesting the organic material was degraded stably during operation. In Run 2-2, the TS and VS of digested sludge increased slightly from day 76 to day 97, but it was relatively stable during all operating periods.
These results suggested that the digestion was conducted stably in both runs without organic acids accumulation or ammonium inhibition.
0 100 200 300 400 500 600 700
0 10 20 30 40 50 60 70 80 90 100 110 120 130
Cum ul ati ve m etha ne pr oduc tio n ( L)
Operating time (day)
Run 2-1 Run 2-2
Figure 4 Variations of acetate (ACE), propionate (PRO), DOC, NH 4 + -N and pH values of digested sludge in the co-digestion of sewage sludge and rice straw (10 L scale).
Figure 5 TS and VS of digested sludge in co-digestion of sewage sludge and rice straw (10 L scale).
Biogas production and VS removal efficiency results are summarized in Table 3. In the experiment, CH 4 production increased by 27%
by the addition of rice straw. Methane yield of total input substrate were 0.34 L/g-VS of Run 2-1 and 0.29 L/g-VS of Run 2-2; assuming that the methane yield of sewage sludge in Run 2-2 was the same as those in Run 2-1, approximately 0.18 L methane was estimated to
be produced from one gram of dry rice straw (TS base). This result was lower compared to the result of Nakakihara et al., which was 0.26 L/g (TS base). Since rice straw was collected and stored for long period use, the degradation of rice straw during storage period was suggested to be the cause of low methane production in this study.
Table 3 Results summary of co-digestion of sewage sludge and rice straw (10 L scale)
3.2.2 Dewatering experiment
The analysis results of digested sludge properties are shown in Table 4. By addition of rice straw, TS and fibrous materials contents of digested sludge shows significant increasing.
No significant difference of M alkalinity and anion degree, of which higher value shows higher coagulant dose ratio, was suggested. The normalized CST of Run 2-2 was 6.6 s L/g-TS, and the measurement of Run 2-1 was failed to conduct. Since larger normalized CST values suggested worse dewaterability, it could be suggested that the dewaterability of co-digested sludge was much better than that of digested sludge. Besides, the fibrous material (100 and 200 meshes sieves) contents in the co-digested sludge were greater than digested sludge of Run 1 by 410% and 223%, respectively, which also demonstrated that the dewaterability was better in the co-digested sludge.
In the coagulants selection test, coagulants were decided mainly based on the types of coagulants, coagulant dose ratio and water content of sludge cakes. Optimum coagulant dose ratio and water contents of sludge cakes are described in Figure 6. By using Coagulant A and E, lower coagulant dose ratios and water contents of sludge cakes were achieved, thus Coagulants A and E were used in the dewatering experiment.
The results of dewatering experiment are described in Table 5. Specific filtration rate and water content of dewatered sludge were used to evaluate the dewaterability of digested sludge.
0.0 1.0 2.0 3.0 4.0 5.0 6.0 7.0 8.0
0 100 200 300 400 500 600 700 800
6 20 27 34 41 48 55 62 69 76 83 89 97 104111118125 pH Operating time (day)
ACE PRO DOC NH4+-N pH
Run 2-1
0.0 1.0 2.0 3.0 4.0 5.0 6.0 7.0 8.0
0 100 200 300 400 500 600 700 800
6 20 27 34 41 48 55 62 69 76 83 89 97 104 111 118 125
Operating time (day) Run 2-2 AC E, P RO , D OC an d N H
4+-N co n. (m g- C/ L, mg -N /L)
Run 2-1 Run 2-2 CH
4production rate (L/day) 3.7 4.7
Average CH
4content (%) 58 56
CH
4yield of total substrates (L/g-VS) 0.34 0.29 CH
4yield of rice straw (L/g-VS) - 0.18
TS removal ratio (%) 62 56
VS removal ratio (%) 75 66
Table 4 Analysis properties of digested sludge.
Figure 6 Optimal addition ratio of each coagulant and water contents of sludge cake in the coagulant selection test.
Table 5 Results of dewatering experiment.
The specific filtration rate (SFR: dry weight of dewatered sludge in unit time and unit filter fabric length) and water content of sludge cakes are main factors to characterize the dewatering performances in the WWTP. In the case of using Coagulant A, the SFR of Run 2-1 and Run 2-2 were 93.8 and 170 kg-TS/mh, respectively. By the addition of rice straw, the SFR was increased by 81.2%, and water content of sludge cakes decreased by 8.2%. In the case of using Coagulant E, the SFR increased by 174.2% and water content decreased by 13.4%, respectively. Since higher filtration rate indicates higher capacity for sludge dewatering, and in this study, by the addition of rice straw, the filtration rate was increased significantly with using either coagulant. It revealed that dewaterability of
digested sludge was improved significantly by the addition of rice straw.
3.3 Mesophilic co-digestion of raw sludge and rice straw (1 L-scale)
3.3.1 Digesting performance
Figures 7 (a)-(c) show the cumulative biogas production in the continuous experiment.
Biogas was generated stably in Runs 3-1 and 3-3, while the generation in Run 3-2 was low.
CH 4 yields of each substrate are summarized in Table 6, CH 4 of Run 3-2 was calculated using the data after pH adjustment, and CH 4 yield of rice straw in Run 3-3 was calculated supposing that the degradation of sludge was the same as that in Run 3-1. Average CH 4 yield of raw sludge and rice straw was estimated as 0.31 and 0.26 L/g-TS, respectively, and the result was in accordance with previous study. However, CH 4
yield in Run 3-2 was 69.2% of that in Run 3-3.
Figures 7 (d)-(f) show the variation of COD Cr
of initial substrates, digested sludge and removal rates. COD Cr removal rate of Run 1 was the highest, varying between 58.3%-67.8%, and the value in Runs 3-2 and 3-3 varied between 37.5%-43.5% and 55.4%-66.0%, respectively. The degradation of rice straw was poorer compared with sewage sludge. COD Cr
removal rate of rice straw in Run 3-3 was approx. 1.9 folds comparing with that of Run 3-2. This result was in accordance with methane yield. Figures 7 (g)-(i) show the variation of DOC and VFAs of the digested sludge. VFAs accumulation was observed in Run 3-2, and pH decreased. After pH adjustment from day 120, decreasing in VFAs was observed and then disappeared. pH also increased and gas generation slightly increased.
As summarized in Table 6, TS, VS, and COD Cr
removal rates of rice straw in Run 3-3 were significantly higher than those of Run 3-2, indicating that rice straw was not suitable for single digestion.
Table 6 Results summary of co-digestion of sewage sludge and rice straw (1 L scale).
Runs Coagulant Unit mass (g/0.01 m
2)
Thickness (mm)
Water content (%)
Specific filtration rate (kg DS/mh)
Run 2-1 47.4 7 75.2 93.8
Run 2-2 62.9 10 69 170
Run 2-1 41.2 5 81.8 55.1
Run 2-2 61.1 9 70.8 151.3
Coagulant A Coagulant E
Parameters Run 2-1 Run 2-2
pH 7.1 6.9
M alkalinity
(mg-CaCO
3/L) 1900 2000 Anion degree ( mEq/g-TS) 0.6 0.4
SS (mg/L) 8200 17400
TS ( mg/L) 9900 20400
VTS (%) 68.7 71.5
Crude protein (%/TS) 28 21
Crude fiber (%/SS) 6.4 30.3
Fibrous material (100 mesh)(%/SS) 6.9 35.2 Fibrous material (200 mesh)(%/SS) 12.3 39.8 Normalized CST (s・L/g-TS) - 6.6
0.0 1.0 2.0 3.0 4.0 5.0 6.0 7.0
60 65 70 75 80 85 90 95 100
Coagulant A Coagulant B Coagulant C Coagulant D Coagulant E
Optimal coagulant dose ratio (w.t%)
Water content of sludge cake (%)
Run 2-1 Optimal coagulant dose ratio Run 2-2 Optimal coagulant dose ratio
Run 2-1 Water content of sludge cake Run 2-2 Water content of sludge cake
Figure 7 Biogas production: (a)-(c); COD Cr variation and removal rate: (d)-(f); DOC variation: (g)-(i) in the continuous experiment. RS refers to rice straw in Run 3-3 (Figure 1 (e) and (f)).
3.3.2 Dissolved organic composition
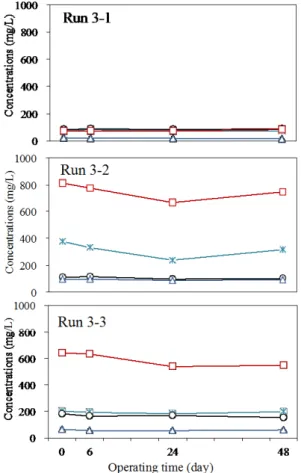
Table 7 shows the average concentrations of DOC, soluble COD, carbohydrates, proteins, humic matter, acetate and propionate in the digested sludge of each reactor. In Run 3-1, most DOM could be explained as carbohydrates, proteins and humic matter, which were estimated to be produced by the decomposition of bacterial cells. In Run 3-2, high concentrations of DOM was detected.
Besides VFAs, most organic content was humic
matter, which was estimated to be generated from the decomposition of the rice straw.
Although the addition of rice straw in Run 3-3 also contributed significantly to the organic concentration, with increasing in humic matter by over 10 folds comparing with that of Run 3-1, the content was lower than that of Run 3-2.
These results suggested that some organic matter eluted from rice straw, which could not be degraded in single digestion, was degraded in the co-digestion.
Table 7 Concentrations of carbohydrates, proteins and humic matter of digested sludge.
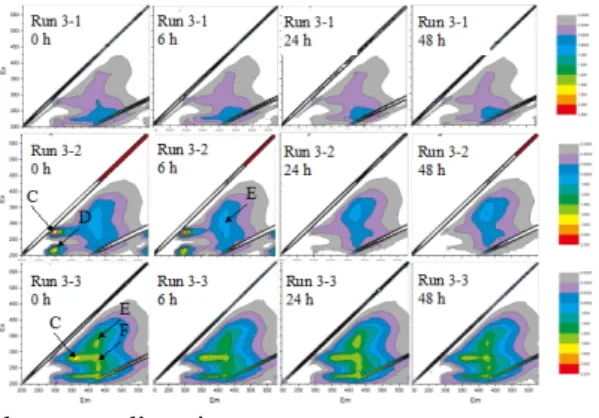
Figure 8 shows the EEM spectra of the supernatant of input sludge and rice straw, and digested sludge on day 115. All samples were diluted by 20 folds before EEM analysis. In the input raw sludge, four peaks (A-D) were recognized. According to Maie (2009), peaks A
and C belong to tyrosine-like matter and tryptophan, respectively. Chen et al. (2003) reported that the peaks were related to the soluble microbial by-product-like substances.
Peaks B and D were estimated as protein-like
matter according to Fukushima et al. (2001)
and Komatsu et al, (2008). In raw sludge sample, four detected peaks were protein-like matter or products of proteins degradation, it was indicated that these protein-like substances were produced by microbial decomposition. In the rice straw leachate, a peak (E) was recognized in Ex/Em of 310-320/420-430nm, which was reported as visible-humic matter.
(Maie, 2009) According to Stedman and Makager (2005), the humic matter is terrestrial original and not detected in treated wastewater.
In the sludge digestion (Run 3-1), peaks A-D that were detected in the input raw sludge, disappeared, meanwhile new peaks F and G were recognized in Ex/Em of 270-280/420-430 and 240-250/425-435, which were humic acid-like and fulvic/humic-like matter, respectively. Since the peaks were not detected in the raw sludge sample, the substance was estimated to be produced by the degradation of bacterial cells. In the rice straw digestion (Run 3-2), peak E disappeared and peaks A, B and F were recognized. It was suggested that humic-like matter showing the fluorescence in Ex/Em of 310-320/420-430nm was decomposed by the anaerobic treatment;
meanwhile, humic-like matter in Ex/Em of 270-280/420-430nm was produced. On the other hand, peaks A and B appeared by the digestion, which was considered as the result of microbial growth and cells decomposition. In the co-digestion (Run 3-3), all peaks E, F and G, which were the main peaks in Run 3-1 and Run 3-2 respectively, were recognized. However, peaks A and B were not detected in Run 3-3. It was considered that due to the addition of raw sludge in Runs 3-1 and 3-3, bacterial activity involved in protein degradation was strengthened.
Figure 8 Fluorescent EEMs of raw sludge, rice straw leachate and digested sludge samples.
3.3.2 Biodegradability evaluation
Figure 9 shows the variation of DOC, proteins, carbohydrates and humic matter concentration in biodegradability test. DOM in Run 3-1 did not change significantly by aerobic treatment.
In Run 3-2, DOC decreased by approx. 12.5%, mainly due to the decrease in VFAs, since the test was conducted before adjusting pH. Humic matter also decreased by 18.1% after 24 h. In addition, proteins and carbohydrates decreased slightly. After 48 h, DOC and humic matter increased slightly, and this was suggested to be caused due to the degradation of microbial. In Run 3-3, humic matter decreased by approx.
16.5%, and proteins and carbohydrates decreased slightly after 6 h, which shows close variation with Run 3-2, indicating that some humic matter generated from rice straw could be degraded in aerobic condition. However, no decrease in DOC was observed in Run 3-3. The humic matter could not be degraded to bicarbonate.
Figure 9 Variations of DOC, proteins, humic matter, carbohydrates and VFAs in the biodegradability evaluation test.
Run 3-1 Run 3-2 Run 3-3