熊本大学学術リポジトリ
High pressure optical absorption in organic semiconductors (NMe4)2TCNQ3 and Cs2TCNQ3
journal or
publication title
Physica status solidi. B
volume 223
number 1
page range 337‑342
year 2001‑01
URL http://hdl.handle.net/2298/10549
doi: 10.1002/1521-3951(200101)223:1<337::AID-PSSB337>3.0.CO;2-R
Subject classification: S12, 71.30, 78.30, 78.40
1Institute for Materials Research, Tohoku University, Sendai 980-8577, Japan
2Faculty of Engineering, Department of Mechanical Engineering and Materials Science, Kumamoto University, Kumamoto 860-8555, Japan
3CREST, Japan Science and Technology Corporation
4Research Institute for Advanced Science and Technology, Osaka Prefecture University, Sakai 599-8570, Japan
Fax.: +81-96-342-3710
e-mail: [email protected]
High pressure optical absorption in organic semiconductors (NMe
4)
2TCNQ
3and Cs
2TCNQ
3By
Hasanudin1, T. Kagayama2, N. Kuroda2,3, T. Sugimoto4
Abstract
The pressure dependence of the optical absorption spectrum in (NMe4)2TCNQ3 and Cs2TCNQ3 has been measured at room temperature in the spectral range from mid-infrared to visible. At the ambient pressure the optical energy gap is observed at around 0.5 and 0.3 eV in (NMe4)2TCNQ3 and Cs2TCNQ3, respectively. The energy gap in (NMe4)2TCNQ3 decreases by 0.05 eV with increasing pressure up to 2 GPa, followed by an abrupt decrease towards 0.2 eV between 2 and 3 GPa. At higher pressures up to 5.5 GPa the gap remains almost unchanged.
The intra- and inter-molecular optical absorption bands in the near-infrared to visible region are intensified by pressure and broadened out at 2.5 GPa. The absorption spectrum in Cs2TCNQ3
exhibits a similar behavior under pressure. These results suggest that an electronic phase transition is induced by pressure at around 2.5 GPa in both substances. This phase transition resembles the charge-order-disorder (Verwey) transition in Fe3O4 in the electronic mechanism.
1. Introduction
(NMe4)2TCNQ3 and Cs2TCNQ3 belong to the TCNQ based cation/anion 2:3 compounds [1,2]. Their crystals consist of TCNQ/TCNQ-. and donor molecules or atoms stacked along the b-axis of the monoclinic structure. In the stack, one TCNQ molecule is repeatedly sandwiched by two
TCNQ-. molecules to form a charge-separated TCNQ-./TCNQ/TCNQ-. triads. The molecular planes are oriented perpendicular to the columns in (NMe4)2TCNQ3, whereas they are canted by ~20º from normal to the columns in Cs2TCNQ3. The two TCNQ-. molecules conform a slipped dimer in which they are displaced against each other in the direction of the short molecular axis. Despite the fractional (0.67) electronic charge per molecule, these two substances are semiconductors with a room temperature conductivity of 6x10⁻⁵ and 2x10⁻³ Ω-1 cm-1, respectively [1]. The low conductivity results from the uneven distribution of the electronic charge along the TCNQ stack [3].
The optical absorption measurements and X-ray diffraction study have shown that second order structural phase transition occurs at 333-338 K in (NMe4)2TCNQ3[4,5,6]. Although such phase transition is yet to be studied in Cs2TCNQ3, Cs2TCNQ3 and (NMe4)2TCNQ3 resemble one another well in the optical properties throughout the near-infrared to visible region. In addition, the infrared absorption spectrum shows that some molecular vibration modes are strongly coupled with the charge transfer electrons in both crystals [3,6].
An experimental result suggesting the pressure-induced insulator-to-metal transition has been reported by Matsuzaki from the measurement of the electrical resistivity in Cs2TCNQ3 [7].
The resistivity decreases gradually with increasing pressure up to 2 GPa. When the pressure exceeds 2 GPa the resistivity abruptly decreases, and at around 6 GPa it becomes 4 orders of magnitude smaller than the value at the ambient pressure. This anomaly of the electronic conduction might correspond to the structural phase transition observed from the high pressure Raman scattering study [8]. Upon this phase transition, the TCNQ stacks are likely to change from the trimerized to regular one. Unfortunately, there are no experimental data on the temperature dependence of the conductivity that confirms the metallic conduction in the high-pressure phase.
The purpose of the present study is to obtain the direct information about the electronic mechanism underlying the pressure-induced phase transition in (NMe4)2TCNQ3 and Cs2TCNQ3. We measure the high pressure optical absorption in a wide spectral region from mid-infrared to visible at room temperature.
2. Experiment
The as grown single crystals are used as the samples. Diamond anvil cell (DAC) is used to
obtain the hydrostatic pressure with flourinert (FC-40) as the pressure transmitting medium. The optical absorption spectrum is measured using two microscope-spectrometer systems which cover a wide spectral region from mid-infrared to visible. Ruby florescence method is used for calibrating the pressure. The linearly polarized spectrum is also measured at ambient pressure to clarify the anisotropy of the electronic transitions observed. In the high pressure experiment, only the unpolarized spectrum is measured, since the film polarizer suitable for the measurement with DAC in the infrared region is unavailable.
3. Result
Fig. 1 shows the optical absorption spectrum in the mid-infrared region in the two substances at the ambient pressure and room temperature. The thickness of the sample of (NMe4)2TCNQ3 and Cs2TCNQ3 is 2 and 10 µm, respectively. The spectrum consists of sharp molecular vibration peaks at the low-energy side and a broad electronic band, designated as A, at the high energy side. We assign the latter to the charge transfer of an electron from the π* orbital of the radical molecule to that of the neutral one, since it is strongly polarized along the molecular stack axis, i.e. b-axis. Because of the fairly large slip between radical and neutral molecules, in (NMe4)2TCNQ3 this band is also observed along the a-axis. The absorption edge suggests that the lowest optical energy gap is at around 0.5 and 0.3 eV for (NMe4)2TCNQ3 and Cs2TCNQ3, respectively.
Fig. 2 shows the unpolarized absorption spectrum in the mid-infrared region for (NMe4)2TCNQ3 and Cs2TCNQ3 under various pressures, where the thickness of the sample is 6 and 10 µm, respectively. The uncovered regions of the spectrum at around 0.25 eV and below 0.2 eV are due to the strong absorption by the diamond anvils and pressure-transmitting fluid, respectively. In (NMe4)2TCNQ3, as pressure increases, the A-band shifts towards lower energies.
In Fig. 3 the spectral position of the midpoint of the absorbance of the A-band is plotted as a function of pressure. It turns out that the gap decreases by 0.05 eV with increasing pressure up to 2 GPa, followed by an abrupt decrease towards 0.2 eV between 2 and 3 GPa. At higher pressures up to 5.5 GPa the gap appears to remain almost unchanged. In this high-pressure phase, a significant absorption intensity due to the A band seems to extend into the spectral region below 0.2 eV but there is no indication of the Drude tail. The results of the infrared reflectivity measurements up to 7 GPa do not show the Drude spectrum either [9]. In Cs2TCNQ3 the A band is very weak in the unpolarized spectrum, since in this substance the absorption is almost forbidden for the E//a polarization. We note that the low-energy edge of the A band shifts very little with pressure. Like the case of (NMe4)2TCNQ3 the energy gap remains unclosed even at 5.7 GPa. Instead, a considerable background absorption emerges under high pressures.
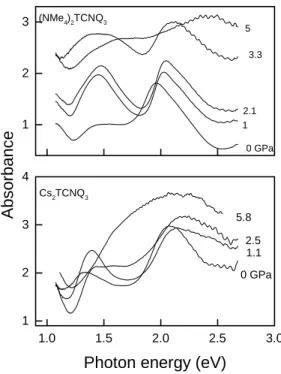
Fig. 4 shows the unpolarized absorption spectrum of both substances in the near-infrared to
visible region at various pressures. At the ambient condition, because of the strong dichroism only the intermolecular electronic transition band S1 and the low-energy part of the intramolecular band C are observed at around 1.3 eV and 2.0 eV, respectively[4,10]. Both bands are intensified and broadened significantly with increasing pressure, and at around 2.5 GPa the background absorption increases abruptly in the whole region to smear out structures.
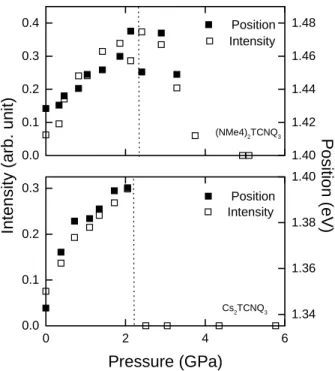
The pressure dependence of the integrated intensity and peak position of the S1 feature are shown in Fig. 5.
4. Discussion
The results of the present experiment clearly shows that pressure-induced electronic phase transition occurs in both crystals at around 2.5 GPa. One of the most significant results of our experiment is that the optical energy gap remains unclosed throughout this phase transition.
Therefore the electronic structure of the high-pressure phase should be considerably different from that of an ordinary metal.
Our results are reminiscent of the Verwey transition in Fe3O4 [11]. In the Verwey transition, the order-disorder rearrangement of Fe2+ and Fe3+ ions in the so-called B site occurs at TV = 120 K under atmospheric pressure. In the case of Fe3O4 the lowest optical absorption is observed at 0.14 eV at any temperatures. At low temperatures there is no appreciable electronic absorption below 0.14 eV, but an almost flat intragap absorption band extending to the far-infrared region emerges at TV. As temperature increases further the intragap absorption grows rapidly in concurrence with the rise of dc conductivity. The spectroscopic resemblance to this Verwey transitoin suggests that the π* electrons of (NMe4)2TCNQ3 and Cs2TCNQ3 are delocalized and disordered to become mobile along the molecular stacks in the high pressure phase, as pointed out also by Matsuzaki from the Raman scattering experiment [8].
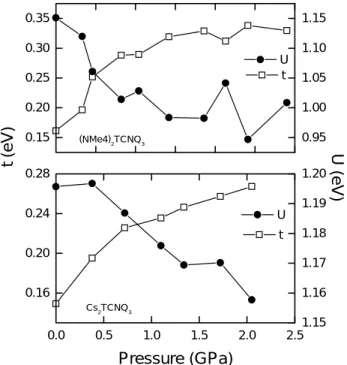
The basic picture of the electronic structure of the TCNQ radical dimer is provided in terms of the Hubbard model. In (NMe4)2TCNQ3 and Cs2TCNQ3, because of the large on-site Coulomb repulsion U compared with the intermolecular transfer integral t, the π* electrons are localized on two molecules of the TCNQ trimer at the ambient conditions [3]. The two molecules form a radical dimer. According to Jacobsen [12] the optical transition is permitted from the ground state of spin-singlet to an upper Hubbard state. Using the formulae given by Jacobsen for the intensity and peak position of this transition, we calculate the pressure dependence of U and t in the low-pressure phase on the basis of our experimental data (Fig. 5) concerning the S1 band.
The result is shown in Fig. 6. It turns out that U decreases whereas t increases with increasing pressure in both crystals. In particular, at around 2.5 GPa the transfer integral t becomes almost twice as large as the value at the ambient pressure.
This work was supported in part by the Grant-in-Aid for Scientific Research on Priority
Areas (B) from the Ministry of Education, Science, Sports and Culture.
References
[1] K. Ueda, T. Sugimoto, S. Endo, N. Toyota, M. Kohama, K. Yamamoto, Y. Suenaga, H.
Morimoto, T. Yamaguchi, M. Munakata, N. Hosoito, N. Kanehisa, Y. Shibamoto, Y. Kai, Chem. Phys. Lett. 261 (1996) 295.
[2] C.J. Fritchie, Jr, P. Arthur, Jr., Acta Crystallogr. 21 (1966) 139.
[3] A. Painelli, C. Pecile, A. Girlando, Mol. Cryst. Liq. Cryst., 134 (1986) 1.
[4] N. Kuroda, Hasanudin, T. Sugimoto, K. Ueda, M. Kohama, N. Toyota, Synth. Met. 103 (1999) 2327.
[5] K. Yagi, H. Terauchi, N. Kuroda, K. Ueda, T. Sugimoto, J. Phys. Soc. Jpn., 68 (1999) 3770.
[6] Hasanudin, N. Kuroda, T. Sugimoto, Submitted to Synthetic Metals.
[7] S. Matsuzaki, Synth. Met. 61 (1993) 207.
[8] S. Matsuzaki, Y. Matsushita, M. Sano, Solid State Commun. 74 (1990) 1265.
[9] Hasanudin, N. Kuroda, T. Sugimoto, M. Kobayashi, unpublished.
[10] J. Tanaka, M. Tanaka, T. Kawai, T. Takabe, O. Maki, Bull. Chem. Soc. Japan, 49 (1976) 2358.
[11] S. K. Park, T. Ishikawa and Y. Tokura, Phys. Rev. B58 (1998) 3717.
[12] C.S. Jacobsen, Semiconductor and Semimetals Vol. 27, Academic Press (1988).
Fig. 1. The linearly polarized infrared absorption spectrum of (NMe4)2TCNQ3 (upper) and Cs2TCNQ3 (lower) at room temperature and ambient pressure.
0.0 0.4 0.8 1.2
Cs2TCNQ3 (NMe4)2TCNQ3
Absorbance
A
E//a E//b
0.0 0.2 0.4 0.6 0.8
0.0 0.4 0.8
1.2 E//b
E//a A
Photon energy (eV)
Fig. 2. The unpolarized infrared absorption spectrum of (NMe4)2TCNQ3 (upper) and Cs2TCNQ3
(lower) at several pressures.
0.2 0.4 0.6 0.8
0.0 0.4
0.8 diamond absorption
5.7 3 2 0 GPa Cs2TCNQ3
Absorbance
Photon energy (eV)
0.0 0.5 1.0 1.5 2.0
5.0 3.3
2.1 1.0
0 GPa diamond absorption
(NMe4)2TCNQ3
Fig. 3. Pressure dependence of the optical energy gap in (NMe4)2TCNQ3.
0 1 2 3 4 5 6
0.2 0.3 0.4 0.5
Energy gap (eV)
Pressure (GPa)
Fig. 4. The unpolarized optical absorption spectrum of (NMe4)2TCNQ3 (upper) and Cs2TCNQ3
(lower) at several pressures in the near-infrared to visible region.
1.0 1.5 2.0 2.5 3.0
1 2 3 4
Cs2TCNQ3
5.8 2.5 1.1 0 GPa
Photon energy (eV)
1 2
3 (NMe4)2TCNQ3 5
3.3
2.1 1
0 GPa
Absorbance
Fig. 5. Pressure dependence of integrated intensity and energy of the intermolecular charge transfer band in (NMe4)2TCNQ3 (upper) and Cs2TCNQ3 (lower).
0 2 4 6
0.0 0.1 0.2 0.3
Cs2TCNQ3
Pressure (GPa)
Intensity (arb. unit)
Intensity
1.34 1.36 1.38 1.40 Position 0.0
0.1 0.2 0.3 0.4
(NMe4)2TCNQ3
Intensity
1.40 1.42 1.44 1.46 1.48
Position (eV)
Position
Fig. 6. Pressure dependence of U and t in (NMe4)2TCNQ3 (upper) and Cs2TCNQ3 (lower).
0.0 0.5 1.0 1.5 2.0 2.5
0.16 0.20 0.24 0.28
Pressure (GPa)
t
1.15 1.16 1.17 1.18 1.19 1.20
Cs2TCNQ3
U (eV)
U 0.15
0.20 0.25 0.30 0.35
(NMe4)2TCNQ3
t (eV)
t
0.95 1.00 1.05 1.10 1.15
U