Characteristics of Industry Structure and Problems with the Bidding and Contracting System in Japan's Rural Constr uction
Industry
H de O oto'
Abstract
This study analyzes the charu teristics of Japan's industry stn」cture for rural construction and exposes problems with the culTent bidding and contracting system for public works projects. Analysis of financial data fl・om 266 construction companies and questionnaire responses from 52 companies in Fuk、]shimaPrefocture shows that the comprehensive evaluation method of the current bidding and contra」cting system does not fimction adequately and opportunities exist for market oligopoly.
Moreovet, the study iinds that Japan's rural construction industry has a high degree of information sharing, resulting fi・om a complex, layered subcontra」cting strucOure. These results indicate the need for a detailed analysis of industry structure when designing systems for rural construction industly regulation.
Keywords: Japan's industry struʻ加re for rural constn!ction, bidding systen , market failure, soft information Received 4 0ʻ:tober 2011 Accepted 22 March 2012
Dat, Avail●bility: The data used in this study are not publicly available.
1. Introduction
Due to its historical background, Japan's rural construction industry has an industry structure that differs from that of the major general contractors and engages in business practices all ot its own. This study analyzes the characteristics of Japan's industry structure for rum1 construction and exposes problems with the current bidding and contracting system for public works projects.
In many municipalities, bidding on public works projects has traditionally taken the form of designated competitive bidding systems in which project initiators designate desired bidding contractors according to determinations of their capabilities and credibility.l In recent years, however, there has been a significant institutional shift from a system based on designated competitive bidding to one based on public bidding, a result of reduced government investment in construction and desired transparency after several bid-rigging scandals were uncovered 2 This institutional shift has ted to fewer bid-rigging cases, but the resulting intensification of price competition has raised new problems, such as the frequent occurrence of orders at levels close to what could be termed“dumping”In response to this, the Ministry of Land, Infrastructure, Transport and Tourism (MLIT) began promoting as an anti-dumping measure the introduction of a
' Faculty of Economics and Business Administration, Fukushima Univefsity, Fukushima, Japan.
l In Japan, according to the Public Accounting Act, government procurement projects are generally required to use public bidding procedures. When certain conditions are met however, designated competitive bidding is permitted.
2 As shown below, public investment in recent years has declined sharply in Japan. As a result, as compared to public investment, the number of construction companies has become excessive. 1n response to this situation, for the purpose of restructuring and selection of construction companies, the Japanese government has been promoting refom of the bidding system.
139
comprehensive evaluation method for general competitive bidding, and many municipal governments have implemented such measures with the goal of mitigating competition based only on price. It is difficult to say, however, that the implementation of such schemes has always resulted in increased levels of social welfare in Japan's rural areas. As w加be described, there are indications that the introduction of comprehensive evaluation methods by local governments for public works project bidding has resulted in oligopolistic situations which negatively impact on economic efficiency.
This study examines Fukushima Prefecture's transformation from using a designated competitive bidding system to a general competitive bidding system in 2007, one year after the uncovering of a bid-rigging scandal there. The results of this analysis are then used to describe the characteristics of Japan's rural construction industry and indicate potential market failures in the Japanese bidding system.
2. Environment and management conditions surrounding the construction industry in Fukushima Prefecture
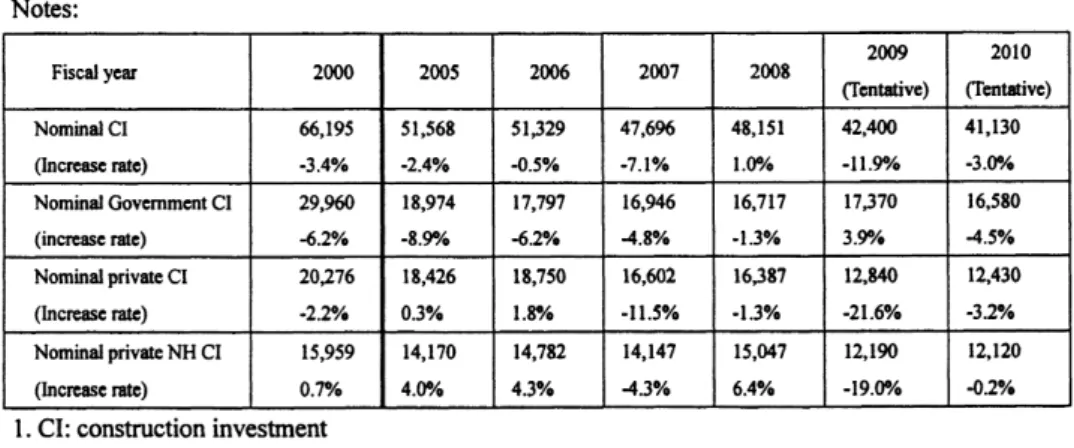
Table t shows chm ges in construction investment as reported by MLIT (figures given for fiscal 2009 and 2010 are tentative). As is evident from the table, there was a marked reduction in both public and private construction investment for the period 200 2010. While not shown by the table, figures indicate that construction investment levels in recent years are approximately half that of their 1992 peak value of 84 trillion yen.
Table t- Changes in construction investment Notes:
Fiscal year 2000 200S 2006 2007 2008 2009
(Tenu ive)
2010 (n ntative) Nominal C1
(Inc開so fate)
66,19S 3.4%
51,568 -2.4%
51,329 -0.5'/・
47,096 -7.1%
48,151 l .0%
42 400 - l l .9%
41,l30 3.0%
Nominal Government CI (inelu se rate)
29 960 -6.2%
l8,974 -8.9%
l7,797 -62%
l6 946 4.8%
l6,717 -1 .3%
17,370 3.9%
l6,580
一4.S%
Nominal pfi、lae CI
(Increase rate)
20,276 -2.2%
l8,426 0.3%
l8,7S0 l . 8'%o
16 602 -l l.5%
l6,387 -1 .3 y・
l2,840 -21 .6%
l2,430 3.2%
Nominal privateNHCI (IneluLserate)
l:S,959 0.7%
14, l70 4.0%
14,782 4.3%
l4,l47 -4.3%
15,047 6.4%
l2, l20 -02%
1. CI: construction investment
2. Private NH CI= private non-housing construction investment十 private civil engineering investment Source: Research Institute of Construction and Economy (2010).
140
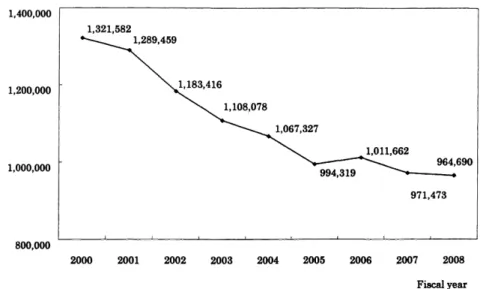
Figure 1- Changes in average order volume per company among constr uction companies in Fukushima Prefecture (general constructor basis)
Thousand yen l ,400,000
1,200,000
1,000,000
800,000
2000 2001 2002 2003 2004 2005 2006 2007 2008
Fiaea1 year
Source: Fukushima Construction Industry Association (2009).
Figure 1 shows changes in average order volume per company among corporate members of the Fukushima Construction Industry Association 3 Here, too, a significant decline can be seen in average order volumes since fiscal 2000. According to the Q&A Handbook ftor lmpro、,ed Management of Smat1- and Mid-Sized Construction Firms (Council on Construction Industry Management 2009), as of fiscal 2007, the share of public investment in construction projects in the Tohoku region4 was 44.5%, which is significantly higher than the share in urban districts such as the Tokyo area.S In the Tohoku region, changes in construction investment by central and local governments have considerably impacted the annual order volume for individual construction companies, and hence, financial conditions in the region.
Given that the amounts of public investment in Japan are not expected to increase significantly in the foreseeable future, such allocations are a major influence not only on the operations of individual construction companies, but also on the structure of the entire rural construction industry in the Tohoku region and beyond.
In a 2007 survey of construction companies, 0kumoto (2008) noted some common themes in the respondents' comments about conditions surrounding the construction industry in Japan: 1) sales had sharply dropped since their peak in around 2000, making financial conditions severe; 2) kyoryoku kai6
3 The values given are for corporate members of the Fukushima Construction Industry Association. The Association had 266 membefs as of 2008.
4 Tohoku region is the northeast region of Japan within which Fukushima Prefecture lies.
S In comparison, the same-year ratios for the Tokyo and Osaka areas were 20.2% and 25.9%, respectively, approximately half that of the Tohoku region.
6 One charafteristic of the Japanese construction industry is the formation of a multilevel structure made up of p1imary and secondary subcontractors beneath the prime contractor that receives a public works project. Such networks also contain companies that specialize in spec面c areas of construction, such as electrical installations. These networks of companies go under the name kyoryoku kai.
141
supplier associations were formally dissolving or were in danger of failing; and 3) the number of employees was decreasing, leading to a reduction in scale. These comments reflect the harsh economic environment in which the construction industry operates in FukushimaPrefecture (0kumoto 2008, 17).
Adding to this situation, a bid-rigging scandal that was unearthed in Fukushima Prefecture in 2006 led to major reforms, including the introduction in 2007 of a general competitive bidding system to replace the previous traditional system of designated competitive bidding. While such reforms clearly have merits such as preventing bid-rigging deals and improving competition and transparency, they have also introduced new problems, including 1) unqualified contractors participating in bids, 2) an increase in extremely fl・equent bids in excess of actual management potential, and 3) “dumping”一priced bids designed to fix cash-flow problems. This last problem, in particular, has ted to an intense price war within the Fukushima Prefecture construction industry, to the extent that even companies that were, relatively speaking, previously financially healthy are now weakening 7
3. Introduction of the general competitive bid system and its results 3. 1 Failures of the general competit!ve bid system
As described above, in the case of Fukushima Prefecture, the introduction of a general competitive bidding system alone was not sufficient to optimize resource allocation through free competition, or to provide improvements in the quality of the industry overall or in the goods and services that it provides. It is tempting to view this as a functional failure of auction mechanisms, but there is one problem with this analysis: the structure and characteristics of the construction industry in Fukushima Prefecture, as well as the characteristics of the goods and services provided by builders there, may not be suited to the auction mechanisms introduced in 2007 or, at the very least, may not yet have matured to a point where they are suited.
The auction system which Fukushima Prefecture introduced in 2007 can be thought of as a first-price sealed-bid auction (FSA). And the aim of this introduction can be thought of as to prevent involvement in bid-rigging 9 However a variety of conditions must be met in order for FSA mechanisms to perform efficiently in a market. These conditions are related to factors such as the characteristics of economic agents participating in the auction and traded goods or services, information levels during transactions, attributes of a deal, and so on. When analyzing the construction industry in Fukushima Prefecture with such factors in mind, several instances of dysfunctional FSA mechanisms become apparent. As one previously noted example, the ratio of public works to total construction investment is quite large in the Tohoku region. This study, therefore, focuses on public works construction ordered by public entities.
Okumoto (2008) presents some interesting findings related to companies participating in the construction market and to the construction industry itself. In particular, 1) there are too many companies in the industr;y,9 2) there is no clear differentiation in the characteristics of enterprises (category of business, management practices, etc.), 3) there is a need for improvements in management quality in the 7 0kumoto (2008) reports that almost all companies in the Fukushima Prefecture construction industry mentioned these problems in interviews.
8 As shown by Vickrey (1961), factors related to top bid, individual rationality, and strategy-proofness suggest implementation of second-price sealed-bid auction rules. However, this approachL, too, leads to problems. For one thing, the bidding prices presented by construction companies are roughly equivalent to the company's cost information, which removes the incentive for an honest presentation due to the highly sensitive nature of the information. Furthermore, the probability of collusion is higher under such rules than under FSA.
9 In 2007, the number of construction companies in Japan was 600,980, which was 462 companies per 100 000 people.
The number of construction companies in Fukushima Prefecture was 9,788, which was 489 companies per 100,000 people.
142
industry as a whole, and 4) there is a significant difference in attitude between general contractors and subcontractofs. It is possible to uncover which FSA mechanisms have become factors in the price wars in the rural construction industry by keeping in mind not only these characteristics of construction firms participating in the auction and their industry structure, but also the nature of public works as a consumed good, as well as the relationship between the prefectural and other local government bodies who order public works and the local residents who are, in the encl, the final consumers of the product.
FSA mechanisms do not function effectively, primarily because construction companies participating in auctions are heterogeneous, and company managers have high levels of risk aversion. Risk-averse bidders fear losing bids, and so submit lower bids than they normally would (Milgrom and Weber 1982). Disparity between bidders heightens this effect, creating even lower bids as the number of bidders increases.
Bid ratios, the ratio of the accepted bid versus the budget originally proposed, are another factor in the auction process. Iwamatsu and Endo (2008) analyze bidding results data from April 2005 through July 2007, and show that an increased number of bidders resulted in a tendency for a lower bid ratio. This does not present a problem in the case where such decreases in bid ratios result from competitive pricing, thus leading to increased economic efficiency. In Fukushima Prefecture, however, the situation is not necessarily associated with increased economic efficiency, but rather with a tendency toward“dumping” This tendency is further enhanced by the following characteristics of public works revealed by the investigation of Okumoto (2008).
One characteristic of public works as goods is that, ideally, the local residents who serve as ultimate consumers of those goods should be reflected in their trade. However, in the case of rural public works, the end consumer is unable to influence price directly, so local government bodies with the ability to set prices serve as consumer representatives when placing orders. As a result, while builders should be interacting with the final consumers (local residents), it is possible that deals will be completed considering only those placing the orders.
A second characteristic is the asymmetric information between local government bodies and builders related to the product quality of the public works being traded. In auctions, the seller (or auctioneer) generally has perfect information related to the quality of the item for sale. However in public works bidding, local government bodies who conduct auctions have limited information about the quality of the products or builders. M oreover, information on public works created by the construction industry is often not fully revealed to the public, and, when it is provided, the information is of such a highly technical nature that end consumers are unable to differentiate among the public works or the buildefs providing them. In this sense, the rural public works market in Japan is what Aker1of (1970) refers te as a“lemons market”As indicated by Tirole (1986), however, there is an expectation that the governmental bodies placing orders as representatives of the end consumers w加evaluate the relevant information and accurately assess the quality of the goods. Where those individuals placing the orders are unable to accurately assess the quality, however, there can be no guarantee of the quality of the goods. The result is competition based on price alone.1o
There exists yet a third characteristic, which is related to the builder-supplied public works themselves.
The most common form of public works projects ordered by local government bodies is that of general civil engineering construction. In most cases, the quality of such projects serves as the standard good, and there is little room for differentiation through the provision of added value. The result of this characteristic of public works as goods is that they are particularly prone to f illing into competition based on price alone.
IO Another possibility is that those placing the orders and those taking the ordefs will collude to set contracts at inappropriately high prices. This is exactly the scenario that led to price fixing problems and the resulting introduction of general competitive bidding.
l43
This point means that even among otherwise similar construction companies, there is a significant difference between those who primarily take on private-sector construction projects and those who focus on general civil engineering projects. That is, the former are boner able to perform price dif ferentiation according to product quality in the form of added value mording to the demands and tastes of the private sector, while the latter serve mainly to provide a standard good aeco fding to specifications and indicated price. Given this, the f'aet that there are differences between the two lypes of companies is not surprising. In the case of Fukushima Prefecture, differentiation is also seen based on diffierences in company scale and whether the company is a general contractor or subcontractor, even within the private-construction or civil engineering sectors, and this causes asymmetry among bidders. Another factor filrther strengthening this asymmetry is the multilayered subcontracting structure found in the ruml construction industry. It has become common practice in the rural construction industry in Japan for general contractors to contract with local government bodies who place the order, but for subcontractors to perform all substantive construction work under the general contractors' supervision. Those subcontractors then hire secondary subcontractors, who in tum hire tertiary subcontractors, creating a somewhat unique system of production.
Okumoto (2008) shows that this multilayered structure has created a sense of differentiation between the general contractors and su1:lcontractors. Specifically, general contractors see themselves as managers and coordinators of ordered construction projects, while subcontractors are treated only as a resource for getting work done. This means that in conventional bidding systems, subcontractors may underestimate the role of general contractors, thinking that they have the ability to successftl1ly take on construction projects alone. In such cases, when both general contractors and subcontractors participate in competitive bidding without distinction between them, subcontractors will bid an amount that is less the margin taken by the general contractors. This is not a problem if the subcontractors have sufficient ability to take on and complete projects, but in cases where they provide low quality construction due to deficiencies in management and coordination, there can be a significant loss of social benefi t As previously described, there has recently been a dramatic decrease in the number of public works ordered, making the financial situa:tion tight for many companies. This has especially been the case in the rl」raf construction industry, and it is likely that the introduction of general competitive bidding systems has significantly contributed to such situations of adverse selection.
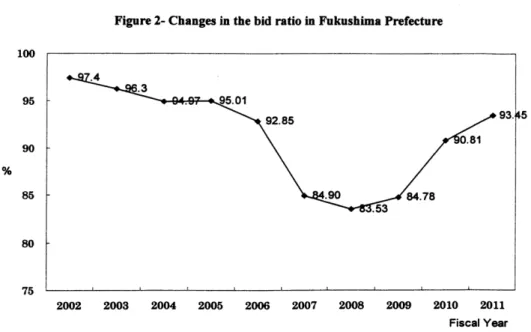
As noted by Iwamatsu and Endo (2008), there is a significant entry cost for construction companies participating in general competitive bidding, further increasing participants' risk averse behavior. Figure 2 shows changes in the bid ratio before and after the introduction of general competitive bidding; there is a clear decline following the introduction in 2007. The subsequent increase in the bid ratios, particularly in 2010 and later, is due to the decrease in the number of bidding participants.
l 44
100
95
90
% 85
80
75
Figure 2- Changes in the bid ratio in Fukushima Prefecture
2002 2003 2004 2005 2006 2007 2008 2009 2010 2011
Fiscal Year
Source: Fukushima Construction Industry Association (2009) 3.2 Introduction of the general competitive bidding system in Japan
According to The Central Construction Industry Committee (1998), MLIT set forth the following goals in 1998 in order to shift from the previous designated bidding system to a general competitive bidding system, and to“greatly increase transparency, objectivit;y, and competition, while decreasing dishonesty”:
1. Introduce the tender and contract methods, which adequately evaluate the technical competence of the company, and promote market competition based on technical competence by the thorough elimination of defective and incompetent companies that hamper appropriate competition.
2. Change management style by focusing on not only quantitative aspects, but also qualitative aspects, and promote the development of a new style of enterprise by means such as enrichment of managerial and technical skills and the reorganization among the companies.
3. Create the desired competitive environment through changes such as progress in technical developmen promotion of disclosure of the companies' additional information (including work performance and social responsibility), and improvement in the transparency of the tender and contract processes.
4. Promote rationalization of the production systems related to construction, including an increase in production and management efficiency, and improvement of prime contractor-subcontractor relations.
General competitive bidding systems were introduced by many rural governments in response to the goals listed above. However, in view of the characteristics of construction companies and market conditions described in the previous section, careful consideration of a more detailed system design might have been warranted. For example, the system design could have better insured functioning of the FSA mechanism by including needed subsystems to prevent a market failure, such as more sophisticated monitoring systems and information disclosure systems. Phenomena indicating the dysfunction of FSA mechanisms have arisen not only in Fukushima Prefecture, but also in other locales which introduced similar general competitive bidding systems.
145
Starting in 2005, such conditions led M LIT to push for the introduction of comprehensive evaluation methods as a way of improving the competitive conditions for bidding. This was largely triggered by the fact that the general competitive bidding systems as originally introduced relied too strongly on price as the competitive factor by which companies would be awarded public works jobs. Unlike commodities, public works have unique non-cost bases for quality evaluation, such as delivery date, completeness, durability after completion, and regional adaptation.
In auctions for goods or services having multiple attributes, scoring systems theoretically provide benefits. For example, Che (1993) showed that under scoring systems, the auction organizer (the seller) benefits from full disclosure of auction information, such as the designed method for calculating scores. It is likely that the introduction of comprehensive evaluation methods has come to be so strongly recommended in Japan on such a theoretical basis. This notion was formalized on April 1, 2005 with the Promotion of Quality in Public Works Act. In this way MLIT hoped to“preserve the quality of public works by 1) optimizing the bidding and contract process by eliminating unqualified builders as job recipients; 2) better utilize the abilities of pli vate sector firms; 3) form fair contracts by placing all parties on equal footing d1uring the contracting process; and 4) increase consideration of quality assurance in surveys and designs for public works”(MLIT 2005).
As a consequence, in 2006, Fukushima Prefecture introduced a comprehensive evaluation method for general competitive bidding related to public works. Even today, Fukushima continues to implement institutional changes, including revisions to the evaluation criteria, as a way of improving the system.
4. Analysis design and data 4.1 Analysis goals
This study is divided into two parts. The first part analyzes financial data from rural construction companies with headquarters in Fukushima Prefecture to investigate whether comprehensive evaluation methods are effectively functioning in general competitive bidding schemes there. The targets of this analysis are the business evaluation score (BES) developed during the business evaluation according to Article 27.23 of the Construction Business Act11 when builders contract for public works.12 The reason for this emphasis is the high weighting placed on BES as part of the overall score in the comprehensive evaluation. MLIT has publicized the standards applied to the evaluation items for the business evaluation, along with the weights assigned to each. This study intends to make more clear the structure and characteristics of the business evaluation through an analysis of actual corporate financial data.
The second part of the analysis examines tacit information retained within the construction industry (hereinafter, “soft”informationl3) in Fukushima Prefecture, and investigates how well such information corresponds with rankings made according to the business evaluation. The goal for performing such an analysis is described below.
If it were possible to use so量information fi・om within the rural construction industry to explain company 11 The Construction Business Act, established in 1949, is a Japanese major law pertaining to construction firms. In Japan a construction license as spec面ed by this act is required by any person or company that intends to operate a construction business.
12 When considering problems associated with comprehensive evaluation methods, it is essential to analyze not only these business evaluation scores (BES), but also the“subjective scores”set forth by individual local governments. This was not done in this study, however, due to limitations such as data availability; such analysis is left for future investigation.
l3 Here, “soft”information is as defined by Boot (2000), namely, information such as reputation and rumors present within the industry but normally impossible to obtain through public means. In contrast, publicly available financial information is referred te as “hard”information.
146
rankings according to the business evaluation, this would be indicative of the functional failure of blind auctions such as FSA. Under such conditions, when the companies placing a bid are made public and the industry is able to make accurate predictions as to which company will win, this can aet as a bam er to bid participation by companies less likely to win. Increasing the number of companies taking part in the bidding process can lead to the selection of superior firms as well as bring about corporate growth by promoting competition between companies. When the number of participating firms is limited, however, this can lead to a de facto oligopoly under which the merits of competitive bidding systems are not realized.
Of course, even in situations where rankings can be explained by soft information within the indusoy, i f those factors by which rank is determined can be improved th1ough efforts made by individual companies then this might promote such efforts, leading to industry growth. Many factors such as company scale and longevity, however, are part of the initial endowment of participating firms, making control through self-effort problematic. When such factors determine rank, companies may not only 1ose the wi11 to participate in bidding, but may also feel a sense of unfairness that will sap their will to grow. In this study, a questionnaire and interview surveys were performed, during which many comments were heard that confirmed such feelings of unfairness. Therefore, those factors that can lead to such a situation were also verified.
4. 2 Methods of analysis
In the primary analysis, multivariate analysis is performed on financial data from the 3-year period spanning fiscal 2006 through fiscal 2008 for 266 companies belonging to the Fukushima Construction Industry Association. The financial indices that tom the business evaluation are summarized using principal component analysis and their characteristics are analyzed. Regression analysis is then carried out to determine to what extent the summarized data explain BES and to examine the explanatory power of the various categories of information.
In the secondary analysis, a questionnaire survey and interviews were completed with the 52 corporate members of the Fukushima Prefecture Construction Industry Cooperative.l4 The data obtained are then quantified and principal component analysis is perflormed in a similar manner to the primary analysis.
Again, regression analysis is used to examine the explanatory power of the gathered data with regard to BES.
4. 3 Results of the pnmary analysis 4.3. I Data
As described above, financial indices for evaluation items X1, X2, and Y of the business evahlation are calculated based on financial data from the 266 companies belonging to the Fukushima Construction Industry Association. Table 2 shows the evaluated items and scores. Financial data was obtained from the Fukushima Construction Industry Association.
The business evaluation items were revised in 2008. MLIT (2008) desclibes the 2008 revisions as follows.
1. An evaluation of scale, including a balanced consideration of completed work amounts, profits, and capital stock (X l , X2)
2. An evaluation of financial conditions that accurately reflects company conditions (Y)
・ Includes 8 jndices that allow evaluation of resistance to debt encumbrance, profitability and efficiency, financial health, and absolute competence
3. A more accurate evaluation of technological capability (Z)
14 These companies are also members of Fukushima Construction Industry Association
147
4. An evaluation that allows for differentiation according to fulfillment of social responsibility (W) Table 2- Evaluation Cr iter ia of the Business Evaluation
Weight Evaluation items
0.25 X1 the amount of completed work
0.15 X2 net worth
earnings before interest, taxes, depreciation and amortization 0.2 Y net financial cost to sales ratio
debt to sales ratio
current profits to sales ratio gross profits to total assets ratio equity to fixed assets ratio equity to total assets ratio operating cash flow earned surplus
0.25 z the number of technical staffs
construction revenue of principal contract 0.25 w record of labor welfare conditions
the number of years in business
contribution to disaster prevention activities compliance
accounting method
research and development activity
In addition to the four revisions listed above, M LIT (2008) also stated that“the establishment of fair and realistic standards for evaluating firms engaging in public works will provide a 'yardstick”' by which to
“measure and support the efforts of companies in improving productivity and management efficiency”.
One can take this as meaning that the goal of the revisions was to establish a more balanced standard of evaluations that relies less on completed work levels, and takes into consideration changes in business conditions and diversification of the construction industry. As part of the revision, BES is computed according to the Equation (1):
Total BES P = 0.25 * X1 + 0.15 * X2 +0.2 * Y+ 0.25 * Z + 0.15 * W (1)
As can be seen, weighting of the X1 , X2, and Y terms in this equation means that these items account for 60% of the total score. This analysis uses data related to these evaluation items to determine if the assigned total scores are consistent with the intended goals of MLIT for revising the business evaluation. Note that the following data items are modified or omitted from the analysis for the reasons stated:
● EBITDA (earnings before interest, taxes, depreciation, and amortization) is replaced with net operating profits, due to the number of missing values related to depreciation
● current profits to sales ratio is replaced with operating profits to sales ratio, because data for the former are not available
● operational cash flow is omitted, due to the number of missing values
● earned surplus is omitted, due to the number of missing values
l 48
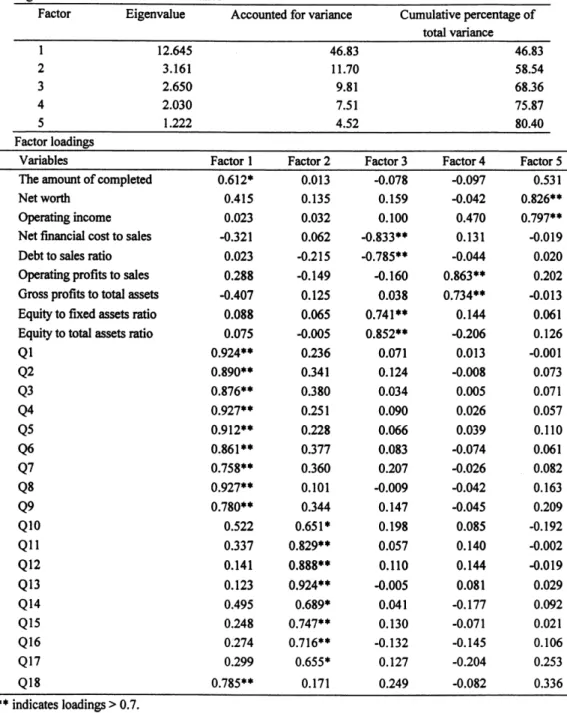
4..3.2 Results of principa1 component analysis 1
Due to the modifications described above, analysis of the 11 indices related to evaluation items X1, X2, and Y is performed using 9 indices. As can be seen in Table 3, these 9 indices are aggregated into 3 principal components with significant information.lS These 3 principal components account for 68% of the total explained information. Table3 shows the factor loadings for each variable.
The factor loadings presented in Table 3 can be interpreted as follows. Note that varimax rotation was performed to rotate the factor axes to allow for easier interpretation of the factor loadings.
Factor 1 : This factor has a high positive correlation with net financial cost to sales ratio and debt to sales ratio, and high negative correlation with equity to fixed assets ratio and equity to tcltal assets ratio, indicating reliance on debt. In this analysis, this is taken as a debt reliance index.
Factor 2: This factor has a high positive correlation with operating profits to sales tatio and gross profits to total assets ratio, marking this as a factor related to profitability. In this analysis, it is taken as a prof tability index.
Factor 3: This factor has a high positive com lation with the amount of completed work and net worth, marking this as a factor related to scale characteristics. This is taken as a company scale index.
In summary, the X1, X2, and Y evaluation items, which account for approximately 60% of the information level contained within the business evaluation, are determined according te l) whether the firm relies on debt (financial health), 2) whether the company is profitableCprofitability), and 3) whether the company is large (company scale).
We next use regression analysis to investigate the extent to which these three indices explain the total score for the business evaluation, including the Z and W items.
Table3- Results of principal components analysis l Eigenvalues and accounted for variance
_
Factor Eigenvalue Accounted for variance Cumulative variance
percentage of total 2.751
1 .866 1 .549
30.57 20.73 17.21
30.57 51.30 68.51
一mtor 1oadings in __ _ _ _ _ _
Variables Factor 1 Factor 2 Factor 3
The amount of completed work 0 0436 0.0855 0.8832**
Net worth -0.1852 -0.0588 0.8495**
Operating income 0.0776 0.6065 0.4619
Net financial cost to sales ratio 0.7259** -0.0325 -0.l529
Debt to salesratio 0.8010◆* -0.1890 0.0180
Opemtingprofits to salesratio -0.1084 0.8394** 0.1860 Gross profits to tcltal assets ratio -0.0973 0.8706** -0.1966
Equity to fixedassetsratio -0 7214** 0.0191 0.0405
_
uity to total assets ratio -0 8481*◆ 0.0332 0.0442** indicates loadings > 0.7
IS We extracted the principal components with eigenvalues greater than l
l49
4.3.3 Results of regression analysis 1 The analysis model is:16
Total BES P = α+ β1 * debt reliance index score
+β2 * profitability index score+ β3 * scale index score
T,ables 4 and 5 show the respective results of the BES regression based on principal component scores;
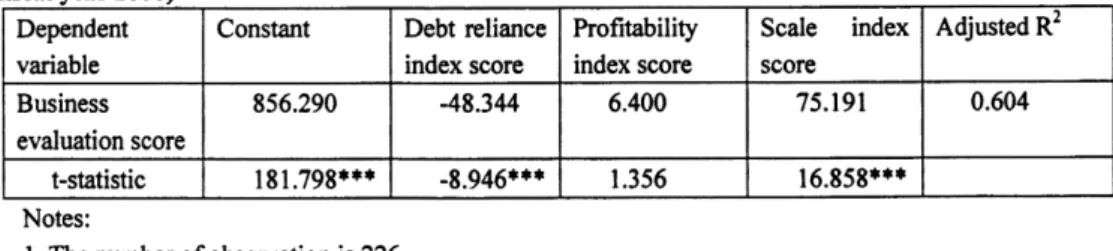
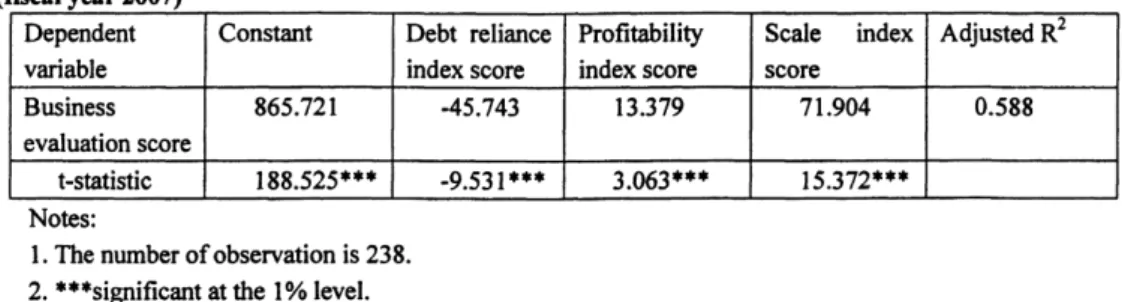
Table 4 shows the results of regression of 2007 BES based on fiscal 2006 financial data, and Table 5 shows the results of regression of 2008 BES based on fiscal 2007 financial data. The coefficients of determination shown in Table 4 and Table 5 are 60.4% and 58.8%, respectively. The results indicate that the analysis models explain approximately 60% of the total score for business evaluation. Since, the total weight of the X1, X2, and Y evaluation items is 0.6 (= 60%) as shown in Equation (1), the results appear to be commensurately aligned. This indicates that BES is calculated in accordance with the evaluation standards.
Table 4 also shows that the ll weights for the debt reliance index, the profitability index, and the scale index are -48.344, 6.400 and 75.151, respectively. These values clearly indicate that debt reliance has a negative influence on BES, while profitability and scale have a positive influence. In other words, the lower a firm's reliance on debt, the higher its BES w加be, and, conversely, the more profitable and the larger a firm is, the higher it will be. While this is the expected result, this corroborates the intuitive notion that financially healthy firms with large profits and large firms receive higher scores.
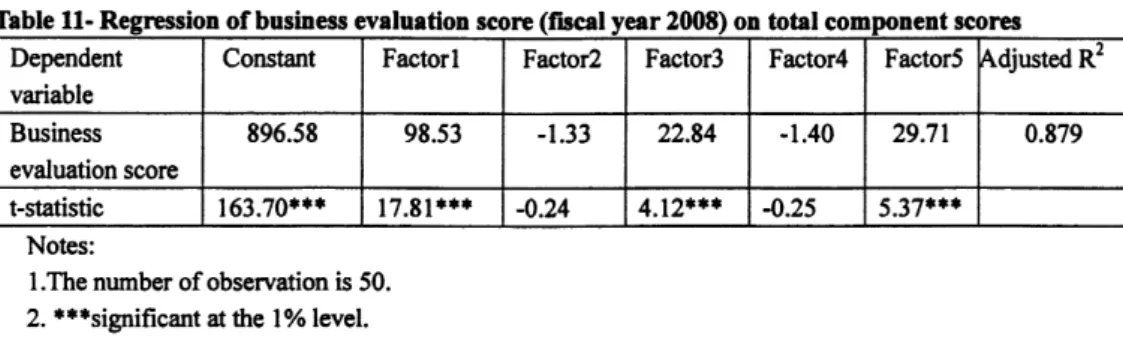
However, the respective t-scores indicate that factors 1 and3 are the statistically significant indices, with factor 3 having a particularly large influence on BES. In other words, the business evaluation before the 2008 revision placed a large weight on company scale and debt reliance. Furthermore, company scale was a particularly important indicator. In contrast, Table 5 shows respective t-statistics of -9.531, 3.063, and 15.372, indicating that all signs have been preserved, while slightly reducing the effects of company size and making factor 2 a significant factor. These values indicate that the 2008 revisions have contributed to establishing evaluation standards leading to the goals of a balanced evaluation that is neutral with regard to sales levels. However, the data also indicate a lingering, strong effect of company scale on BES.
Table 4- Regression of business evaluation score (fiscal year 2007) on financial component scores (fiscal year 2006)
Dependent variable
Constant Debt reliance index score
Ptofitability index score
Scale index score
AaOusted R2 Business
evaluation score
856.290 -48.344 6.400 75.191 0.604
t-statistic 181.798*** -8.946*** 1.356 16.858***
Notes:
1 . The number of observation is 226 2. ***significant at the 1% level.
l6 Component scores for each index were calculated
150
Table 5- Regression of business evaluation score ( fiscal year 2008) on financial component scores (fiscal year 2007)
Dependent variable
Constant Debt reliance index score
Profitability index score
Scale index score
Adjusted R2 Business
evaluation score
865.721 -45.743 13.379 71.904 0.588
t-statistic 188.525*** -9.531*** 3.063*** 15.372***
Notes:
l . The number of observation is 238 2. ***significant at the 1% level.
4. 4 Results of the secondary analysis 4.4. I Data
As described earlier, the secondary analysis is based on information obtained when conducting the questionnaire survey and interviews targeting the 52 member firms in the Fukushima Prefecture Construction Cooperative.17 The questionnaire used appears in the Appendix.
In order to extract soft information implicitly held within the construction industry in Fukushima Prefecture, the questionnaire survey took the form of a peer-reviewed questionnaire.l8 The questionnaire asked executives at each company to provide answers related to the seven evaluation points not only for their own company, but also for other firms in their same district and in the same class.19 0 f the 52 companies that were the target of analysis, 40 were ranked as A-class companies and 12 as B-class companies. When conducting the surveys, we contacted the president of each company to arTange an appointment, at which we explained the purpose of the survey and conducted an interview. Interviews lasted approximately 1 hour each.
As can be seen from the list of questions, there are a total of 18 items: a) 3 items related to determining companies' technological capability, construction management ability, and construction experience, b) 5 items related to determining companies' organizational, employee management skills, and employees' ability, c) 2 items related to determining companies' skills in planning and business dealings, d) 3 items related to the personality of executives, e) 4 items related to companies' contributions to the local community, and f) l item related to companies' overall evaluation. These items were used in an attempt to extract soft information from within the Fukushima Prefecture construction industry related to reputation, rumors, corporate image, and other information that is not generally publicly available, by directly asking company executives-the determiners of these items-and receiving their intuited responses. Analysis was then performed to determine to what extent the obtained information could be used to explain company rankings under the business evahlation, and conversely whether there existed any new or additional soft information that is not reflected by the business evaluation 20
7 Companies participating in the survey were selected fi・om among the Fukushima Construction Industry Association and Fukushima Prefecture Construction Cooperative members, based on locale, business type, and company scale. The survey was conducted via the FukushimaPtefecture Construction Cooperative, allowing us to receive responses from all 52 companies initially approached.
l9 As opposed to the usual method of having answers to questionnaires sent by mail, in this case company executives answered the questions on the questionnaire form in person, which should provide much higher data reliability.
I9 In Japan, the rural construction companies are ranked by local governments as fl'om A-class to D-class based on their scale and financial characteristics.
20 Note that 325 questionnaires were completed, for a response rate of almost 100%.
151
4. 4.2 Results of simple aggregation
Table 6 shows that there were dif ferences in average scores according to locale, evaluator, and rank. In particular, there was a tendency to over-evaluate one's own company and there was a uniform difference in average score between A rank and B-rank companies. 0 f particular note is that there are numerous B-rank companies in the Kitakata and Shirakawa districts, which might explain why average scores are lower in those areas.
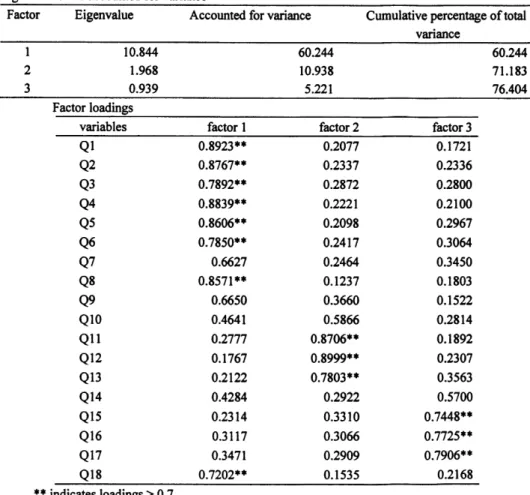
4. 4. 3 Results of principa1 component analysis2
Table 7 shows that the principal component analysis extracted 3 factors with eigenvalues greater than 1.
As can also be seen flem the cumulative contribution ratio, those3 factors explain 76% of all information fl'om the 18 questionnaire items. Furthermore, the first of the 3 factors alone contributes 60%, more than half, of the total information. The factor loadings can be interpreted as follows.
Table7- Result3 of principal componen analysis 2 Eigenvalues and accounted for variance
Factor Eigenvalue Accounted for variance Cumulative percentage of total variance
123
10.844 1 .968 0.939
6()244 10.938
5.221
60.244 71.183 76.404 Factor loadings
variables factor l factor 2 factor 3
lQ
Q 2
Q3
Q 4 Q 5 Q 6 Q 7 Q 8 Q 9 Q 10 Q 1l Q 12 Q l3 Q 14 Q 15 Q 16 Q 17
Q 18
0.8923**
0.8767**
0.7892●*
0.8839**
0.8606**
0.7850**
0.6627 0.8571**
0.6650 0.4641 0.2777 0.l767 0.2122 0.4284 0.2314 0.3117 0.3471 0.7202**
0.2077 0.2337 0.2872 0.2221 0.2098 0.2417 0.2464 0. l237 0.3660 0.5866 0.8706**
0.8999**
0.7803*● 0.2922 0.3310 0.3066 0.2909 0.l535
0.1721 0.2336 0.2800 0.2100 0.2967 0.3064 0.3450 0.1803 0.l522 0.2814 0.l892 0.2307 0.3563 0.5700 0.7448**
0.7725**
0.7906**
0.2168
** indicates loadings > 0.7.
Factor 1 : Ql , Q2, Q3 (technological capabili , construction management ability), Q4, Q5, Q6, Q8 (organizational ability), and Q l8 (overall evaluation) are highly correlated, suggesting that this is a factor
152