© the Mammalogical Society of Japan Short communication
Prey size reconstruction based on myctophid otoliths in scats of northern fur seals (Callorhinus ursinus)
Shiroh Yonezaki 1, *, Masashi Kiyota 1 , Norihisa Baba 2 , Takashi Koido 3 and Akira Takemura 3
1
National Research Institute of Far Seas Fisheries, Fisheries Research Agency, Yokohama 236-8648, Japan
2
Seikai National Fisheries Research Institute, Fisheries Research Agency, Nagasaki 851-2213, Japan
3
Faculty of Fisheries, Nagasaki University, Nagasaki 852-8521, Japan
Diet studies of eared seals (Otariidae) are very important, because they are high-level consumers in marine ecosys- tems (Bowen 1997). Recently, non-lethal methods such as scat analysis have been applied to diet studies of eared seals (e.g., Zeppelin and Ream 2006; Sigler et al. 2009).
In this analysis, diet compositions are estimated from the undigested hard part remains of prey items (fish otoliths, squid beaks, crustacean exoskeletons, etc.; Pierce and Boyle 1991). Fish species are identified based on the morphology of otoliths. Size and weight of fish con- sumed can also be estimated from the lengths of otoliths in scats (Sinclair et al. 1994). Although scat analysis is a useful method that provides dietary information without animal capture, the resultant information could include biases caused by digestion (Jobling and Breiby 1986;
Yonezaki et al. 2003; Gudmundson et al. 2006). Fish otoliths are partially, or even completely, digested during passage through the alimentary system. Feeding experi- ments of various eared seals have been conducted to investigate the potential biasing effects of digestion on otoliths (e.g., Staniland 2002; Tollit et al. 2003). Numer- ical loss and length reduction rates of fish otoliths in scat samples were assessed from captive experiments, and correction factors calculated to enable the reconstruction of the original number and body lengths of fishes that were consumed. These correction factors are known to vary with prey species, eared seal species and experi- mental conditions (e.g., Bowen 2000; Orr and Harvey 2001; Staniland 2002). However, few studies have applied the correction factors to wild samples and tested the validity of the diet reconstruction.
The purpose of this study was to use experimen- tally designed meals and captive northern fur seals (Callorhinus ursinus) to calculate correction factors (CFs) for reconstruction of the myctophid fish size to compensate for the effects of digestion. Moreover, we
apply the CFs to otoliths recovered from the large intes- tine contents of wild fur seal specimens, and estimated the size of the myctophid fish eaten. Myctophid fish used in the experiment are dominant components of micronekton communities in oceanic ecosystems and are important prey items of northern fur seals in the west- ern North Pacific Ocean (Yonezaki et al. 2003; Yonezaki et al. 2008). Therefore, the calculation of CFs of mycto- phid fish otoliths enables data for use in the reconstruc- tion of the diet of northern fur seals based on scats.
Materials and methods Feeding experiments
Feeding experiments were conducted with a sub-adult male (NFS 1; 5-yr-old, body mass 41.5 kg) and an adult female (NFS 2; 14-yr-old, body mass 30.6 kg) northern fur seals kept in the Izu-Mito Sea Paradise (Aquarium), Shizuoka, Japan from November to December 2000.
These experimental animals were kept in 8.0 m
2and 5.5 m
2compartments, respectively. They were maintained on a diet of blue mackerel (Scomber australasicus) and were fed twice daily (in the morning and evening) before each experimental period. Meal sizes were approximately 4.0 kg day
–1(NFS 1) and 2.0 kg day
–1(NFS 2).
The experimental prey (Japanese lanternfish Notosco- pelus japonicus (JL) and California headlightfish Diaphus theta (CH)) were used from samples caught during a trawl survey off the Sanriku coast in August 2000. The long diameter length of sagittal otolith (OL, x: mm) – standard length (SL, y: cm) regression formula for JL was determined by the least-squares method using sub- samples from the trawl survey in 2000. Regression formula for CH was used from Ohizumi et al. (2001).
Regression formulae are given in the following equation:
*To whom correspondence should be addressed. E-mail: [email protected]
Japanese lanternfish:
y = 1.789x + 2.213 (n = 65, r
2= 0.72) California headlightfish:
y = 2.964x – 1.283 (Ohizumi et al. 2001, n = 49, r
2= 0.84) The protocol of a feeding trial was that the fur seals were fed the experimental prey in the morning of the first day, after the experimental feeding, the fur seals were fed blue mackerel without heads and digestive organs twice a day until the end of each trial to avoid contamination of non-experimental otoliths. SLs of experimental prey (True-SLs) were measured to the nearest 0.1 cm prior to the experimental feeding. After experimental feeding, each animal was checked hourly during the day and scats were collected when they were observed. The animals were videotape-recorded during the night and scats were collected the following morning. The trial ended when otoliths no longer appeared in two successive scats. As a result, the duration of the trials was five days. During each trial fur seals were held on land, but were washed by water at the time of room cleaning in the morning and at feeding time. Fur seals were allowed to swim in pools between the trials.
Recovered scats were collected in plastic bags and soaked in the home detergent diluted with water. Scat samples were gently washed under running water through a series of three sieves (2.0, 1.0, and 0.5 mm) in the laboratory. All particles remaining on the sieves were collected and preserved in 70% ethanol. OLs were measured to the nearest 0.01 mm under a binocular microscope. Left and right otoliths were distinguished wherever possible.
For each feeding trial, recovery rates of otoliths were determined. SLs of JL and CH (Estimated-SL) were calculated from the recovered OLs using the above OL-
SL regression formulae.
The shapes of all the collected otoliths from scats can be identified to the prey species (Ohizumi et al. 2001).
Therefore, CFs were calculated by dividing the mean True-SL by the mean Estimated-SL for each prey species and for male and female fur seals (Orr and Harvey 2001).
Analysis of wild northern fur seals samples
Ten northern fur seals (one juvenile male, one juvenile female, and eight adult females) were collected off the Sanriku coast (37°18'N, 141°59'E) by R/V No.38 Kanki- maru (413 GT) on 20 April 1998, as part of ongoing research monitoring program on the reproductive condi- tion of this species. Their mean (±SD) body weight and length were 33.5 kg (±9.8). The fur seals were dissected onboard the research vessel, and the large intestines of specimens were preserved frozen at –20°C. The large intestine samples were thawed and incised later in the laboratory. Otoliths collected from the large intestine contents were treated using the same method as in the feeding experiments. Otoliths of myctophid fishes were identified based on the description of Ohizumi et al.
(2001) and counted under a binocular microscope.
These OLs were measured to the nearest 0.01 mm. SLs were calculated using the regression formulae. Further- more, the calculated SLs were corrected using the CFs determined from the feeding experiments. Considering that northern fur seals show significant sexual dimor- phism, the CFs were applied to each sex.
Trawl sampling and comparison of fish size composition Fish samples were collected during the night of 20 April 1998 off the Sanriku coast (36°58'N, 142°10'E) with a trawl net towed at a speed of approximately 5 knots for 30 min by R/V Shunyo-maru (396 GT). Sam-
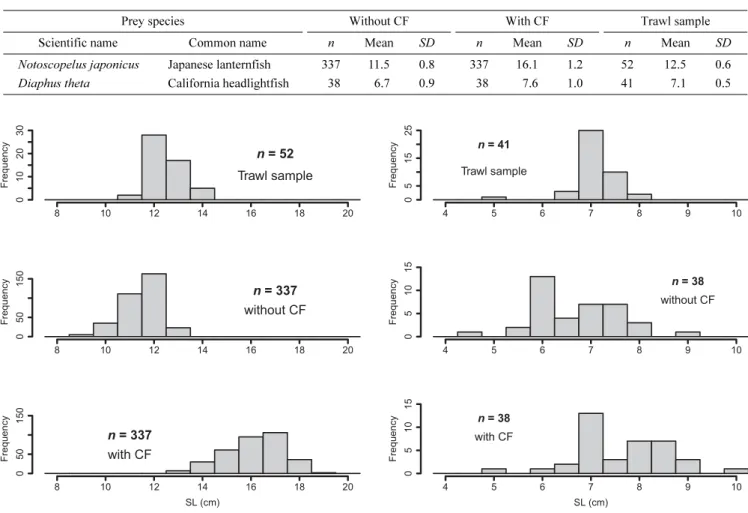
Table 1. Number (n), standard length (SL [cm]; mean and standard deviation [SD]) of experimental prey fed to northern fur seals. Recovery rates of otoliths in scats and calculated SLs from the recovered OLs using the OL-SL regression formula. Percentage of SL reduction calculated by the comparison of True-SL and Estimated-SL and the correction factors for SL.
Experimental prey species
Trial code % Recovery of otoliths
#Ingested prey species Estimated prey species
from otoliths in scats % SL reduction
Correction factor
Scientific name Common name n SL (cm)
n SL (cm)
Mean SD Mean SD
Notoscopelus japonicus
Japanese lanternfish
JL-NFS 1 90.3 36 13.2 0.8 65 10.8 1.1 18.2* 1.22
JL-NFS 2 54.1 37 13.0 0.9 40 9.2 1.7 29.2* 1.41
Diaphus theta California headlightfish
CH-NFS 1 85.5 100 6.8 1.1 170 6.2 1.3 8.8* 1.10
CH-NFS 2 88.0 100 6.7 1.1 176 5.8 1.4 13.4* 1.15
#
![Table 1. Number (n), standard length (SL [cm]; mean and standard deviation [SD]) of experimental prey fed to northern fur seals](https://thumb-ap.123doks.com/thumbv2/123deta/10132874.1966762/2.892.71.820.910.1075/table-number-standard-length-standard-deviation-experimental-northern.webp)