Com
par at i ve Ener gy Pol i c y and D
i s c our s e i n
J apan and G
er m
any: Res ear c h Res ul t s
Com
pi l at i on
著者
タック 川? レスリー
year
2017- 09- 30
平成
29
年度
エネ
ー政策・⾔説の⽇独地域⽐較
Comparative Energy Policy and Discourse in
Japan and Germany
研究報告書
Research Results Compilation
ス ー タッ 川﨑 編著
Leslie Tkach-Kawasaki, Editor
2018
年
1
⽉
January 2018
独⽴⾏政法⼈⽇本学術振興会 課題設定に る先導的⼈⽂学・社会科学研究推進事業領域
開拓プ エネ ー政策・⾔説の⽇独地域⽐較
JSPS Topic-Setting Program to Advance Cutting-Edge Humanities and Social Sciences Research, Area Cultivation “Comparative Energy Policy and Discourse in Japan and
Germany”
Table of Contents
ii
1
5
21
29
41
55
65 Foreword
Introduction
Analysis of the Policy Network for the “Feed-in Tariff Law” in Japan Evidence from the GEPON Survey
by Sae OKURA, Leslie TKACH-KAWASAKI, Yohei KOBASHI, Manuela HARTWIG, and Yutaka TSUJINAKA
エネ ー ッ スと経済の強靭性
-国際比較を通した分析-
Energy Mix and Economic Resilience: An International Comparison By小橋洋平 (Yohei KOBASHI) and 白川慧一 (Kei’ichi SHIRAKAWA)
(Presentation) Innovation or Tradition? Analyzing the Twitter Networks of Japanese Environmental Organizations
By Leslie TKACH-KAWASAKI and Yutaka TSUJINAKA
(Presentation) A Comparative Study of Environmental Policy Actor Networks in Japan and Germany (Presentation Slides)
By Junku LEE
Post 2015 Paris Climate Conference Politics on the Internet
Social media strategies of political institutions on the environment in Germany and Japan
By Manuela HARTWIG
Social Network Analysis of the Network of NGOs Participating in COP21:A Comparative Analysis of the Twitter Network in Germany, Japan, and South Korea
By Junku LEE
Identifying the “Fukushima Effect”: Assessing Japanese Mass Media Coverage of International Nuclear Power Decisions
By Manuela HARTWIG, Sae OKURA, Leslie TKACH-KAWASAKI, and Yohei KOBASHI
77
Foreword
I am pleased to present this compilation of our research results for the Japan Society for the
Promotion of Science Topic-Setting Program to Advance Cutting-Edge Humanities and Social Sciences Research, Area Cultivation, “Comparative Energy Policy and Discourse in Japan and Germany” during the period from October 2014 to March 2018.
We are deeply grateful to the Japan Society for the Promotion of Science for their generous funding of our project. We believe that our current results demonstrate our progress in researching the important issue of climate and environmental change, policy networks in a comparable perspective, and information and communications strategies for communicating policy change through various media formats.
I would also like to thank our qualitative and quantitative research groups for their steadfast endeavors before and during the project period. I hope that we will continue our collaboration in research papers and printed volumes in this research area.
Thank you for your support of our project.
Leslie Tkach-Kawasaki
1
Introduction: The CEDP Project
Leslie Tkach-Kawasaki, University of Tsukuba, Japan
The Comparative Energy Discourse Policy Project (formal English title: “Comparative Energy Policy and Discourse in Japan and Germany”) is a three-year project funded by the JSPS (Japan Society for the Promotion of Science) Topic-Setting Program to Advance Cutting Edge Humanities and Social Sciences Research (Area Cultivation) from October 1, 2014 to March 31, 2018.
In a broad sense, our project aimed at investigating the relationship between energy policy and information/communications structures. Our starting point was a comparative analysis between Japan and Germany, using the J-GEPON (Japan Global Environmental Policy Network Survey) created by Professor Yutaka Tsujinaka and administered in Japan in two waves, first in the late 1990s and then again in 2012-13. A German version of the survey (G-GEPON) was undertaken in the early 2000s, and within the CEDP project, a second wave was undertaken in 2016-17.
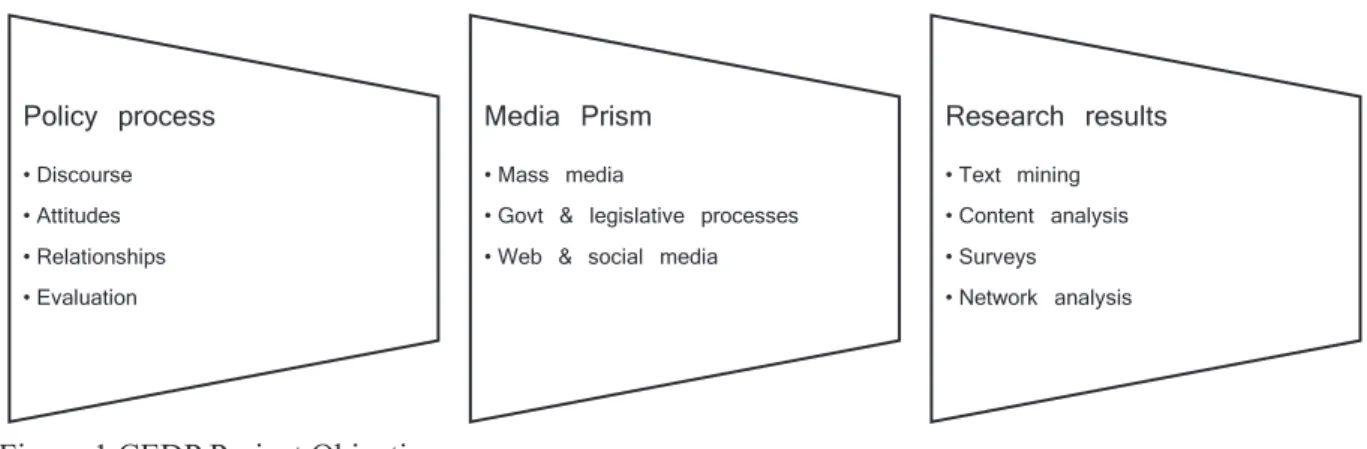
Our aims for the project were as follows. First, to examine and investigate the nature of energy policy through national comparisons on local, regional, and national levels. We also sought to discover actor networks through network analysis that would not have been readily apparent through traditional survey approaches. As a second aim, we explored how new media has been used by different environmental actors as a communications and information provision tool, and compared aspects of new media use with traditional survey data. Finally, through the comparison between Japan and Germany, we have sought to uncover the similarities and differences in energy policy in the hopes of creating a model that can be used in the future for international comparisons at the country level. Our research plan conceptualization is shown in Figure 1.
Figure 1 CEDP Project Objectives
Project Funding
Our project received the following funding from the Japan Society for the Promotion of Science, Topic-Setting Program to Advance Cutting Edge Humanities and Social Sciences Research (Area Cultivation).
Policy process
•Discourse •Attitudes •Relationships •Evaluation
Media Prism
•Mass media
•Govt & legislative processes •Web & social media
Research results
2 Table 1 Project Funding
Period Funding October 2014 to March 2015 1,450,000 yen April 2015 to March 2016 3,391,000 yen April 2016 to March 2017 3,196,000 yen April 2017 to September 2017 3,126,000 yen
Acknowledgements
We would like to thank the Japan Society for the Promotion of Science, our researcher teams within Japan as well as Germany, our survey team for the G-GEPON 2 Survey in Germany, and the graduate students at the University of Tsukuba and the Free University of Berlin who helped us at various times throughout the project’s duration.
3 CEDP Project Team Members
Principal Investigator Leslie Tkach-Kawasaki, Associate Professor, University of Tsukuba, Japan
Co-investigators (Qualitative Research Team)
Yutaka Tsujinaka, Professor, University of Tsukuba, Japan
Miranda Schreurs, Dr. Prof., Technical University of Munich, Germany Verena Blechinger-Talcott, Dr. Prof., Free University of Berlin,
Germany
Yoko Tanaka, Professor, University of Tsukuba, Japan
Naoko Kaida, Associate Professor, University of Tsukuba, Japan Takafumi Ohtomo, Associate Professor, University of Tsukuba, Japan Joji Kijima, Professor, University of Tsukuba, Japan
Manuela Hartwig, Graduate Student, University of Tsukuba, Japan
Co-investigators (Quantitative Research Team)
Tatsuro Sakano, Professor, Tokyo Institute of Technology, Tokyo, Japan Yohei Kobashi, CEO, Watashi-wa, Tokyo, Japan
Kei’ichi Shirakawa, Researcher, Land Institute of Japan, Tokyo, Japan Sae Okura, Assistant Professor, Mie University (formerly University of Tsukuba), Japan
Hajime Murai, Assistant Professor, Tokyo Institute of Technology, Tokyo, Japan
5
Analysis of the Policy Network for the “Feed
-
in Tariff Law” in
Japan
Evidence from the GEPON Survey
1Sae OKURA
Leslie TKACH-KAWASAKI
Yohei KOBASHI
Manuela HARTWIG
Yutaka TSUJINAKA
Energy policy is known to have higher path dependency among policy fields and is a critical component of the infrastructure development undertaken in the early stages of nation building. Actor roles are firmly formed, making it unlikely that institutional change can be implemented. In resource-challenged Japan, energy policy is an especially critical policy area for the Japanese government. In comparing energy policy making in Japan and Germany, Japan’s policy community is relatively firm, and it is improbable that institutional change can occur.
The Japanese government’s approach to energy policy has shifted incrementally in the past half century, with the most recent being the 2012 implementation of the “Feed-In Tariff Law” (Act on Special Measures Concerning Procurement of Renewable Electric Energy by Operators of Electric Utilities), which encourages new investment in renewable electricity generation and promotes the use of renewable energy. Yet, who were the actors involved and the factors that influenced the establishment of this new law?
This study attempts to assess the factors associated with implementing the law as well as the roles of the relevant major actors. In answering this question, we focus on identifying the policy networks among government, political parties, and interest groups, which suggests that success in persuading key economic groups could be a factor in promoting the law.
The strength of our research lays in our focus on political networks and their contributing mechanism to the law’s implementation through analysis of the political process. From an academic perspective, identifying the key actors and factors may be significant in explaining institutional change in policy areas with high path dependency. Close examination of this issue also has implications for a society that can promote renewable and sustainable energy resources.
Introduction
Since the Great East Japan Earthquake occurred on March 11, 2011, energy policy has become a hotly debated policy field throughout the world. Particularly in Japan, the discourse concerning energy policy has evolved into multiple policy trajectories with competing preferences. On one hand, there are assertions that even though Japan experienced a major accident involving nuclear power, policy concerning nuclear power has not evolved into complete de-nuclearization. Proponents of this policy who are concerned about maintaining Japan’s economy claim that there is a need for Japan to re-open
6 the nuclear energy power plants that were shut down shortly after the March 11, 2011 nuclear accident at the Fukushima Dai’ichi nuclear power plant. On the other hand, there are critics of this policy line who advocate serious consideration of the development of safe, non-nuclear energy resources and who assert that expanding new sources of energy will provide tremendous benefits to the country in the future.
From a theoretical point of view, among the various policy fields that are intrinsic to creating national policies, energy policy is arguably the most important and is said to have a higher path dependency compared to other policy areas (Kuper and van Soest, 2003; OECD, 2012, Kikkawa, 2013). Determining energy policy, which is strongly connected to a nation’s economic growth and political stability, requires inputs from multiple actors, identifying current energy needs, and forecasting future requirements. Yet, despite the possibilities for fluid and abrupt change owing to extenuating circumstances, actor roles, such as those played by interest groups, are firmly formed, making it unlikely that institutional change can be implemented (Hartwig et al., 2015).
In resource-challenged Japan, energy policy is an especially critical policy area for the Japanese government. In comparing energy policy creation in Japan and Germany, where the accident at the Fukushima Dai’ichi nuclear power plant had a major impact on energy policy, the range of actors in Japan’s policy community is relatively stable (Hartwig et al., 2015). Furthermore, the Japanese government’s approach to energy policy has shifted incrementally in the past half century, with the most recent being the 2012 implementation of the “Feed-In Tariff Law” (Act on Special Measures Concerning Procurement of Renewable Electric Energy by Operators of Electric Utilities), which encourages new investment in renewable electricity generation and promotes the use of renewable energy. Yet, who were the actors involved and the factors that influenced the establishment of this new law?
This study attempts to assess the factors associated with implementing the law as well as the roles of the relevant major actors. In answering this question, we focus on identifying the policy networks among government, political parties, and interest groups, which suggests that success in persuading key economic groups could be a factor in promoting the law.
1. Background of renewable energy in Japan
(1) Legal framework promoting renewable energy in Japan
Japan’s energy policy is regulated under the Basic Act on Energy Policy (promulgated in June 2002) that was enacted in order to ensure basic policy for energy resource utilization, and each energy resource, including nuclear energy and renewable energy, is regulated under this law.
In addition, utilization of renewable energy resources is regulated under “Sophisticated Methods of Energy Supply Structures” which aims at promoting the use of the renewable energy resources by energy supply companies. Renewable energy includes non-fossil energies that can be used sustainably (Article 2.3). More specifically, solar energy, wind power energy, low-head hydro power, geothermal energy, aerothermal energy, earth thermal energy, and other types of renewable energy resources are included under this law (Decree Article 4).
New energy types that refer to one of the renewable energy resources are regulated under the “Law Concerning Special Measures to Promote the Use of New Energy (New Energy Law)” which aims at promoting the use of new energy resources that are comparably not as widespread. Due to their relative novelty and development costs, it is disadvantageous for energy companies to invest heavily in these resources at this time because of the high costs in supplying such resources initially borne by energy supply companies. More specifically, such new energy resources defined under this law include solar energy, wind power energy, solar thermal application, temperature difference energy, waste power energy and biomass energy.
(2) Historical Background
7 and geothermal energy, make up a smaller portion of Japan’s energy supply (7.2% of primary energy supply in 2012). As shown, nuclear energy provided only 0.7%, and this low figure is due to the suspension of almost all nuclear energy generating plants after the Fukushima Dai’ichi incident in March 2011. However, prior to suspending operations in the plants, nuclear power provided approximately 10% of Japan’s primary energy supply from the end of the 1980s to 2010. In other words, Japan’s energy supply structure has been composed mainly of fossil-fuel energy sources, and nuclear energy and renewable energy have been used as a secondary resource base to accommodate any shifts in primary energy supply for domestic demand.
Figure 1: Resource shifts in Japan’s domestic energy supply, 1965 to 2011 (Unit: 1018J)
Source: Ministry of Economy, Trade and Industry (Ed.) (2014). The Cabinet Approved the 2014 Annual
Report on Energy (Japan’s Energy White Paper 2014), Figure 211-3-1
(http://www.enecho.meti.go.jp/about/whitepaper/2014html/2-1-1.html). (Access Date: 2015/09/24)
Figure 2: Composition shifts in Japan’s domestic energy supply (Unit: %)
Source: Ministry of Economy, Trade and Industry (Ed.) (2014). The Cabinet Approved the 2014 Annual
Report on Energy (Japan’s Energy White Paper 2014), Figure 211-3-1
(http://www.enecho.meti.go.jp/about/whitepaper/2014html/2-1-1.html). (Access Date: 2015/09/24)
As shown in Figure 2, since 2011, Japan’s reliance on nuclear energy has decreased dramatically (owing to the government’s decision to shut down almost all of the country’s nuclear power plants in the wake of the Fukushima Dai’ichi incident. As of the summer of 2015, there was only one nuclear plant operating in Japan.
0.00 2.00 4.00 6.00 8.00 10.00 12.00 14.00 1 9 6 5 1 9 6 7 1 9 6 9 1 9 7 1 1 9 7 3 1 9 7 5 1 9 7 7 1 9 7 9 1 9 8 1 1 9 8 3 1 9 8 5 1 9 8 7 1 9 8 9 1 9 9 1 1 9 9 3 1 9 9 5 1 9 9 7 1 9 9 9 2 0 0 1 2 0 0 3 2 0 0 5 2 0 0 7 2 0 0 9 2 0 1 1
Crude oil Coal
Natural gas Nuclear power
Hydro power New energy, Geothermal etc.
0% 10% 20% 30% 40% 50% 60% 70% 80% 90% 100% 1 9 6 5 1 9 6 7 1 9 6 9 1 9 7 1 1 9 7 3 1 9 7 5 1 9 7 7 1 9 7 9 1 9 8 1 1 9 8 3 1 9 8 5 1 9 8 7 1 9 8 9 1 9 9 1 1 9 9 3 1 9 9 5 1 9 9 7 1 9 9 9 2 0 0 1 2 0 0 3 2 0 0 5 2 0 0 7 2 0 0 9 2 0 1 1
8 (3)Literature Review: Determinants of Japan’s Energy Policies
What kind of factors affect political decisions regarding Japan’s energy policy? In general, energy supply system has not changed dramatically. One reason may be because energy policy is known to have a higher path dependency among policy fields (Berkhout 2002; Kuper and van Soest, 2003; Okumura, 2007; OECD, 2012; Kikkawa, 2013) and is a critical component of the infrastructure development undertaken in the early stages of nation building. Actor roles, such as those played by interest groups, are firmly formed, making it unlikely that institutional change can be implemented. Okumura Norihiko suggests that new global energy strategies and modeling based on the path dependency and lock-in (Okumura, 2007) may provide some clues as to how energy policy shifts occur. The OECD’s Green Growth Studies analysis reports that the energy sector posed a particular challenge in the context of green growth due to its size, complexity and path dependency (OECD, 2012: 5).
Regarding Japan’s energy policy, the features of post-war policy organization in Japan include principles of a shared management system, preliminary policy reviews by the ruling political party (coalition leader), and a dual system of government administration involving the bureaucracy and the political party in power. Among those features, mutually autonomous organization of the ministries form the core of what Morita (2000, 103) refers to as the shōchōkyōdōtai (ministerial consortium) composed of the bureaucracy, elected politicians who are aligned with specific policy groups, and for-profit organizations. Able to circumvent the cabinet, this ministerial consortium has exerted a major influence on policy-making. Within this system, in particular, Morita (2000, 106) notes that “in the case where a new issue is discovered that lies outside existing issue areas, a ‘turf war’ develops which multiplies the adverse effects.” Global environmental policy is precisely such an issue. The ministerial consortium charged with the objective of protecting the environment finds itself in the position wherein it must promote measures that conflict with its influential counterpart composed of industry groups, lawmakers, and business administrators. This leads to environmental policy becoming a policy area that is polarized between two ministerial consortia. As a result, a conflict structure composed of proponents and opponents with competing measures is formed (Kubo, 2012: 135).
Kubo Haruka investigated the influence of political restructuring and government reorganization since the 1990s on environmental policy in general with particular attention to measures concerning global warming. Identifying five factors, including relationships among main actors concerning policy formation, adjustment area and stages, the scope of the policy area, the relationship between the measures that involve the policy, and policy direction, Kubo examined the presence or absence of policy transformation and analyzed the content of such transformation. Kubo found that there was an observed transformation in the latter half of the 2000s. Along with expansions of the range of the Cabinet Secretariat’s planning functions, there was also change in how inter-ministerial adjustments were conducted through an increase in joint committee meetings and joint administration projects. Furthermore, transformation was also propelled by the expanding political power of environmental NGOs (non-government organizations) and a change in consciousness within the Ministry of the Environment. The overall result was a relative reduction in inter-ministry conflict. As such, these identified elements led to what could be perceived as a change in policy output (Kubo, 2012).
In addition, using ozone depletion treaties as a case study, Kubo also explored how obligations imposed by international treaties were being fulfilled domestically and analyzed the national implementation framework and process. Kubo’s results showed that through the activation of cross-border activities of companies and environmental NGOs, each organization’s international network contributed to resolving issues. Furthermore, she identified coalesced policy areas occupied by the public and private sectors, as well as international and domestic policy areas.
9 community is more dynamic, Japan’s policy community is relatively stable, and it is improbable that institutional change can occur (Hartwig et al., 2015).
2. Framework and Methodology
(1) Framework
We assume that direct and indirect connections between industrial and environmental sectors enhance environmental policy-making processes. Gesine Foljanty-Jost suggests that the German policy-making network in 1990s was more tightly integrated than its Japanese counterpart (Foljanty-Jost 2005). She indicates that NGOs in Japan lacked personnel resources and are not located in influential positions in the network. In this paper, we use data from the “Global Environmental Policy Network Survey (GEPON2).”2 In order to target our analysis, we focus on the integration of the
feed-in tariff policy-makfeed-ing process.
The other perspective in our analysis is flexibility within the policy network. As noted above, the Japanese renewable energy policy-making network is considered to be relatively stable and stationary. In order to assess if acquiring flexibility might be associated with the enactment of the feed-in tariff law, we analyze different types of networks to investigate differences between policy communities and issue networks.
(2) Methodology
We calculated the centrality measures, drew the feed-in tariff policy-making networks, and set organization-level and sector-level units as vertices. The organization-level units are organizations regarded as major actors in global environmental policy. The edges represent daily communication or lobbying activities between them. The sector-level units are categories based on legal status and activity. We attach more weight to betweenness than degree centrality in order to clarify which actors contribute to integration.
We drew the networks according to the following manner. The sizes of the vertices is proportional to the square root of betweenness centrality. Each edge is weighted by the number of linking organizations when we deal with sector-level networks. And vertices are positioned by the Fruchterman-Reingold algorithm.
First, we identified the network that relates to “information” as the “information network” and similarly identified “human and material support” network as the “support network.” These networks describe the daily exchanges related to climate change and energy policy in general and are best understood to be universal networks that do not focus on a particular policy. By comparing the two networks, we can measure their flexibility. If the two networks vary considerably, we expect that the FIT (feed-in-tariff) policy-making network will be similar to the issue network that can change in response to a particular policy (Heclo, 1978; Smith, 1991). In contrast, the results that do not vary significantly suggest that the FIT network maintains a fundamentally stable formation similar to the political community.
(3) Data sources3
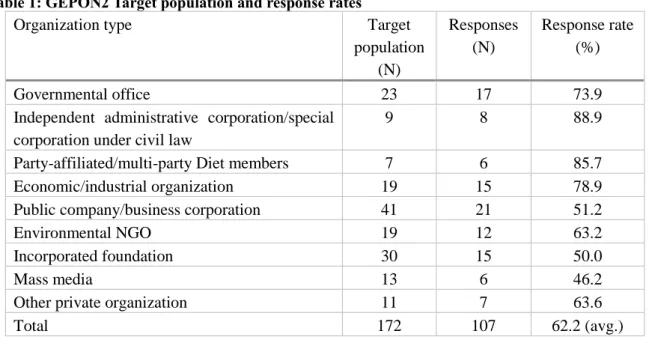
As noted above, our data source is the GEPON2 Survey. Table 1 shows the proportions of the target population and response rates received between December 2012 and June 2013. The target population for the survey was determined as follows. Within the survey, “organizations that influence policies regarding global warming” were positioned as the target population for the survey. Thus, the survey was not conducted via random sampling, but rather, used multiple references to identify the organizations that were considered to be influential. After this identification process, these organizations were used as the target population for the survey. Table 2 shows the five main categorizations of organizations.
2The “Global Environmental Policy Network Survey II” (GEPON2), directed by Professor Yutaka Tsujinaka of the University of Tsukuba, was conducted between December 2012 and June 2013. The respondent rate was 62.2% (target population of 172 organizations, responses gained from 107 organizations including political parties, the government, interest groups, and civil society organizations.
10 Table 1: GEPON2 Target population and response rates
Organization type Target population (N) Responses (N) Response rate (%)
Governmental office 23 17 73.9
Independent administrative corporation/special corporation under civil law
9 8 88.9
Party-affiliated/multi-party Diet members 7 6 85.7 Economic/industrial organization 19 15 78.9 Public company/business corporation 41 21 51.2
Environmental NGO 19 12 63.2
Incorporated foundation 30 15 50.0
Mass media 13 6 46.2
Other private organization 11 7 63.6
Total 172 107 62.2 (avg.)
Table 2: Indicators used to verify survey targets
Category Index
A. Actors, government agencies, or scholars participating in national and international policy formation (83 organizations)
Participants in both COP154 and COP175,
participants in Ministry of the Environment (MOE) commission meetings as well as parliamentary hearings of related bills,
representatives from the top five parties in terms of legislative seats of the House of
Representatives. B. Actors involved in implementing national
policies for the reduction of industrial greenhouse gas emissions (26 organizations).
High-ranked greenhouse-gas-emission-producing organizations according to governmental documents, major domestic companies with business plans involving renewable energy according to news reports in the Asahi newspaper and the Nihon Keizai
newspaper. C. Actors, NGOs and mass media participating
indirectly in policies aimed at reducing greenhouse gas emissions (29 organizations)
NGOs with resources and interest in global warming, mass media organizations.
D. Actors considered to be important as identified by global warming policy specialists in 1997 (87 organizations)
Organizations that responded to the first GEPON survey conducted in 1997.
E. Other (12 organizations) Researchers‘ judgement.
4 15th Conference of the Parties (COP 15) to the United Nations Framework Convention on Climate Change (UNFCCC) held
in 2009.
11 We used the following questions for our analysis.
Policy community 1: Information network
Responses to the following two questions in the GEPON 2 Survey were used to map the information network.
Question 7: With regards to policy responses to climate change, who does your organization give information to? (Multiple answers)
Question 8: With regards to policy responses to climate change, from whom does your organization obtain information? (Multiple answers)
Policy community 2: Support network
Responses to the following two questions in the GEPON 2 Survey were used to map the support network.
Question 9: With regards to policy responses to climate change, to whom does your organization give personnel and physical support (not information)? (Multiple answers)
Question 10: With regards to policy responses to climate change, from whom does your organization obtain personnel and physical support (not information)? (Multiple answers)
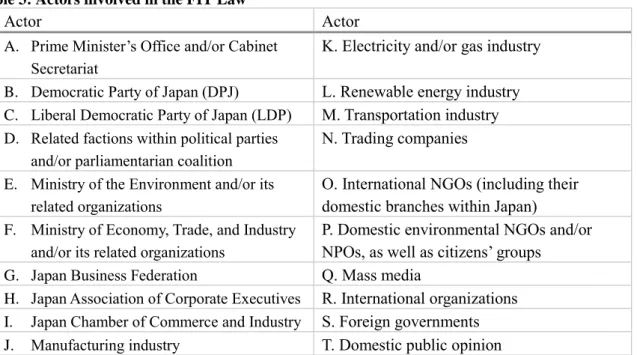
Issue network
Question 35 in the GEPON 2 Survey asked respondent organizations to indicate with whom they work with regarding the FIT Law (multiple responses were allowed) from the organizations listed in Table 3.
Table 3: Actors involved in the FIT Law
Actor Actor
A. Prime Minister’s Office and/or Cabinet Secretariat
K. Electricity and/or gas industry
B. Democratic Party of Japan (DPJ) L. Renewable energy industry C. Liberal Democratic Party of Japan (LDP) M. Transportation industry D. Related factions within political parties
and/or parliamentarian coalition
N. Trading companies
E. Ministry of the Environment and/or its related organizations
O. International NGOs (including their domestic branches within Japan)
F. Ministry of Economy, Trade, and Industry and/or its related organizations
P. Domestic environmental NGOs and/or NPOs, as well as citizens’ groups
G. Japan Business Federation Q. Mass media
H. Japan Association of Corporate Executives R. International organizations I. Japan Chamber of Commerce and Industry S. Foreign governments J. Manufacturing industry T. Domestic public opinion
Attitude network
Responses to the following two questions in the GEPON 2 Survey were used to map attitudes toward the FIT Law.
Question 33: Within the 2011 FIT Law, promotion of the use of renewable energy resources by the government and increasing power rate were crucial issues. What was your organization’s attitude towards these issues?
(a) Did you agree with the government’s promotion of the use of renewable energy resources? (Response choices: Agree, somewhat agree, somewhat disagree, disagree, or not interested.)
12 promotion of the use of renewable energy resources? (Response choices: Could acknowledge, acknowledge to a certain extent, did not acknowledge to a certain extent, did not acknowledge, or not interested.)
Two different organizational categories were used for this analysis. We used the category of Question 35 to analyze the data with regards to Question 35, and used (a) the legal status and (b) the category based on the activities with regards to other questions.
3. Results6
As mentioned above, we describe policy community from information network and support network, and compare it with issue network with regards to Japan’s FIT Law. In addition, we use the “group category” such as National NGO, global NGO, parties, METI and so on to analyze Figure 3, Figure 6 and Figure 9 while we analyze the institution itself to make Figure 4, Figure 5, Figure 7 and Figure 8.
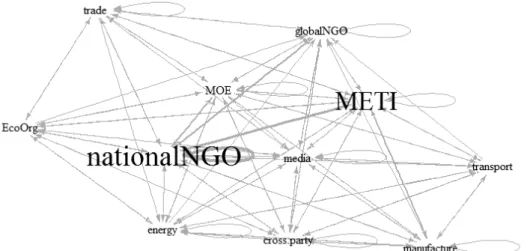
(1) Information network
First, we drew the information network from the responses to Question 7 (identifying information recipient organization) and Question 8 (identifying information provision organization).
Figure 3 shows the information network that we drew from responses to these two questions. Situated in the center of Japan’s information network are the Ministry of Economy, Trade, and Industry (METI), and national NGOs, while economic and industrial organizations (including trade organizations, economic organizations, energy organizations, and manufacturing organizations) and political parties stand at the periphery. Composed of other actors, such as MOE and media, their presence lies between the center and the periphery. We confirmed a strong tie between METI and the national NGOs from Figure 3 as well.
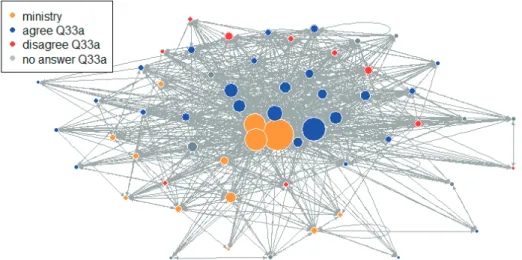
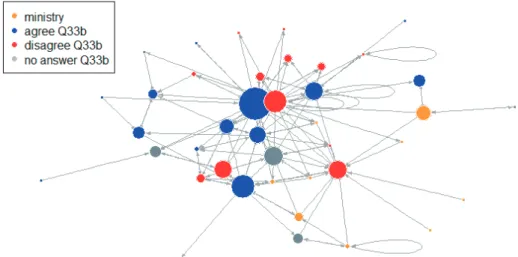
Figures 4 and 5 show the information networks that we drew from the questions above. The colors show the four classifications that were formed on the basis of attitudes towards Japan’s FIT Law: Blue denotes agreement with FIT group, red denotes disagreement with FIT group, yellow denotes the ministries, and gray denotes “no answer”.
Situated in the center of Japan’s information network are the ministries and the group that agrees with the FIT Law, while those that disagree with the FIT Law are located at the periphery. In other words, we confirmed that there was fundamental agreement with regards to the FIT Law between the actors who are situated at the center of the information network such as ministries and the ”agreement” groups.
Figure 3: Information exchange (Q7 and 8)
13
Figure. 4: Information and attitude network (Q7, 8, Q33a)
Figure 5: Information and attitude network (Q7, 8, Q33b)
(2) Support network7
Turning to the policy community support network, we drew the network from the following two questions:
Question 9: With regards to policy responses to climate change, to whom does your organization give personnel and physical support (not information)? (Multiple answers)
Question 10: With regards to policy responses to climate change, from whom does your organization obtain personnel and physical support (not information)? (Multiple answers)
Figure 6 shows the support network that we drew from the responses to these two questions. Situated in the center of Japan’s support network are METI and national NGOs, and trade organizations are relatively centered as well. However, the economic and industrial organizations, such as economic organizations, energy organizations and manufacturing organization, political parties, and MOE stand at the periphery. We confirmed a strong tie between METI and the national NGOs from Figure 7 as well.
Figures 7 and 8 show the support network that we drew from the questions above. The “agreement” groups were positioned at the center of Japan’s support network, while the “disagreement” groups and
14 ministries lie at the periphery. However, the tie between the “agreement” groups and the “disagreement” groups exists, and they are not separated completely.
Figure 6: Support network (Q9, 10, Q35)
15
Figure 8: Support network (Q9, 10, Q33b)
(3) FIT network
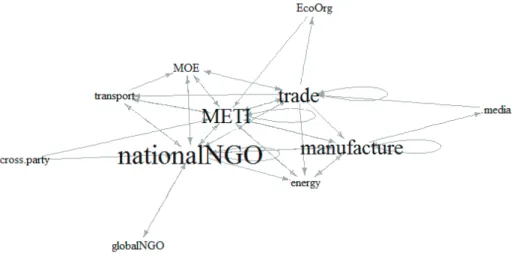
Turning to Japan’s issue network with regards to FIT Law, we drew the network using the following question: Q35. With whom does your organization work regarding the FIT law? (Multiple answers) Figure 9 represents the issue network that we drew from the question above. Situated in the center of Japan’s issue network are METI and MOE, and the national NGOs and global NGOs lies near these ministries, while the economic and industrial organizations, such as manufacturing organizations, economic organizations, trade organizations, transport organizations and energy organizations, stands at the periphery.
Our network mapping in Figure 9 indicates that the issue network shows a tie between METI and national NGOs and global NGOs, and a tie between MOE and the economic organizations and manufacturing organizations. In other words, we were able to confirm a relatively firm tie between the economic and industrial groups and the environmental groups, and they are not separated completely.
Figure 9: Issue network (Q35)
(4) Comparison
16 1991). In contrast, as there is not a significant variance, our results suggest that the FIT network maintains a fundamentally stable formation similar to the political community.
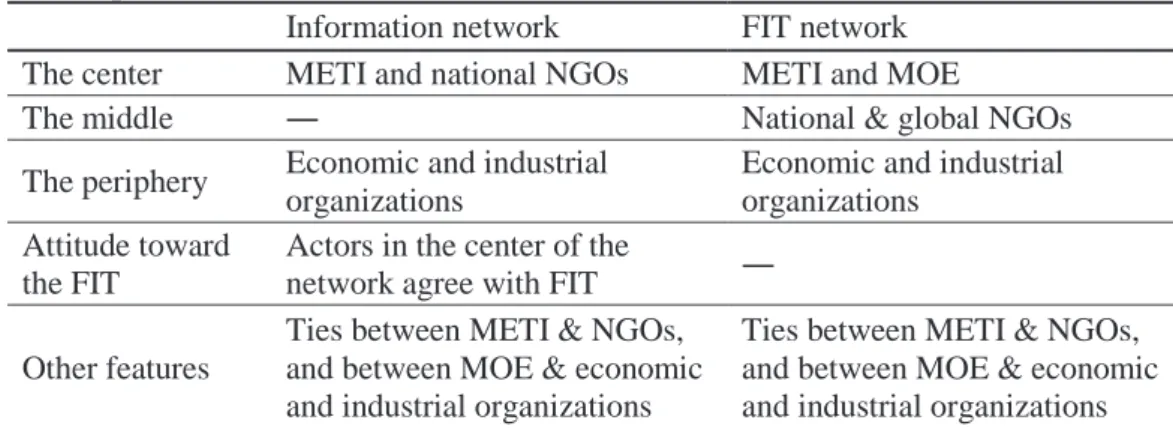
Based on the information network and support network, METI and the national NGOs are at the center of the network, while economic and industrial organizations are at the periphery. Moreover, the actors at the center of the network agree with the FIT law, while cautious actors are at the periphery. However, the two different groups are not separated completely and there are ties between METI and the national NGOs, as well as between MOE and the economic and industrial organizations.
On the other hand, based on the FIT network, METI and MOE are at the center of the network and the national NGOs and global NGOs are clustered around them. The economic and industrial organizations are farther away at the periphery. Here as well, there are the ties between METI and NGOs, as well as between MOE and the economic and industrial organizations.
By comparing two networks, we can confirm the FIT policy-making network is similar to the information network and support networks that describe the daily exchanges related to climate change and energy policy in general in terms of the following two points. First, the network structures are likely to be similar; METI and MOE are at the center of the network, and the national and global NGOs are around them, and the economic and industrial organizations are more at the periphery. Second, there are the ties between METI and the NGOs, as well as between MOE and the economic and industrial organizations, and they are not separated completely. These results allow us to suggest that the FIT network maintains a fundamentally stable formation similar to the political community.
These policy network structures could explain that the reason why the FIT Law was enacted. The FIT policy-making network is similar to the information network and support network, demonstrating firmness and stability. Moreover, the political actors at the center of the network are in agreement with the FIT Law. That suggests that political agreement between actors has been built gradually through primary political adjustments such as councils. As a whole, the FIT Law has been an enduring political issue during the short-lived DPJ administration (2009 to 2012) and the resurgence of the LDP government in the general election of December 2012. This connection to political processes and policy formation could explain how the FIT Law came to be enacted after March 2011.
Table 4: Comparison
Information network FIT network The center METI and national NGOs METI and MOE
The middle ― National & global NGOs
The periphery Economic and industrial organizations
Economic and industrial organizations
Attitude toward the FIT
Actors in the center of the
network agree with FIT ―
Other features
Ties between METI & NGOs, and between MOE & economic and industrial organizations
Ties between METI & NGOs, and between MOE & economic and industrial organizations
4. Conclusion and future directions
As mentioned above, energy policy fields are said to maintain a higher path dependency. However, despite of this fundamental policy feature, the FIT Law was enacted in 2011 in Japan. This study attempted to assess the factors associated with implementing the FIT Law as well as the roles of the relevant major actors. More concretely, through this comparison, we discovered that the FIT policy-making network is similar to the information and support networks that describe the daily exchanges related to climate change and energy policy. We were also able to measure flexibility. As a result, we can confirm the fact that the network structures are likely to be similar and that there are the ties between METI and the NGOs, as well as between the MOE and the economic and industrial organizations. That the results do not vary significantly suggests that the FIT network maintains a fundamentally stable formation similar to the political community.
17 Moreover, the political actors at the center of the network are in agreement with the FIT Law. This result suggests that political agreement between actors has gradually been built through primary political adjustments such as the councils. In the past five years, the FIT Law has been a political issue from its inception to its enactment after March 2011.
The strength of our research lays in our focus on political networks and their contributing mechanism to the law’s implementation through analysis of the political process. From an academic perspective, identifying the key actors and factors may be significant in explaining institutional change in policy areas with high path dependency.
In the future, we will continue this line of inquiry with regards to other policy initiatives involving the energy sector, including the deregulation of electricity companies (which is set to come into force within the next three years in Japan). By assessing the policy networks for individual issues and comparing them over time, we believe that we can reveal new dimensions in political relationships and policy formation. While this research has focused on close examination of the FIT Law, the wider implications suggest a framework for assessing how societies can promote renewable and sustainable energy resources.
References
Berkhout, F. (2002). Technological regimes, path dependency and the environment. Global Environmental Change, 12, 1-4.
Foljanty-Jost, G. (2005). NGOs in environmental networks in Germany and Japan: The question of power and influence. Social Science Japan Journal, 8(1), 103-117.
Gerard, K., & van Soest, D. P. (2003). Path-dependency and input substitution: implications for energy policy modeling. Energy Economics, 25, 397-4-7.
Hartwig Manuela, Kobashi Yohei, Okura Sae, & Tkach-Kawasaki Leslie. (2015). Energy Policy Participation through Networks Transcending Cleavage: an Analysis of Japanese and German Renewable Energy Promotion Policies. Quality and Quantity, 49(4), 1485-1512.
Heclo, H. (1978). Issue Networks and the Executive Establishment. In A. King (Ed.), The New American Political System. Washington, DC: AEI (pp. 87-124).
Kikkawa, T. (2013). Japan’s Energy Problems(Nihon no enerugĩ mondai). Japan: NTT Publishing. Kobashi, Y., & Tsujinaka, Y. (2014). "The Aim and Abstract of the Survey (Chōsa no neraito jisshi
gaiyō)". In Global Environmental Policy Network Survey, 2 (GEPON 2): An Interim Report. Ibaraki, Japan: The University of Tsukuba (pp. 3-17).
Kubo, H. (2005). “Domestic Policy implementation and Process for Treaty for the Protection of the Ozone Layer: Evidence from Activities of Domestic Companies (Ozon sō hogo jōyaku no kokunai jisshi taisei to katei: Kokunai jijōsha no torikumi ni shōten wo atete)”. In Shiroyama H. and Yamamoto R. (eds). Dissolving Borders, Transcending Law 5 Environment and Life (Tokeru
sakai koeru hou 5 kankyō to seimei): University of Tokyo Press (pp.233-273).
Kubo, H. (2012). “Global Environmental Policy: Shifts in Climate Change Policy and Realignment of Politics and Ministries (Chikyū kankyō seisaku: Ondanka taisaku no henyō to seikai saihen shōchō saihen)”. In Morita, A. and Kanai, T (eds). Shifts in Policies and Institutional Design: The administration around Realignment of Politics and Ministries (Seisaku henyou to seido
sekkei: seikai shōchō saihen zengo no gyōsei: Mineruva shōbo (pp.133-178).
Morita, A. (2000). Administration in Modern Japan (Gendai no gyōsei): The Open University of Japan. OECD. (2012). OECD Green Growth Studies: Energy. OECD Publishing. Retrieved from http://www.oecdilibrary.org/docserver/download/9711081e.pdf?expires=1445176133&id=id&a ccname=ocid74023650&checksum=C6CB1372EB9CA0936281C3252631C4E4
Okumura, N. (2007). Path dependency, lock-in and the economy of global energy strategies (Keiro izon,
rokku in to gurōbaru enerugī senryaku). Energy Economics, 33(2), 33-39.
Smith, M. J. (1991). From Policy Community to Issue Network: Salmonella in Eggs and the Politics of Food. Public Administration (Vol. 69, pp. 235-255).
18 Appendix
Appendix Table 1: Network Characteristics
Information network Support network Information (group) Support (group) Q35 (group)
Density 0.324 0.090 0.780 0.311 0.515
Transitivity 0.567 0.266 0.920 0.574 0.726
Reciprocity 0.724 0.529 0.936 0.703 0.581
N 59 40 12 12 12
Appendix Table 2: Means of Centrality Measures (Information Network)
Category In-degree Betweenness PageRank N
Ministry 20.385 94.353 0.017 13
Govt. related 22.333 76.472 0.018 6
Party 35.500 59.595 0.034 2
Cross-party 14.000 9.553 0.014 1
Company 11.857 3.070 0.010 7
Economic 16.000 18.239 0.016 2
Industrial 15.000 8.300 0.013 10
Media 37.000 73.218 0.034 2
NGO 23.286 15.896 0.022 7
Foundation 13.833 15.366 0.014 6
Other 13.667 6.654 0.015 3
Total 18.814 39.407 0.017 59
Appendix Table 3: Means of Centrality Measures (Support Network)
Category In-degree Betweenness PageRank N
Ministry 1.556 15.162 0.010 9
Govt. related 9.250 251.651 0.051 4
Party 0.000 0.000 0.004 1
Company 6.000 125.896 0.030 5
Economic 1.000 0.000 0.004 2
Industrial 2.286 33.452 0.023 7
Media 2.000 38.000 0.013 1
NGO 4.750 67.721 0.052 4
Foundation 3.000 79.093 0.024 5
Other 3.000 18.475 0.021 2
19
Table Appendix-4: Centrality Measures (Group Level Information Network)
Category In-degree Betweenness PageRank
LDP 0 0.000 0.013
Cross-party 10 0.000 0.117
MOE 10 0.000 0.109
METI 11 35.500 0.077
Economic Org. 7 0.000 0.113
Manufacturer 8 0.000 0.046
Energy 10 0.000 0.098
Transport 7 0.000 0.094
Trade 7 0.000 0.080
Global NGO 11 0.000 0.113
National NGO 11 51.500 0.048
Media 11 0.000 0.090
Appendix Table 5: Centrality Measures (Group Level Support Network)
Category In-degree Betweenness PageRank
Cross-party 0 0.000 0.014
MOE 4 0.000 0.110
METI 9 14.500 0.250
Economic Org. 1 0.000 0.032
Manufacturer 5 17.000 0.116
Energy 4 0.000 0.100
Transport 3 0.000 0.095
Trade 5 16.000 0.130
Global NGO 1 0.000 0.020
National NGO 8 44.500 0.092
Media 1 0.000 0.041
Appendix Table 6: Centrality Measures (Q35)
Category In-degree Betweenness PageRank
LDP 7 1.500 0.119
Cross-party 6 0.000 0.070
MOE 8 10.167 0.108
METI 8 18.750 0.134
Economic Org. 5 0.250 0.082
Manufacturer 6 1.250 0.082
Energy 6 0.250 0.086
Transport 3 0.000 0.052
Trade 4 0.000 0.057
Global NGO 4 1.417 0.058
National NGO 5 3.417 0.063
21
経
強靭性
-国際比較
通
析-
Energy Mix and Economic Resilience:
An International Comparison
橋
洋
(Yohei KOBASHI)
白川
慧
(Kei’ichi SHIRAKAWA)
本章 日本 政策 基本的 方針 あ 経 強靭性 いう
観点 評価 日本 ョ 以降 発電方式 多様化 重視 原子力 火力
水力 電源 供給 電源 目指 1
資源 庁 定期的 長期 需給 見通 発表
さ 全 占 原子力 火力 水力 含 再生 能 目標比率
示さ 種 捉え 化石燃料
価格 変動 対 散 効果 あ 期待さ
散 機 対 強靭性 区 考え 必要 あ 従来
ョ や東日本大震災 う 突発的 広範 影響 及 機 対応
十 い 指摘さ い Aiginger 2009;藤井 久米 林 2014
基本計画 基軸 据え 強靭性 含 多角的 観点
評価 意義 あ 考え OECD 26 国 用い 析
経 強靭性 関係 検証
1.
研究
背景
目的
日本政府 2014 発表 基本計画
2
東日本大震災以降 原子力発電
所 停 化石燃料 依存 高 影響 経 及 い
問題視 い 民主党政権 度 見直 検討さ 長期
需給 い 各 源 特性 踏 え 配備 重要性 唱え
い 翌 発表さ 長期 需給見通
3
経 環境 方 配
1
電気 業連合会 http://www.fepc.or.jp/enterprise/supply/bestmix/ 2018 1 14日閲覧 .
2
経 産業省. (2014). 基本計画.
http://www.enecho.meti.go.jp/category/others/basic_plan/pdf/140411.pdf 2018 1 21日閲覧 .
3
22
慮 経 需給構造 目指 2030 度 次 供給比率 再生 能
13~14% 原子力10~11% 然 18% 石炭25% LPG3% 石油30%程度 見積
い
う 前提 政策 化石燃料価格 高騰 対
経 安定 自給率 改善 い 想定さ 課題 対 定 効果 あ
期待さ 方 ョ う 突発的 影響 広範 機 対 十
いえ 疑問 残 Aiginger 2009 サ 機 う ョ
従来 経 安定 施策 対応 う 機 対 強靭性
resilience 定 新 要因 明 必要性 指摘 藤井 久米
林 2014 近 概念 世界的 注目 集 い 指摘 致命
傷 い 被害 最 化 回復 いう3 要因 述 い
藤井 東日本大震災や 念頭 老朽化 整備や 対策 機
対 直接的 対策 必要性 唱え い う 例 限 測 態 対
強靭性 様々 角度 評価 改善 大 考え
以 踏 え 本章 経 的 強靭性 評価 目的
GDP 変動 関係 い OECD 26 国 国家間比較 考察
行う
2.
狙い
強靭性
2.1. 基本方針 据え 狙い
前述 長期 需給見通 政策 要諦 安全性 Safety
安定供給 Energy Security 経 効率性 向 Economic Efficiency 3
あ 3 環境 適合 Environment え 考慮
総合的 断 策定さ い 具体的 指標 原発依存度 自給
率 中東依存度 電力コ 国民負担 CO2排出量 挙 い 以 複数
目標 両立 各電源 個性 生 趣旨
例え 再生 能 自給率向 CO2排出抑 貢献 方
陽 や風力発電 安定 出力 投資 含 電力コ 高い 見 い
宮山 藤井 2015 指標 複数あ いう点 違い あ 異 特徴 持
各電源 組 合わ 目標 指標 散 抑え 期待値 最大化 い
う点 金融工学 共通 政府 記 指標全 対
散 抑え 定以 期待値 う電源 配 決 いう最適化問題 組
い いえ
実際 算出 方法 経 基 ュ
ョ あ 例え 藤井 2015 将来 電力需給 い 定 前提 置
電力需給 線形計画問題 解析 いう手法 結果
電源構成 最 適 評価 い
2.2. 想定さ い い強靭性
記 強靭性 定義 照 安全性や安定供給 い 指標 強靭性 対応 指標
見 電源コ 最適化 場合 比 強靭性 配慮 計画
言え え 組 各指標 散 抑え
社会 経 回復 困難 大 負 影響 及ぶ確率
観点 強靭性 改善 能性 あ
23
方 基本計画や長期 需給見通 記載さ い 内容 従 う ョ や自然災害 い 突発的 広範 及ぶ 機 対
強靭性 十 考慮さ い い 原子力発電所 信頼 安全性 高 いう課題
挙 い 想定 ョ う 機 対
組 いう従来 方針以外 示さ い わ い 震災 や ョ 影響 原発 停 石油価格 高騰 い 市場 直接及ぶ 影響 被災 被 企業 引 被災地 社会 経 的
ョ 背景 あ 戦争 影響 市場 停滞 象 間接的 市場 影響 及 う
Christopher 2004 強靭 サ Resilient Supply Chain 考察 基
サ 通 波及 耐えう う 強靭性 鍵 あ 従来 政策 対応 い問題 さ ョ 例
議論 い 石油価格 高騰 各企業 及 負 影響 あ 企業 波及 サ 時多発的 発生 影響 扱 い い
以 問題 基本計画 枠内 対処 い 政策
絞 考え 場合 政策 前提 強靭性
観点 望 い 議論 余地 あ 仮 技術革新 生 新 電 源 強靭性 いう観点 極 優 い 場合 度外視 電源 重点的 配備 方 望 い場合 考え う 場合 いう前 提 あ 政策 柔軟性 失わ う いう見方
石油価格 高騰 及 影響 和 サ 波及 前 段階 定 抑 力 結果的 強靭性 改善 寄 い 能性 あ 強靭性 寄 う いう論点
当性 論 重要 あ 強靭性 改善 指標 見い さ 場合 基本的 方針 据え 自体 是非 改 問い直 必要 あ う
3.
析
3.1. 仮説
以 踏 え 本章 以 2 仮説 検証 簡単化 本 析 経 強 靭性 対象 限定
仮説1: 火力発電 割合 通常時 GDP 変動 抑 え 効果 あ 方 戦争や世界的 況 い 機 対 強靭性 必
影響 い
仮説2: 再生 能 原子力 割合 割合 高 通常時 GDP 変動 抑え 効果 あ 仮説 対 戦争や世界的 況 い 機 対 強靭性
少 い再生 能 方 高い
仮説1 関 2.2 言及 う 石油価格 高騰 う 直接的 影響 考慮 設計さ 機 対 強靭性 いう点 十 い いう あ 仮説2 い 石油価格 い 市場 直接及 影響 異
観点 評価
24 3.2.
析 対象 コ 3国 ュ
除 OECD 26 国 1971 2014 44 間 あ
石油価格 変動 英BP社 Statistical Review of World Energy 20174
Crude oil prices 2016 時点 米国 換算値 前 変動値 使用
各国 直面 石油価格 あ 仮定
各国 GDP 変動 び 源 発電電力量割合 世界銀行 World Bank
Open Data5
得 用い 表1参照 GDP 変動 2010 米国
実質値 2010 =100 う指数化 前 変動値 使用 発電 電力量割合 源 再生 能 水力 除 原子力 火力
石油 然 石炭 合計 3 使用 表2 各変数 基本統計量 示 戦争や世界的 況 い 機 あ 1974 第 次 ョ
1979 第 次 ョ 1990 湾岸戦争 2002 時多発
戦争開始 2008 ョ 5時点 用意
表1 26 国 実質GDP(2010 =100) 電源 発電電力量割合 % 1971 2014
1971 2014
国 GDP 発電電力量割合(%) GDP 発電電力量割合(%) 再生 水力 原子
力
火力 再生 水力 原子 力
火力
29.6 0.5 21.8 0.0 77.7 111.7 7.5 7.4 0.0 85.1
39.3 0.8 57.5 0.0 41.7 104.4 14.6 66.6 0.0 17.7
41.7 0.0 0.4 0.0 99.6 103.6 16.6 0.4 47.2 33.5
33.9 0.0 73.2 1.9 24.8 110.3 4.5 58.3 16.4 20.4
22.3 0.8 56.4 0.0 42.8 118.5 9.8 31.3 0.0 58.4
46.3 0.8 4.1 1.9 93.1 106.7 23.0 3.1 15.6 56.7
48.2 0.0 0.1 0.0 99.9 104.2 55.8 0.0 0.0 41.9
33.5 0.1 51.7 4.1 44.2 95.8 25.9 14.2 20.8 38.8
35.0 0.0 49.0 0.0 51.0 99.7 18.9 19.7 34.6 25.8
41.6 0.5 31.3 6.0 62.2 103.8 5.1 11.3 78.4 4.8
42.3 0.0 1.3 10.8 87.9 108.3 17.7 1.8 19.0 60.8
42.4 0.0 22.9 0.0 77.1 82.1 15.3 8.9 0.0 75.6
17.1 0.0 7.4 0.0 92.6 113.4 21.8 2.7 0.0 75.2
28.0 0.8 96.2 0.0 3.0 109.9 28.9 71.0 0.0 0.0
19.4 0.0 0.0 0.0 100.0 114.9 1.5 0.0 0.0 98.5
45.5 3.4 31.5 2.7 62.4 96.2 22.3 21.1 0.0 55.5
日本 35.3 0.0 22.0 2.1 75.9 103.8 6.1 7.9 0.0 85.6
韓国 5.9 0.0 12.5 0.0 87.5 112.8 1.1 0.5 28.7 69.5
セ 23.2 0.0 4.1 0.0 95.9 112.0 15.3 5.7 0.0 76.2
コ 26.8 0.0 46.3 0.0 53.7 112.2 4.6 12.9 3.2 79.2
39.6 0.0 0.0 0.9 99.1 101.8 11.2 0.1 4.0 83.0
30.8 0.0 99.6 0.0 0.4 106.9 1.7 96.0 0.0 2.0
34.1 1.8 78.1 0.0 20.0 94.0 30.8 30.0 0.0 38.8
44.0 0.2 78.2 0.1 21.5 106.3 14.3 41.5 42.3 1.1
コ 20.1 1.7 26.7 0.0 71.7 132.8 4.8 16.1 0.0 79.0
合衆国 33.0 0.0 15.5 2.4 82.1 108.1 6.9 6.1 19.2 67.5
4 https://www.bp.com/en/global/corporate/energy-economics/statistical-review-of- world-energy.html
25
表2 基本統計量
均 標準偏差 中央値
GDP 変動(2010 =100 指数値) 2.027 15.50 1.044
石油価格 変動(2016 米国 ) 1.707 1.935 1.761
再生 能 発電電力量割合(%) 3.370 5.946 1.249 原子力 発電電力量割合(%) 12.05 18.48 0 火力 発電電力量割合(%) 58.52 30.86 58.52
3.3. 結果 考察
析結果 表3 4 示 表3 通 石油価格 変動 GDP 変動 意 影響 あ いう結果 石油価格 変動 経 強靭性 脅 要 因 い 意味
火力 発電電力量割合 GDP 変動 意 影響 え 仮説1 想定 い 効果 確 火力 発電電力量割合 石油価格 変動 戦争や世 界的 況 い 機 起 交互作用項 入 再度 析
表4 通 い 交互作用項 意 う 火力発電 割合 高 い い 機 対 強靭性 影響 必 確 い いう結果
方 再生 能 発電電力量割合 高い GDP 変動 意 さ 効果 確 対 原子力 発電電力量割合 GDP 変動 意 影響 え 仮説2 想定 い 効果 確 表4 あ 通 再 生 能 原子力 発電電力量割合 石油価格 変動 機 起
交互作用項 い 意 再生 能 原子力 い 機 対 強靭性 影響 必 確 い いう 仮説2 異 結果 以 析結果 石油価格 高騰 通 引 起 さ 変動 対 定 相関 基本計画や長期 需給見通 期 待さ 効果 整合的 方 石油価格 説明 い変動 対 再生 能
除 意 相関 示さ あ 計画 考慮さ 機 影響 対 影響 及 考え 想定 異 相関 示 い 機 負 影響 適 捉え 点
改善 必要 あ
表3 GDP 変動 被説明変数 OLS推定
係数 標準誤差
片 2.038 0.149
***
石油価格 変動 0.069 0.005
***
再生 能 -0.038 0.009
***
原子力 -0.004 0.003
火力 -0.001 0.002
他 基準 -
1974 -3.711 0.395 ***
1979 -3.782 0.428 ***
1990 -0.490 0.351
2002 -0.090 0.348
2008 -2.795 0.368 ***
R2 0.186
修 R2 0.179
F値 28.76
***
26
表4 GDP 変動 被説明変数 OLS推定 交互作用項 追
係数 標準誤差 係数 標準誤差 係数 標準誤差
片 2.026 0.149 *** 2.038 0.149 *** 2.028 0.155 ***
石油価格 変動 0.065 0.006 *** 0.069 0.006 *** 0.073 0.010 ***
再生 能 -0.037 0.009 *** -0.038 0.009 *** -0.038 0.009 ***
原子力 -0.004 0.003 -0.004 0.003 -0.003 0.003
火力 -0.001 0.002 -0.001 0.002 -0.001 0.002
他 基準 - 基準 - 基準 -
1974 -3.842 0.473 *** -3.665 0.477 *** -3.180 0.898 ***
1979 -3.818 0.565 *** -3.823 0.543 *** -3.762 0.959 ***
1990 -0.203 0.446 -0.523 0.437 -1.085 0.733
2002 0.215 0.446 -0.079 0.432 -0.486 0.759
2008 -2.773 0.521 *** -2.770 0.450 *** -2.508 0.795 ***
交互作用 再生 ×石油価格 0.001 0.001
再生 ×1974 0.657 0.510
再生 ×1979 0.380 0.522
再生 ×1990 -0.141 0.150
再生 ×2002 -0.082 0.076
再生 ×2008 -0.005 0.052
交互作用 原子力×石油価格 0.000 0.000
原子力×1974 -0.023 0.101
原子力×1979 0.006 0.049
原子力×1990 0.002 0.016
原子力×2002 -0.001 0.017
原子力×2008 -0.002 0.019
交互作用 火力×石油価格 0.000 0.000
火力×1974 -0.008 0.013
火力×1979 0.000 0.014
火力×1990 0.010 0.011
火力×2002 0.007 0.011
火力×2008 -0.005 0.012
R2 0.190 0.186 0.188
修 R2 0.179 0.175 0.177
F値 17.62
***
17.17 *** 17.39 ***
***: p<0.01, **: p<0.05, *: p<0.1
4
結論
今後
課題
4.1. 結論
本章 経 強靭性 及 影響 い OECD 26 国
用い 検証 散 いう観点 定 効果 期待 基本計画 基本方針 あ わ 強靭性 いう観点 評 価 十 行わ い い 仮 いう 約 強靭性 改善 阻 害さ い あ 政策 基本方針 据え 自体 見直
検討 必要 あ う 端緒 本章 石油価格 変動 統 経 変動 相関 OLS推定 析
析結果 見 再生 能 GDP 変動 負 相関 示 化石燃料 や原子力 依存度 強靭性 増 いう結果 得 従来 政策 機
27 4.2. 今後 課題
前述 係数 負 意 い 機 表 変数 い 改善 求 今回 OECD 各国 幅広 影響 及 機 戦争 世 界的 況 筆者 断 選択 東日本大震災 う 地域 限定さ 機 析 対象 え 国 焦点 合わ 客観的 指標 基 機 選択
望 い 機 生 経 影響 及ぶ 期間 い 機 応 異 考え 個 析 行い特定 求
今回 相関 析 今回 約 厳 断念 因果関係 析 発展さ 時系列 析 入 検討
参考文献
Aiginger, K. (2009). Strengthening the resilience of an economy. Intereconomics, 44(5), 309-316. Christopher, M., & Peck, H. (2004). Building the resilient supply chain. The international journal of
logistics management, 15(2), 1-14.
宮山涼 & 藤井 . (2015). 再生 能 電源 . 地球温暖化国内
日本 地球温暖化抑 2050 ビ ョ 実現 . Available at 戦略研究所:
http://www.canon-igs.org/event/report/report_150723/pdf/20150723_komiyama.pdf.
藤井聡, 久米 & 林 . (2014). 経 構築 経 成長. RIETI Policy
Discussion Paper Series 14-P-006. Available at RIETI:
https://www.rieti.go.jp/jp/publications/summary/14050008.html.
29
(Presentation)
Innovation or Tradition? Analyzing the Twitter Networks of Japanese
Environmental Organizations
Leslie TKACH-KAWASAKI
Yutaka TSUJINAKA
Presentation
15th European Association of Japanese Studies Conference
Lisbon, Portual
41
(Presentation)
A Comparative Study of Environmental Policy Actor Networks in
Japan and Germany
Junku LEE
Presentation
XXXVII Sunbelt Conference of the International Network for Social Network Analysis (INSNA) Beijing, China
55
Post 2015 Paris Climate Conference Politics on the Internet
1Social media strategies of political institutions on the environment in Germany and Japan
Manuela HARTWIG
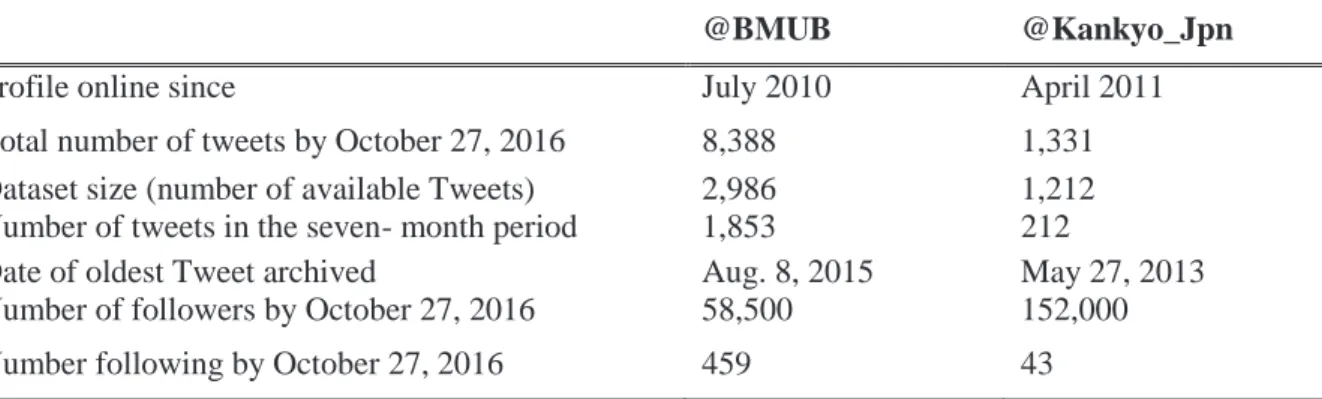
The outcomes of the climate negotiations of the 21st session of the Conference of the Parties (COP21) by the United Nations Framework Convention on Climate Change is the most important since the enactment of the Kyoto Protocol in 1997. With the development of new information technologies since the 1990s public awareness of environmental issues has increased significantly and not only civil society actors but also political institutions and governmental organizations started to use these new tools. The direct communication with citizens, journalists and other interest groups can provide political representatives with a powerful tool to shape public agenda. However, political institutions are traditionally slow in adapting to new technologies and social media services are dominated by individual (one-person) users. Politicians as well as institutions on the Internet must be careful how to facilitate communication online to ensure their political legitimacy. How do governmental organizations involved in climate change politics use social media? This study focuses on the analysis of the official Twitter profiles by the German (@BMUB) and Japanese (@Kankyo_Jpn) environmental ministries and contributes to the understanding of how governmental organizations facilitate new information technologies in the age of democratic transition. With Twitter data of a seven-month period from the beginning of COP21 on November 30 2015 until July 3, 2016, covering three important international events related to climate change politics in total, besides COP21, the pre-COP session and G7 summit (both in May 2016) the characteristics of social media use is being analyzed. Even though Twitter is more popular in Japan, it has not been played an important role in direct communication and information dissemination for political institutions compared to Germany. Moreover, while previous research conclude institutions would avoid interaction on the Internet, the findings suggest differently.
Introduction
Climate change is one of the most important issues nowadays, influencing political decision-making processes that effects various areas and is part of daily discussions. Since the meltdown at the Fukushima Dai’ichi nuclear power plant on March 11, 2011, triggered by a 9.0 earthquake-generated tsunami at the east-cost of Japan, the energy and environmental politics in Japan and Germany are under close public scrutiny. Scholars employ with the question how differences in political decision-making processes can be explained. Both countries have strong economic ties, as well as in diplomacy, technology and knowledge exchange. On the occasion of the G7 meeting in May 2016 in Toyama, Japan and Germany signed a joint statement on bilateral cooperation on the dissemination of low carbon technologies towards transformation to decarbonized societies. Both countries recognize their
1 This paper has been presented at the CeDEM Asia 2016 Conference of the Danube University Krems, Faculty of Business and Globalization, Department for E-Governance and Administration, held in Daegu, South Korea, December 7 – 9, 2016, and has been published in the conference proceedings. Permission for this reprint has been given by the conference