Black-Blood Magnetic Resonance Imaging Scans
Ayumu Eto, MD , Yoshimasa Kinoshita, MD , PhD , Yoshihisa Matsumoto, MD , PhD , Fumiaki Kiyomi, MD , PhD , Minoru Iko, MD , PhD , Kouhei Nii, MD , PhD ,
Masanori Tsutsumi, MD , PhD , Kimiya Sakamoto, MD , PhD , Hiroshi Aikawa, MD , PhD , and Kiyoshi Kazekawa, MD , PhD
Background: Black-blood magnetic resonance imaging (BB-MRI) is useful for the characterization and assessment of carotid artery plaques. The plaque-to-muscle signal intensity (SI) ratio (plaque/muscle ratio [PMR]) is used widely to evaluate plaques. However, the correlation between the PMR and the T1 relaxation time needs to be determined. We measured the T1 relaxation time of carotid plaques using T1 mapping and compared the results with the PMR on BB-MRI scans.Methods:Between April 2014 and July 2015, 20 patients with carotid artery stenosis were treated by carotid artery stenting. All patients underwent preoperative magnetic resonance plaque imaging. The ratio of the plaque SI to the sternocleidomastoid muscle was calculated on T1-weighted BB-MRI scans. T1 mapping was performed in the region where the vessel was narrowest using the inversion recovery technique. The T1 relaxation time was recorded to determine whether there was a correlation with the PMR.Results:The plaque T1 value was 577.3±143.2 milliseconds; the PMR value obtained on BB-MRI scans was 1.23±.27. There was a statistically signifi- cant decrease in the T1 value as the PMR increased (P<.0001).Conclusions:As the T1 relaxation time was well correlated with the PMR on BB-MRI scans, the evaluation of vulnerable plaques using the PMR was reliable and convenient. Key Words:
Black-blood magnetic resonance imaging (BB-MRI)—plaque/muscle ratio (PMR)—T1 mapping—T1 relaxation time—carotid plaque.
© 2016 National Stroke Association. Published by Elsevier Inc. All rights reserved.
Introduction
Symptomatic, even low-grade stenosis with a high-signal plaque on carotid magnetic resonance imaging (MRI) scans tends to be associated with a high risk for recurrent ce- rebral ischemic events,
1and a nonsignificant reduction in this risk by surgery does not render the patient risk-free.
2Not only the carotid artery stenosis but also the plaque composition must be understood. Takemoto et al
3compared findings on black-blood magnetic resonance imaging (BB-MRI) scans and on pathological specimens from carotid endarterectomies. Takemoto et al and others
4,5considered plaques with a high-intensity signal on T1-weighted images (T1WIs) to be complicated atheromas with hemorrhage and a lipid core and therefore vulnerable. The plaque-to- muscle signal intensity ratio (plaque/muscle ratio [PMR]) is used to quantify high-intensity signals on T1WI sug- gestive of vulnerable plaques. Different imaging protocols and techniques have been applied for magnetic reso- nance plaque imaging, and there is no consensus on whether the sternocleidomastoid muscle or the submaxillary gland is appropriate for comparison with the plaques. While the PMR is convenient, its reliability remains to be established.
From the Department of Neurosurgery, Fukuoka University Chikushi Hospital, Chikushino, Japan.
Received June 13, 2016; accepted June 26, 2016.
Address correspondence to Ayumu Eto, MD, PhD, Neurosurgery, Fukuoka University Chikushi Hospital, 1-1-1 Zokumyoin, Chikushino, Japan. E-mail:[email protected].
1052-3057/$ - see front matter
© 2016 National Stroke Association. Published by Elsevier Inc. All rights reserved.
http://dx.doi.org/10.1016/j.jstrokecerebrovasdis.2016.06.041
2580 Journal of Stroke and Cerebrovascular Diseases, Vol. 25, No. 11 (November), 2016: pp 2580–2584
T1 mapping for the quantitative evaluation of MRI scans directly quantifies the T1 value of each voxel in an object and facilitates the generation of a parametric map rep- resenting the T1 relaxation times. While T1 mapping of the heart,
6,7osteoarthritic cartilage,
8and central nervous system
9has been reported, only ex vivo studies that used specimens from carotid endarterectomy
10,11are available with respect to carotid plaques, and the correlation between the PMR and the T1 relaxation time of carotid plaques remains to be determined. We measured the T1 values of carotid plaques using T1 mapping and compared these values with the PMRs obtained by BB-MRI in patients who underwent MRI studies prior to carotid artery stenting.
Patients and Methods
Our study protocol was approved by the ethics com- mittee of Fukuoka University Chikushi Hospital. Included were 20 patients (15 men, 5 women) who underwent carotid artery stenting for carotid artery stenosis at our hospital between April 2014 and July 2015. The percent- age of cervical artery stenosis was calculated on angiographs using the criteria of the North American Symptomatic Carotid Endarterectomy Trial.
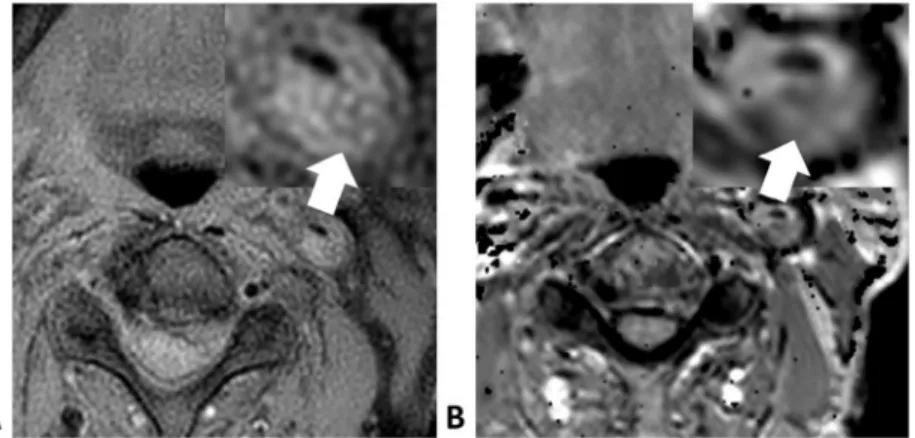
12For MRI studies, we used a Philips Ingenia 1.5-T scanner (Philips Healthcare, The Netherlands). After magnetic res- onance angiography, we acquired BB-MRI scans in the region where the vessel was narrowest. The imaging pro- tocol was spin echo technique with 5.1-millisecond echo time, 600-millisecond repetition time, and 5-mm slice thick- ness. To calculate the PMR, we used horizontal cross sections of plaque regions on T1WI scans and a region of interest in the sternocleidomastoid muscle selected on a SYNAPSE 3.2.1 (FUJIFILM Medical Systems USA, USA) (Fig 1, A). To reduce errors, measurements were per- formed 3 times for each region and the mean values were adopted.
T1 mapping was performed in the region where the vessel was narrowest. We applied the inversion recovery technique, an echo time of 15 milliseconds, a repetition time of 2000 mil- liseconds, and inversion times of 100, 500, 1200, and 1800 milliseconds. The T1 values were calculated based on data obtained with this mapping procedure using data analysis software Baum 2D 1.17a (Osaka University, Japan)
(Fig 1, B) and were used to determine whether there were any correlations with the PMRs.
Statistical Analysis
Student’s
t-test was used to determine significant dif-ferences in the relationship between the T1 value and the PMR of plaques with or without high signal intensity on time-of-flight magnetic resonance angiography (TOF- MRA) scans
13for patients with or without symptoms. To calculate the correlation between the PMR and the T1 values, we determined the Pearson correlation coefficient. Each finding was tested by 2-tailed analysis. Differences of
P<.05 were considered statistically significant.
Results
Among our 20 patients aged 75.3
±7.0 years (mean
±standard deviation), 5 were symptomatic. The average stenosis severity was 81.8
±10.3%; 4 patients harbored calcified plaques, and in 9 patients there was a high-intensity signal in the plaque on TOF-MRA images suggestive of intraplaque hemorrhage (Table 1).
Figure 1. Left carotid stenosis in an 81-year-old man. On the T1-weighted image (A, arrow), the plaque is isointense with the adjacent muscle. On the T1 mapping image of the plaque, the major com- ponents of the atheroma are uniform (B, arrow).
Table 1. Characteristics of patients treated by carotid artery stenting
Characteristics Mean
±SD
Number of lesions 20
Age (year) 75.3
±7.0
Gender, n (male) 15
T1 PMR 1.2
±.3
% Stenosis (NASCET) 81.8
±10.3
History of DM, n 2
History of HT, n 11
History of HL, n 10
Symptomatic lesion, n 5
Calcification, n 4
Intraplaque hemorrhage, n 9
Abbreviations: DM, diabetes mellitus; HL, hyperlipidemia; HT, hypertension; NASCET, North American Symptomatic Carotid End- arterectomy Trial; PMR, plaque/muscle ratio; SD, standard deviation.
Data are the mean±SD.
BB-MRI required 1 minute and 45 seconds, and T1 mapping 22 minutes and 32 seconds because 5 minutes and 38 seconds were needed for each inversion time.
The PMR on BB-MRI scans was 1.23
±.27. The plaque and sternocleidomastoid muscle T1 values were 577.3
±143.2 milliseconds and 752.5
±28.9 milliseconds. The
decrease in the T1 value with increasing PMR was highly significant (r =
−.84,P<.0001) (Fig 2).
There was no statistically significant difference in the PMR of plaques with or without symptoms and in the T1 value of plaques with or without symptoms (Fig 3,
A,B).Figure 2. Scatter plots and 95% prediction ellipse. The distribution of plaque values was based on the PMR on black-blood magnetic resonance imaging scans and the T1 value. The decrease in the T1 value with an increasing PMR was highly significant (Pearson’s correlation coefficient:r=−.84,P<.0001).
Abbreviation: PMR, plaque/muscle ratio.
Figure 3. Comparison of the PMR and the T1 value of plaques with (n = 5) or without (n = 15) symptoms (A and B) and with (n = 9) or without (n = 11) intraplaque hemorrhage (C and D). *P<.001, Student’sttest. (A) Asymptomatic and (B) symptomatic patients. Abbreviations: N, plaque- negative in the presence of high signal intensity on TOF-MRA images; P, plaque-positive in the presence of plaques with high signal intensity on TOF-MRA images; PMR, plaque/muscle ratio; TOF-MRA, time-of-flight magnetic resonance angiography.
The PMR of plaques with a high-intensity signal on TOF-MRA was higher than that of plaques without a high-intensity signal on TOF-MRA images (P = .0002 and
P<.05) (Fig 3, C), as was the T1 value (P = .0002 and
P<.05) (Fig 3, D).
In 1 patient, the major atheroma components could be identified by T1 mapping (Fig 4), whereas in the other 19 patients, the major atheroma components could not be discerned on T1-mapped images or BB-MRI scans.
Discussion
While ultrasound studies are commonly used for the evaluation of carotid plaques, their measurement repro- ducibility is low, they require technical skills, heavy calcification can hamper plaque visualization, and as- sessment of the plaque morphology is difficult in patients with severe carotid artery stenosis.
14-17BB-MRI can over- come these disadvantages and is becoming an established diagnostic procedure for carotid plaques.
18However, plaque evaluation on BB-MRI scans is only qualitative and based on the signal strength ratio with tissues around the plaque. Therefore, the signal strength must be stable for comparison with the tissues. In patients the PMR with the sternocleidomastoid muscle is widely used;
however, the correlation of PMR with T1 values has not been investigated. Muscles differ among individuals based on the subject’s age, sex, and physical constitu- tion (quantity of fat in muscle tissue). We considered muscles ranging in their T1 value from 752.5
±28.9 mil- liseconds as adequate scanning targets and found that the sternocleidomastoid muscle is a suitable target for PMR calculations. The T1 value of carotid plaques was 577.3
±143.2 milliseconds, and there was a negative cor- relation between the PMR and the T1 value of plaques.
On 1.5-T magnetic resonance scanners, the T1 value of lipids is approximately 260 milliseconds, and we think that plaques with a high PMR and a lower T1 value are lipid-rich. Among our patients, those with high-intensity signals on TOF-MRA images tended to have high PMRs and lower T1 values, suggesting that the detection rate
for intraplaque hemorrhage is similar on T1-mapped images and BB-MRI scans.
The characteristics of carotid artery plaques are complex, they can harbor various components such as fibrous tissue, lipid/necrosis, hemorrhage, and a fibrous cap.
19Some studies
20quantified carotid plaques on contrast-enhanced computed tomography scans. However, compared to MRI, contrast-enhanced computed tomography does not show intraplaque hemorrhage. Also, there is the risk of poten- tially harmful radiation exposure and allergy to contrast media. Although MRI was reported to discriminate among the major atheroma components including fibrous caps, lipid cores, and calcium deposits, it was not sensitive for thrombus formations.
21T1 mapping was useful for the examination of the heart,
6,7osteoarthritic cartilage,
8and the central nervous system.
9Myocardial T1 studies on cardiac MRI scans may improve the diagnostic accuracy and quantification of myocardial fibrosis,
7and T1 mapping may be useful for the quantitative assessment of diffuse myocardial fibrosis.
6A significant correlation between T1 changes and the severity of hepatic encephalopathy has been observed in the globus pallidus, caudate nucleus, and the posterior limb of the internal capsule.
9In one of our patients, a mosaic of plaque components was de- tected on T1-mapped images but not on BB MRI scans, suggesting that the ability to discriminate among the major atheroma components may be superior on T1-mapped images than on BB MRI scans. Detailed studies on the characteristics and distribution of carotid artery plaques on T1-mapped images are under way in our laboratory.
Our study has some limitations. First, carotid plaques are small scanning targets compared with knee carti- lage or the myocardium. Therefore, to reduce the risk of breath movements affecting our plaque evaluation, we selected patients with high-grade stenosis and large plaque volumes to measure the T1 value of carotid plaques. Ad- ditional studies are needed to identity the limits of T1 mapping of small carotid artery plaques. As T1 mapping involves longer scan times (22 minutes and 32 seconds) than BB-MRI T1WI scans (1 minute and 45 seconds), it is not appropriate in all patients with carotid plaques.
Figure 4. Left carotid stenosis in a 78-year-old man. The plaque is slightly hyperintense with respect to adjacent muscle on T1-weighted image scans (A, arrow). On the T1-mapped image, the plaque harbors areas of different intensities. The discernment of major atheroma components is easier on the T1-mapped image than on the black-blood magnetic resonance imaging scan (B, arrow).
expanding our quantitative evaluation of plaques using T1 mapping to assess its usefulness for the estimation of the stroke risk.
Conclusions
T1 mapping yields the absolute T1 value of carotid artery plaques and plaque distribution maps. The T1 relax- ation time of carotid plaques correlated well with the PMR obtained by BB-MRI. Our findings demonstrate that the evaluation of vulnerable plaques by their PMR is reli- able and convenient and that the sternocleidomastoid muscle is suitable for the assessment of the PMR.
Acknowledgment: The authors thank Mr. Mio for his tech- nical assistance.
References
1. Kurosaki Y, Yoshida K, Fukuda H, et al. Therapeutic outcome for symptomatic low-grade carotid artery stenosis with vulnerable plaque. Surg Cereb Stroke 2015;43:98-102.
2. Bruce A, Wasserman RJ, Wityk HH, et al. Low-grade carotid stenosis. Looking beyond the lumen with MRI.
Stroke 2005;36:2504-2513.
3. Takemoto K, Ueba T, Takano K, et al. Quantitative evaluation using the plaque/muscle ratio index panels predicts plaque type and risk of embolism in patients undergoing carotid artery stenting. Clin Neurol Neurosurg 2013;115:1298-1303.
4. Yoshida K, Narumi O, Chin M, et al. Characterization of carotid atherosclerosis and detection of soft plaque with use of black-blood MR imaging. AJNR Am J Neuroradiol 2008;29:868-874.
5. Yamada K, Yoshimura S, Kawasaki M, et al. Embolic complications after carotid artery stenting or carotid endarterectomy are associated with tissue characteristics of carotid plaques evaluated by magnetic resonance imaging. Atherosclerosis 2011;215:399-404.
6. Jellis CL, Kwon DH. Myocardial T1 mapping: modalities and clinical applications. Cardiovasc Diagn Ther 2014;
4:126-137.
7. Souto Nacif M, Evrim B, Turkbey EB, et al. Myocardial T1 mapping with MRI: comparison of look-locker and MOLLI sequences. J Magn Reson Imaging 2011;34:1367- 1373.
8. Li X, Cheng J, Lin K, et al. Quantitative MRI using T1 p and T2 in human osteoarthritic cartilage specimens:
9. Shah NJ, Neeb H, Zaitsev M, et al. Quantitative T1 mapping of hepatic encephalopathy using magnetic resonance imaging. Hepatology 2003;38:1219-1226.
10. Morrisett J, Vick W, Sharma R, et al. Discrimination of components in atherosclerotic plaques from human carotid endarterectomy specimens by magnetic resonance imaging ex vivo. Magn Reson Imaging 2003;21:465-474.
11. Degnan AJ, Young VE, Tang TY, et al.Ex vivostudy of carotid endarterectomy specimens: quantitative relaxation times within atherosclerotic plaque tissues. Magn Reson Imaging 2012;30:1017-1021.
12. Njemanze PC, Beck OJ, Gomez CR, et al. North American Symptomatic Carotid Endarterectomy Trial. Methods, patient characteristics, and progress. Stroke 1991;22:711- 720.
13. Yoshimura S, Yamada K, Kawasaki M, et al. High-intensity signal on time-of-flight magnetic resonance angiography indicates carotid plaques at high risk for cerebral embolism during stenting. Stroke 2011;42:3132-3137.
14. Hartmann A, Mohr JP, Thompson JL, et al. Interrater reliability of plaque morphology classification in patients with severe carotid artery stenosis. Acta Neurol Scand 1999;99:61-64.
15. Waki H, Masuyama T, Mori H, et al. Ultrasonic tissue characterization of the atherosclerotic carotid artery:
histological correlates or carotid integrated backscatter.
Circulation 2003;67:1013-1016.
16. Sztajzel R, Momjian S, Momjian-Mayor I, et al. Stratified gray scale median analysis and color mapping of the carotid plaque: correlation with endarterectomy. Specimen histology of 28 patients. Stroke 2005;36:741-745.
17. Kagawa R, Moritake K, Shima T, et al. Validity of B-mode ultrasonographic findings in patients undergoing carotid endarterectomy in comparison with angiographic and clinicopathologic features. Stroke 1996;27:700-705.
18. Arai D, Yamaguchi S, Murakami M, et al. Characteristics of carotid plaque findings on ultrasonography and black blood magnetic resonance imaging in comparison with pathological findings. Acta Neurochir Suppl 2011;112:15-19.
19. Narumi S, Sasaki M, Ohba H, et al. Predicting carotid plaque characteristics using quantitative color-coded T1-weighted MR plaque imaging: correlation with carotid endarterectomy specimens. AJNR Am J Neuroradiol 2014;35:766-771.
20. Inukai C, Inukai T, Matsuo N, et al. Evaluation of carotid artery plaques by black blood magnetic resonance imaging and contrast enhanced computed tomography: correlation of the two methods. Jpn J Stroke 2010;32:229-235.
21. Shinnar M, Fallon JT, Wehrli S, et al. The diagnostic accuracy of ex vivo MRI for human atherosclerotic plaque characterization. Arterioscler Thromb Vasc Biol 1999;19:2756-2761.