The Impact of Fiscal Decentralization on
Regional Economic Development in Indonesia
For the Periods 2005-2008
BY
MULYONO
(ID Number 51210008)
March 2012
Paper presented to the Higher Degree Committee of
Ritsumeikan Asia Pasific University in partial fulfillment of
the requirements for the Degree of Master of Science in
International Cooperation Policy
ABSTRACT
The debate that surfaced among the economic practitioners relates to the positive contribution of fiscal decentralization in regional economic development that has been discussed extensively in the last decade. One of the reasons is that fiscal decentralization is believed as an effective tool to increase the efficiency of public expenditures. This study examines the impact of fiscal decentralization on regional economic indicators such as economic growth, unemployment, poverty and Human Development Index. The relationship between intergovernmental fiscal transfer policy and regional economic development in Indonesia is to be examined over periods 2005-2008. This paper is presented in a "quantitative descriptive" approach by using Data Display Cross-case Analysis. Quantitative analysis is using the statistic tools such as trend analysis that compare statistic trends from 33 provinces and summary descriptive statistic. The research found that, from the years 2005-2008 fiscal decentralization in Indonesia, is still difficult to conclude whether there is a direct impact of fiscal decentralization on regional economic indicators. One of the reasons is that, during the period, economic recovery is likely due to the national macroeconomic stability improvement. Along with the bigger on fiscal decentralization fund, there is also improvement on regional economic indicators. The reason is the increase on sub national government funding resources. The research also provides that on average, the national economic indicators always increasing, but not in all provinces. In some provinces, the regional economic indicators are worse. One of the possible causes of low economic growth in sub national government is because of intergovernmental fiscal transfer funds cannot be absorbed in their spending budget. This condition reflects inadequate budget management in sub national government both in the planning and budgeting processes. The research also recommends that in its implementation, the principles of efficiency, transparency and accountability in the management of Intergovernmental Fiscal Transfer should be developed, and then followed by policy improvement. Thus, an increase in the allocation of transfers from year to year will improve the equitable distribution of financial capability among central and sub national governments, as well as supporting regional development in order to alleviate poverty (pro-poor), to extend employment opportunities (pro-job creation), and to increase economic growth (pro-growth). Furthermore, the sub national governments should be strong in implementing the application of the principles of good governance in order to stipulate budgets on time, and on target that will have a significant impact on the regional economic development and public welfare.
Keywords: Fiscal decentralization, intergovernmental fiscal transfer, regional economic development, regional economic indicator, Indonesia.
ACKNOWLEDGEMENTS
It has been two years since I started my paper entitled “The Impact of Fiscal Decentralization on Regional Economic Development in Indonesia for the Periods 2005-2008”. During this period, many people have contributed to the success of this work.
The following individuals, institutions and organizations are acknowledged for their various invaluable support towards both the completion of my studies and construction of this paper: The officials of the Ministry of Finance of the Republic of Indonesia, for the trust invested in recommending me for this important course; Finance Education and Training Board, which has arranged and supervised me to obtain an invaluable experience of study abroad; the Director General of Fiscal Balance, Mr. Marwanto Harjowiryono, and all my colleagues in my office who have supported me during my study in the graduate program and for allowing me to collect data; scholars, publishers and organizations who gave me permission for copyright materials to be quoted or used in the construction of this paper; my wife, Mariana Wulansari, my parents, brothers and sisters, for their patience and unwavering moral, social, psychological and spiritual support; It is to all of these people to whom I dedicate this paper.
I wish to express my sincere gratitude to my thesis supervisor, Professor Igusa Kunio, for the valuable advice he has provided me throughout the study period, in particular, the precious discussions that we held during the writing period of this paper. These discussions helped me to acquire in depth knowledge of the subject matter and the research methodology. His relentless effort contributed to the success of this project. A very genuine gratitude is extended to Professor Igusa Kunio and Professor Yamagami Susumu for their undying support and excellent guidance; I am deeply indebted for their guidance and assistance during the course of this research. Without their support, I would not have been able to accomplish this paper. I will always be sincerely grateful for all their kindness and understanding. I would also like to convey my deep gratitude to my close friends, classmates and colleagues for their encouragement during the construction of this paper.
I wish to appreciate critics, suggestions and comments in order to get more qualified research for the next study. Thank you very much.
CONTENTS Title ……… i Abstract……….. ii Acknowledgements………..…………. iii Contents…………..………….………..……….. iv List of Tables ……..………....………...………….. vi
List of Figures ………...……….….………..………..……….. vii
CHAPTER 1 INTRODUCTION ……….……….. 1
1.1 The Research Problem………. 1
1.2 Research Questions……….. 3
1.3 Research Objectives………. 3
1.4 Scope of the Research……….. 4
1.5 Significance of the Research……… 5
1.6 Structure of the Paper……….. 5
CHAPTER 2 LITERATURE REVIEW……….. 8
2.1 Theories of Fiscal Decentralization………. 8
2.2 Fiscal Decentralization and Economic Growth……… 10
2.3 Intergovernmental Transfer Fund………. 15
2.4 Theories of Regional Economic Development………. 16
2.4.1 Regional Economic Growth……… 16
2.4.2 Percentage of Population below the Poverty Line……….. 18
2.4.3 Percentage of Unemployment………. 19
2.4.4 Human Development Index (HDI)………. 20
CHAPTER 3 METHODOLOGY AND RESEARCH DESIGN………. 21
3.1 Research Paradigm………. 21
3.2 Research Approach……….. 22
3.3 Research Focus……… 22
3.4 Data Collection……… 23
3.5 Research Design……….. 25
CHAPTER 4 FISCAL DECENTRALIZATION IN INDONESIA………. 26
4.1 Fiscal Decentralization in Indonesia………. 26
4.2 Implementation of Intergovernmental Fiscal Transfer in Indonesia……. 33
4.2.1 Implementation of Revenue Sharing (DBH) ……… 36
4.2.2 Implementation of General Purpose Fund (DAU) ……… 38
4.2.3 Implementation of Specific Purpose Fund (DAK) ………... 41
4.2.4 Implementation of Special Autonomy Fund and Adjustment Fund ………... 43
CHAPTER 5 INTERNATIONAL COMPARATIVE POLICY ON FISCAL DECENTRALIZATION………. 44
5.1 Fiscal Decentralization in Japan………. 46
5.3 Fiscal Decentralization in China ……… 51
5.4 Fiscal Decentralization in Vietnam……… 52
CHAPTER 6 ANALYSIS OF THE IMPACT OF FISCAL DECENTRALIZATION ON REGIONAL ECONOMIC DEVELOPMENT IN INDONESIA PERIOD 2005-2008………. 54
6.1 Analysis of Impact on Intergovernmental Transfer to Regional Economic Development………. 54
6.2 Analysis of Impact on General Purpose Fund (DAU) to Regional Economic Development………. 78
6.3 Analysis of Impact on Revenue Sharing (DBH) to Regional Economic Development………. 87
6.4 Analysis of Impact on Specific Purpose Fund (DAK) to Regional Economic Development ……….. 96
CHAPTER 7 CONCLUSION AND RECOMMENDATIONS……… 107
7.1 Conclusion………... 107
7.2 Recommendations………. 110
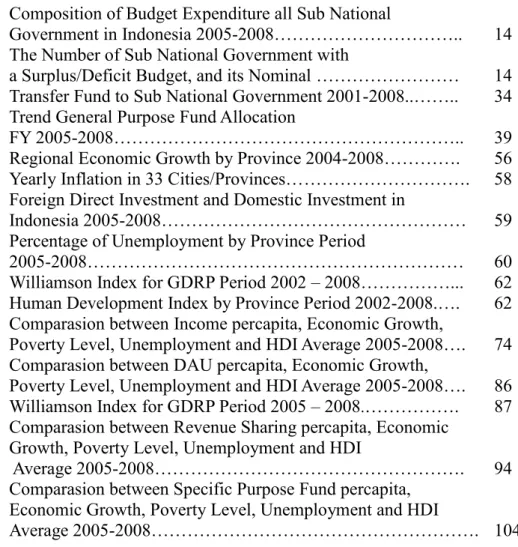
LIST OF TABLES
Table 2-1 Composition of Budget Expenditure all Sub National
Government in Indonesia 2005-2008……….. 14
Table 2-2. The Number of Sub National Government with
a Surplus/Deficit Budget, and its Nominal ……… 14
Table 4-1. Transfer Fund to Sub National Government 2001-2008..…….. 34 Table 4-2. Trend General Purpose Fund Allocation
FY 2005-2008……….. 39
Table 6-1. Regional Economic Growth by Province 2004-2008…………. 56
Table 6-2. Yearly Inflation in 33 Cities/Provinces………. 58
Table 6-3. Foreign Direct Investment and Domestic Investment in
Indonesia 2005-2008……… 59
Table 6-4. Percentage of Unemployment by Province Period
2005-2008……… 60
Table 6-5. Williamson Index for GDRP Period 2002 – 2008………... 62
Table 6-6. Human Development Index by Province Period 2002-2008.…. 62 Table 6-7. Comparasion between Income percapita, Economic Growth,
Poverty Level, Unemployment and HDI Average 2005-2008…. 74 Table 6-8. Comparasion between DAU percapita, Economic Growth,
Poverty Level, Unemployment and HDI Average 2005-2008…. 86 Table6-9. Williamson Index for GDRP Period 2005 – 2008.………. 87 Table 6-10. Comparasion between Revenue Sharing percapita, Economic
Growth, Poverty Level, Unemployment and HDI
Average 2005-2008………. 94
Table 6-11. Comparasion between Specific Purpose Fund percapita, Economic Growth, Poverty Level, Unemployment and HDI
LIST OF FIGURES
Figure 3-1. Research Design………. 25
Figure 4-1. Scope of Transfer to Region………... 27
Figure 4-2. Proportion of Government Expenditure Budget FY 2008……. 28 Figure 4-3. Proportion of Intergovernmental Fiscal Transfer FY 2008 .….. 29 Figure 4-4. Proportion of Central Government Expenditure
in Sub National Government FY 2008………. 29
Figure 4-5. Transfer Fund to Sub National Government 2001-2008………. 33 Figure 4-6. Trend Balancing Fund DAU, DBH, and DAK FY 2001-2008…. 35
Figure 4-7. Revenue Sharing Fund (DBH) FY 2008……….. 37
Figure 4-8. General Purpose Fund (DAU) FY 2008……….. 38
Figure 4-9. Specific Purpose Fund (DAK) FY 2008……….. 41
Figure 4-10. Special Autonomy and Adjustment Fund FY 2001-2008……….. 42 Figure 4-11. Special Autonomy and Adjustment Fund FY 2008……….. 43
Figure 5-1. GDP and Public Financing in Japan ………. 48
Figure 6-1. Average Regional Economic Growth Period 2005-2008………. 57 Figure 6-2. Percentage of Unemployment by Province Average 2005-2008... 61 Figure 6-3. Map of Indonesia HDI by Province Average 2005-2008…..…… 63 Figure 6-4. Percentage of Population below Poverty Line
Average 2005-2008………. 64
Figure 6-5. Income per capita and Intergovernmental Fiscal Transfer
percapita Average 2005-2008 Compare ………... 66
Figure 6-6. Correlations between Income per capita and Intergovernmental Fiscal Transfer per capita Average 2005-2008 Compare………. 67 Figure 6-7. Intergovernmental Fiscal Transfer per capita and
Level of Poverty Average 2005-2008 Compare ……….. 68
Figure 6-8. Intergovernmental Fiscal Transfer per capita and
Economic Growth Average 2005-2008 Compare….………. 70 Figure 6-9. Intergovernmental Fiscal Transfer per capita and
Percentage of Unemployment Average 2005-2008 Compare….. 72 Figure 6-10. Intergovernmental Fiscal Transfer per capita and Human
Development Index Average 2005-2008 Compare………... 73 Figure 6-11. Saving on APBD and Economic Growth
for Year 2007………. 76 Figure 6-12. Correlations between Saving on APBD and Economic Growth
for Year 2007………. 77
Figure 6-13. General Purpose Grant (DAU) per capita and Economic Growth
Average 2005-2008 Compare……….. 83
Figure 6-14. General Purpose Grant (DAU) per capita and
Percentage of Unemployment Average 2005-2008 Compare…… 84 Figure 6-15. General Purpose Grant (DAU) per capita and Poverty Level
Average 2005-2008 Compare………. 85
Figure 6-16. Revenue Sharing per capita and Economic Growth
Average 2005-2008 Compare ……….. 91
Figure 6-17. Revenue Sharing per capita and Percentage of Unemployment
Figure 6-18. Revenue Sharing per capita and Poverty Level Average
2005-2008 Compare………. 93
Figure 6-19. Specific Purpose Fund per capita and Economic Growth
Average 2005-2008 Compare ……….. 101
Figure 6-20. Specific Purpose Fund per capita and Percentage of
Unemployment Average 2005-2008 Compare ……….. 102
Figure 6-21. Specific Purpose Fund per capita and Poverty Level
CHAPTER I INTRODUCTION
1.1 The Research Problem
The intense discussion on the fiscal decentralization has been continued for long time among the economist and administrations of Indonesia. The main issue of their interest is the impact of fiscal decentralization on public welfare indicators such as economic growth, unemployment, poverty and Human Development Index. One of the reasons is that fiscal decentralization is believed as an effective tool for local autonomy of economic management and the efficiency of public expenditures.
Since 2001, Indonesia allocated almost a third of national revenues to sub national governments in implementing fiscal decentralization policy that is very crucial in Indonesia. Intergovernmental Fiscal Transfer is allocated from National Budget (APBN) to finance sub national governments need. The objectives of Intergovernmental Fiscal Policy are to reduce fiscal gap between central and sub national government (vertical fiscal imbalance) and among sub national governments (horizontal fiscal imbalance). Intergovernmental fiscal transfer, consist of Revenue Sharing (DBH) from taxes and natural resources, General Purpose Fund (DAU), Specific Purpose Fund (DAK), and Special Autonomy Fund and Adjustment Fund. The total amount of the Intergovernmental Fiscal Transfer is always increasing from year to year in implementation of fiscal decentralization.
2001 2002 2003 2004 2005 2006 2007 2008
I. Balancing Fund 81,054.4 94,656.6 111,070.4 122,867.6 222,130.6 222,130.6 243,967.2 278,714.7 a. Revenue Sharing 20,007.7 24,884.1 31,369.5 36,700.3 49,692.3 64,900.3 62,942.0 78,420.2 b. General Purpose Fund 60,345.8 69,159.4 76,977.9 82,130.9 88,765.4 145,664.2 164,787.4 179,507.1 c. Specific Purpuse Fund 700.9 613.1 2,723.0 4,036.4 4,763.6 11,566.1 16,237.8 20,787.3
II. Special Autonomi Fund and Adjustment Fund 0.0 3,547.5 9,243.9 6,855.3 7,242.6 4,049.4 9,296.0 13,718.8 a. Special Autonomi Fund 0.0 1,175.5 1,539.6 1,642.6 1,775.3 3,488.3 4,045.7 7,510.3
b. Adjustment Fund 0.0 2,372.5 7,704.3 5,212.7 5,467.3 561.1 5,250.3 6,208.5
TOTAL 81,054.4 98,204.1 120,314.3 129,722.9 229,373.2 226,180.0 253,263.2 292,433.5 Source : Ministry of Finance RI
REALIZATION OF NATIONAL BUDGET Transfer Fund To Sub National Government 2001-2008
(Billion Rupiah)
In addition, the relation between fiscal decentralization and regional economic development, seem to be an important topic especially when author try to analysts it through fiscal decentralization policy in Indonesian. Indonesia consisted of 33 provinces that have diverse in cultures and socials. Those characteristics contribute to the diversity of economic condition in Indonesia. The condition was reflected by economic indicators (such as economic growth, unemployment, poverty and Human Development Index), which is very crucial topic to be research and especially to find out the impact of fiscal decentralization to regional economic development in Indonesia.
Finally, along with the increasing of Intergovernmental Fiscal Transfer from Central Government to Sub National Government, it is a need to be studied further whether such transfers have a positive impact on the regional economic development and improving public welfare. Author want to research, by evaluating the eight years of the fiscal decentralization in Indonesia, how effective of fiscal decentralization regulation to increase regional economic development and social welfare in Indonesia. Of course, the government transfer fund may not be able to resolve the all problems of disparities of regional economic position and
equalization of economics. This research, does not attempt to measure how far the effect of Intergovernmental transfer on the regional economy and the public welfare, but try to see the picture of the pattern of inter-regional tendencies on several variables: Intergovernmental Transfer Fund, economic growth, unemployment and poverty levels.
1.2 Research Questions
Based on fact and condition that have been mentioned above, the main question is how to evaluate the impact of fiscal decentralization to regional economic development? There is some another research question that could help to clarify the main question:
1) How does the implementation of Intergovernmental Fiscal Transfer to sub National Government during the fiscal decentralization era? What are problems in the implementation of fiscal decentralization policy in Indonesia?
2) Does the sub National Government run on the right track in implementing fiscal decentralization in Indonesia?
3) What is the relationship between intergovernmental Fiscal Transfer and regional economic growth, regional Percentage of Population below the Poverty Line, regional percentage of unemployment, and Regional Human Development Index?
1.3 Research Objectives
The main purposes of this paper are (i) to convey an understanding about the importance of fiscal decentralization policy in Indonesia in order to create
regional economic development; (ii) to know the impact of fiscal decentralization policy to the regional economy in Indonesia, in regard to the economic development objectives; (iii) to know the impact of Intergovernmental Fiscal Policy to regional economic development in Indonesia; (iv) to know whether sub National Government is run on the right track in implementing fiscal decentralization, and (v) to propose any recommendations on fiscal decentralization policies that might be appropriate in Indonesia.
1.4 Scope of the Research
On this research, author makes identification on how the implementation is performed, and problems on the implementation of intergovernmental Fiscal Transfer policy. Furthermore, author makes an analysis on the impact of intergovernmental fiscal transfer to regional economic growth by using several variables such as regional economic growth, percentage of unemployment and percentage of poverty in every province. Author makes analysis on this topic by using primary data and secondary data. Primary data of sub national government from 33 provinces in Indonesia is obtained from the summary of sub national Government Budget (APBD) that is collected by Directorate General of Fiscal balance, Ministry of Finance Republic of Indonesia.
Secondary data are collected from Directorate General of Fiscal Balance that provides all regional financial data that cover all regions in Indonesia and Indonesian Statistic Board (BPS) that provides data indicator of regional economic development, such as regional economic growth, percentage of unemployment and percentage of poverty in every province. Secondary data are quantitative data that
important to answer the research question about how the impact of intergovernmental fiscal transfer to regional economic development.
1.5 Significance of the Research
This research will give the readers: First, an understanding of effectiveness in implementation of fiscal decentralization policy that can support economic development and regional economic development in Indonesia. Second, an understanding that a better fiscal decentralization policy will have multiplier effects on regional economic development in Indonesia.
In addition, this research will give Directorate General of Fiscal Balance, Ministry of Finance RI, a comprehensive evaluation about fiscal decentralization policy and its effectiveness related to regional economic development in Indonesian. Finally, any recommendation from this research hopefully will help Directorate General of Fiscal Balance, Ministry of Finance RI, to decide the best way to reach its goals.
1.6 Structure of the Paper
Chapter 1 Introduction, provide a brief explanation to the background of the study and its overall content. It includes main issues in the research and justification why the author has selected the subject as an academic paper. More over, in this chapter also discuss the research questions as guidelines. The main objectives of the study are stated in this chapter in order to provide background information for the readers. This chapter also explains the significance of the research and Structure of the paper.
Chapter 2 Literature Review, discuss the theories and concepts used by the research as references, tools or models to explain the main issues in the next chapters such as the Theories of Fiscal Decentralization, Fiscal Decentralization and Economic Growth, Intergovernmental Transfer Fund and Theories of Regional Economic Development.
Chapter 3 Methodology and Research Design, this chapter explains the research’s methodology, research paradigm, research approach, research focus, which is shown and described by figure and explanation, in order to give the logical framework of the research. In the end, this chapter also includes data collection and data analysis techniques and research design.
Chapter 4 Fiscal Decentralization in Indonesia, gives an overview and description of the Indonesian Fiscal decentralization policy in Indonesia. How is the implementation of Intergovernmental Fiscal Transfer to sub National Government including General Purpose Fund, Revenue Sharing Fund and Specific Purpose Fund during the fiscal decentralization era and problems in the fiscal decentralization policy implementation.
Chapter 5 International Comparative Policy on Fiscal Decentralization, gives the overview and comparative analysis of Fiscal decentralization in Japan, India, China and Vietnam.
Chapter 6 Analysis of the Impact of Fiscal decentralization to Regional Economic Development in Indonesia period 2005-2008, includes a detailed discussion and analysis of the impact of fiscal decentralization to regional economic development in Indonesia which implemented since 2001. This chapter will also analyze the impact of Intergovernmental Fiscal Transfer, General Purpose
Fund, Revenue Sharing Fund, and Specific Purpose Fund to Regional Economic Development.
Chapter 7 Conclusion and recommendation, provides a summary as conclusion of the main arguments taken in the research and also the recommendation for fiscal decentralization policy decisions.
CHAPTER 2 LITERATURE REVIEW
2.1 The Theories of Fiscal Decentralization
Fiscal decentralization is a process of budget distribution from the higher levels of government to lower levels of government to support the functions or duties of delegated administration. Fiscal decentralization is a logical consequence of the implemented policy of regional autonomy. The basic principles that must be considered is the money follow functions, transfer or delegation of authority means the government take the necessary budgetary consequences to exercise these powers. Fiscal balance is done through the mechanism of equalization funds, namely the division of revenue between levels of government in order to perform the functions of government within the framework of decentralization. Fiscal balance problem becomes a serious problem because many of the central government does not allow local governments to conduct public debt.
Implementation of fiscal decentralization and regional autonomy will lead sub National government an obligation to provide public services and improve the regional economy. Roy Bahl (2008) states that in general, the benefits and the weakness of fiscal decentralization can be specified as follows:
1. The Benefits of Fiscal Decentralization
a. An economic efficiency - the budget for public services could be more easily adapted to local preferences with the level of accountability and a high willingness to pay.
b. Opportunities to increase tax revenue from local taxes - the local government can levy taxes on the basis of consumption and assets that can not be withdrawn by the Central Government.
2. The weakness of fiscal decentralization
a. Low central government control to the macro economy;
b. The difficulty of implementing policies of economic stabilization;
c. The difficulty of implementing policies of economic development with equity; d. The amount of costs to local government rather than a benefit.
So the success of fiscal decentralization is strongly influenced by the existence of a trade-off between the benefits and drawbacks. In implementing decentralization fiscal principles, Money Follow Function is one of the principles that must be considered and implemented (Bahl, 1999). That is any submission or devolution of government authority has consequences on the budget required to implement the authority. Granting local autonomy through fiscal decentralization contained three main missions (Barzelay, 1991):
a. Create efficiency and effectiveness resource management areas;
b. Improving the quality of public services and welfare of the community; and c. Empowering and creating space for the community to participate (participate) in
the development process.
Fiscal decentralization will provide optimum benefits if followed by adequate financial capability by autonomous regions. Based on Law. 33 Years 2004 revenue sources that are used for funding local government in implementation of fiscal decentralization are Own Local Revenue (PAD), General Purpose Fund (DAU), Specific Purpose Fund (DAK), Revenue Sharing, Sub National Government Loans, and
other legitimate revenue.
Fiscal decentralization is needed for improvement of economic efficiency, cost efficiency, improving accountability and increasing mobilization of funds. Fiscal decentralization is can not be only adopted, but in should be adapted with historical and cultural background, institutional conditions, political and economies inherent in the country. Also, implementation on each sub national governments is encouraged to be more independent in managing fiscal policy. Fiscal policy could be made through the allocation of funding resources on programs and activities that are oriented to the needs of society, so hopefully it can encourage job creation and reducing poverty.
2.2 Fiscal Decentralization and Economic Growth
Many researches on fiscal decentralization policy have been conducted in Indonesia and other countries in the world. In Indonesia, researches try to examine the high dependence of local government to central government. World Bank (1994), reported that the Indonesian financial system is the most centralized countries compare to China, Korea, India, Brazil, Argentina and Colombia. The ratio of local government revenue to expenditure is only 30%. This number show that the level of financial independence in local government is only 30% compare to other countries between 48%-76%. This reflects of high vertical fiscal imbalance.
Lewis (2001), conducted a study on the General Purpose Fund model and its impact on equality. Study was done to analyst the impact of equality on (1) variation between local government on potential revenue relative to expenditure before and after General Purpose Grant, and (2) the impact on increasing fiscal expenditure per capita. The first results show that variation is getting smaller, or there is increasing in
equalization on the impact of General Purpose Fund. While the latter shows the opposite, increasing in fiscal per capita needs, as expected, followed by the increasing in transfer per capita. This means that allocation will increase inequality.
Nowadays, research on the role of decentralization fund to economic growth has become an important policy issue in developing countries and transitional countries. Research of Aschauer (1989) and Barro (1990) quoted from Martines and Mc Nab (2001), find that increase in the part of central government consumption on GDP has a negative correlation with growth in income per capita. This McNab finding (2001) is in line with the study of Ram (1986), that there is a positive correlation between central government consumption on GDP with growth in income per capita. Meanwhile, Devarajan, Swaroop, and Zou (1996) study the impact of the composition of public expenditure on economic growth and found that increasing of central government expenditure has a positive significant to economic growth, but the capital component of public spending has a negative correlation in the growth per capita. Developing countries may allocate too many resources in capital investment on their expenditure.
Research by Aschauer (1989), Easterly and Rebelo (1993) found that spending on public infrastructure have been proven has significant positive correlation on economic growth, whereas Gupta, Honjo and Verhoeven (1997), which examines the efficiency of government spending in education and health in 38 African countries, found that on average, countries in Africa are less efficient compare to the countries in Asia and the Western Hemisphere. Inefficiency might be the result of relatively high salary of civil servant and intra-sector allocation of Government resources.
The research by Lin and Liu (2000), find that fiscal decentralization has a positive and significant impact on the economy growth in China. However in contrast
with the general findings that fiscal decentralization associated with lower growth for China case by Zhang and Zou (1998), in the U.S. by Davoodi, Xie, and Zou (1995), and for the entire sample of developing countries and developed countries by Davoodi and Zou (1998). Furthermore, Tai Sung Kim (1997) conducted a research in Korea to examine the role of local governments on economic growth. The results of research indicate that the role of local government in the regional economic growth is very real.
Further research by Davoodi and Zou (1998), Philips and Woller (1997), found that there is a negative impact of fiscal decentralization on economic growth for cases in the developing countries, whereas in developed countries shows positive impact. Fiscal decentralization policy has been proven a positive impact on economic growth in the United States. Zhang and Zou (2001) examined the impact of fiscal decentralization on economic growth at the provincial level in China and India. The results show that there is a negative impact of fiscal decentralization on economic growth in China, while the experience in India, fiscal decentralization had a positive impact on economic growth.
Research by Martinez and McNab (2001), shows that qualitatively, fiscal decentralization affect economic growth indirectly, through a balanced distribution of resources among regions and macroeconomic stability. Furthermore, Martinez and McNab (2005), explained that the fiscal decentralization not directly affect the economic growth, but have an indirect effect and positive impact on economic growth through macroeconomic stability.
From the above explanation, the debate of the impact of fiscal decentralization on economic development is still on going. Most of the studies are still looking for the effects of decentralization on the administration and public services site.
Brojonegoro (2005), states that in the first five years of fiscal decentralization in Indonesia, is still difficult to conclude whether there is a direct impact of decentralization on economic growth. One of the reasons was that during that period, economic recovery is likely due to the national macro economic stability improvement. A stronger indication is that the western part of Indonesia (IBB) is growing faster than the Eastern Indonesian (IBT), although Sulawesi economy experiencing the fastest economic growth. Another reason is that there is an indication that fiscal disparities across regions become worsened, as described above on the experiences of other countries. In Indonesia, that condition is try to be neutralize by giving the General Allocation Fund in the next following years.
Research of Simanjuntak (2007) quoted from Juanda (2008), states that, with bigger fiscal decentralization fund, there is also improvement on social welfare, one of the reasons is the increasing on local government fund resources. However, if we look deeper on this case, there are some phenomena appear: on average the national welfare indicators always increasing, although not in all regions. According to Ministry of Finance, The Republic of Indonesia data in 2009, stated that out of 33 provinces in Indonesia, there are 15 provinces, which decreased in the number of poor people, on the other hand, in 8 provinces the condition was worsened.
The above conditions can be explained by the phenomenon of the provincial and districts/municipalities budget structure in Indonesia today. If we brake down the budget, is consisted of employee expenditure, goods expenditure, capital expenditures and other expenditure (see table 1 below). With the assumption that the expenditure that related directly to the improvement of economic indicators is capital expenditure, it can be seen that the average capital expenditure rate never reached a third of total local
government expenditure. The number is still far behind compared to employees expenditure who remain in the first rank since prior to implementation of decentralization and regional autonomy.
Table 2.1
Composition of Budget Expenditure all Sub National Government in Indonesia 2005-2008 (Trillion Rupiahs) Type of Expenditure 2005 2006 2007 2008 Employee Expenditure 85.62 (41.8%) 81.86 (32.3%) 130.48 (38.5%) 153.39 (39.4%) Goods Expenditure 45.22 (22.2%) 79.05 (31.2%) 61.20 (18.0%) 72.30 (18.6%) Capital Expenditure 45.48 (22.2%) 54.79 (21.6%) 104.74 (30.9%) 111.85 (28.7%) Other expenditure 28.69 (14.0%) 37.85 (14.9%) 42.90 (12.6%) 51.82 (13.3%) Total 205.02 (100%) 253.56 (100%) 339.34 (100%) 389.37 (100%)
Source: Ministry of Finance, RI
The unclear relationship between expenditure budgets with some indicators of Indonesian regional economy could also be noticed from the process of preparation of budget and the performance budget expenditures. The delay in the preparation of the budget is one of the factors that affect the improvement of the regional economy.
In addition, these conditions are worsened by a local government that has a surplus budget, especially in the last five years (see table 2). This indication is not good, because it reflects inadequate budget management.
Table 2.2
The Number of Sub National Government with a Surplus/Deficit Budget, and its Nominal
2004 2005 2006 2007
(Trillion rupiahs) surplus deficit surplus deficit surplus deficit surplus deficit
Number of distric/municipalities (4.49)206 (1.24)112 (11.25)282 (0.42)49 (21.99)341 (0.93)34 (34.04)373 (1.00)44 Number of Province 24 (2.83) (0.15)3 (7.70)29 (0.01)2 (5.03)21 (1.33)5 (8.96)26 (1.69)5 Total 230 (7.32) (1.39)115 (18.96)311 (0.43)51 (27.02)362 (2.26)39 (43.00)399 (2.70)49 National Budget (APBN) (23.80) (17.78) (30.44) (61.93)
2.3 Intergovernmental Fiscal Transfer
According to Widhiyanto (2008), Intergovernmental transfer can take two general forms. Intergovernmental Transfer can be conditional grants and unconditional grants. Conditional grants place any various kinds of restrictions on their use by the recipient, on the other hand unconditional grants are the lump sum transfers to be used in any way the recipient wants.
Intergovernmental Fiscal Transfers are intended to maintain consistency and continuity on implementation of regional autonomy and fiscal decentralization. Intergovernmental fiscal transfers consist of Balancing Fund and Special Autonomy and Adjustment Fund. Balancing Fund consists of Revenue Sharing (DBH), the General Purpose Fund (DAU) and Specific Purpose Fund (DAK). Balancing Fund should be viewed as a whole unified because three components complement each other.
Revenue Sharing (DBH), is one component of Balancing Funds sourced from the revenue budget allocated to the regions with a certain percentage based on the producing region (by origin) to fund local needs in the context of decentralization. Type of government revenue that has been distributed in the state budget includes several types of tax and natural resources which are managed by the central government. The characteristic of the transfer is a block grant and reflect the widest possible autonomy in their use in accordance with the potentials and needs of the region to promote economic growth and prosperity. The main purpose of the allocation of Revenue Sharing is to reduce the vertical fiscal imbalance between central and local government.
Due to differences in regional fiscal capacities, General Purpose Fund (or DAU) is aimed to address the problem of horizontal imbalances among sub-national governments. Differences in fiscal capacities arise from differences in local own-source
revenue and shared-revenue. So that, DAU has been used as an instrument of equalization grant, and the characteristic of the transfer is a block grant (Murniasih, 2007).
According to Law 33/2004, the specific purpose fund (DAK) is allocated to a particular sub national government to funding specific activities that are regional affairs and a program that became a national priority and became sub national government program. According to Murniasih, 2007, Specific Purpose Fund (DAK) is allocated to specific regions and certain sector programs. Specific Purpose Fund (DAK) intends to promote the attainment of minimum standards and compensate for benefit/cost spill-over related to priority capital investment.
2.4 Theories of Regional Economic Development 2.4.1 Regional Economic Growth
Development is a multidimensional process which includes a variety of the fundamental changes in social structure, community attitudes, and national institutions, in addition, to pursue accelerated economic growth, handling income inequality, and poverty. Development should reflect total change in a society or adjustment of the overall social system, without ignoring the diversity of needs base and the desire of individual and social groups that exist in it, to move forward toward more versatile living conditions both materially and spiritually (Todaro, 2003).
According to the Kuznets theory in Todaro (2003) economic growth is the increase on long-term capacity of the country concerned to provide economic goods to its population. The increase in capacity is determined by
progress or adjustment of technological, institutional, and ideological demands states. Todaro (2003), stated that there are three main factors or components in the economic growth of each country. These three factors are:
a. Accumulation of capital, which includes all form or type of new investment: invested in land, physical equipment, and capital or human resources.
b. Population growth, which in will eventually increase the number of workforce. c. Technological advances, such as a new way or improvements in old ways
handling jobs.
A good distribution of income is increasingly prevalent. However without economic growth, something that will happen is equal of poverty distribution. Economic growth will result in improved income distribution when meet at least two terms, expand employment opportunities and increase productivity. With the spread of employment opportunities, people’s access to obtain income is bigger.
In this study, Economic growth is the change Gross Regional Domestic Product (GDP) per annum by the year 2000 constant prices, expressed in units of percent. This research used economic growth data issued by the Indonesian Central Bureau of Statistics for 33 provinces.
2.4.2 Percentage of Population below the Poverty Line
Poverty is a limitation that carried by someone, a family, a community, or even a country which causes discomfort in life, endangerment law enforcement and justice, endangerment bargaining power in the association world, the loss and the bleak future generations of the nation and state. This is a
broad definition of poverty. The poverty is related with discomfort in life, meaning that poor people's lives almost always and often uncomfortable. In all areas, they are always excluded, because they could not equating them with conditions surrounding community.
Many measurements could determine the number of poverty, one of them is the poverty line. Poverty line in terms of is a measure of general stating the amount of expenditure (in rupiah) to meet basic needs food and non-minimum diet (BPS, 2001), or standards states limit someone say poor, it considers the consumption point. The poverty line is used to determine the limit of poor people or the poverty line can be used to measure and determine the amount of absolute poverty. Poverty line based on consumption (consumption-based poverty line) consists of two elements (Kuncoro, 1997):
a. Expenditure that required to provide minimum nutrition standards and other basic needs, and
b. Amount of other varied needs, reflecting the cost of participation in everyday life.
Percentage of Population below the Poverty Line in this research is data issued by the Indonesian Central Bureau of Statistics (BPS) for 33 provinces.
2.4.3 Percentage of Unemployment
Standard definition for the Unemployed is those who do not have work, willing to work, and looking for a job. According to Central Statistic Bureau (BPS), the definition of Unemployed are (i) those who are seeking employment, or (ii) those who preparing the business, or (iii) those not seeking work because
they feel not possible to get a job (previously categorized as not labor force), and (iv) those who already have jobs but have not started work (Formerly categorized as unemployed), and at the same time they not working (jobless). Unemployed with this definition is usually called as unemployment (open unemployment). Specifically, the open unemployment according to BPS, consist of:
a. they are not working and seeking employment, b. they are not working and preparing for business,
c. they are not working and not looking for work, because they felt not possible to get a job, and
d. they are not working and not seeking work because accepted to work, but not yet started working.
In this study, variables proxy for the percentage of Unemployment is data issued by the Indonesian Central Bureau of Statistics (BPS).
2.4.4 Human Development Index (HDI)
United Nations Development Programme (UNDP) since 1990 has established an indicator of human welfare that can show human progress based on factors such as average life expectancy, average education level, literacy rates, and overall social welfare. This report assumes that human development is essentially process of enlarging human choices. People welfare indicators that are prepared by UNDP is known as Human Development Index (HDI).
Human Development Index (HDI) is a very useful tool to measure the level of welfare between countries or regions (Todaro, 2003). HDI indicators
exceed the usage of the conventional growth. Economic growth is necessary to maintain welfare, but growth is not the end goal of human development. Growth is just tool, the most important are how economic growth used to improve human capabilities and how people using these capabilities. One of the advantage of using HDI is this index reveals that a country/region can do much better at low income levels and that large increasing in income only play a relatively small role in the humans development (Todaro, 2003).
Social welfare is the level of a decent life that indicated by economic conditions and social community circumstances. In this study, variables proxy for the public welfare Data/Human Development Index (HDI) is data issued by the Indonesian Statistic Board (BPS).
CHAPTER 3
METHODOLOGY AND RESEARCH DESIGN
3.1. Research Paradigm
This topic will be presented in a "quantitative descriptive" approach by using Data Display Cross-case Analysis. This research is a combination between qualitative analysis and quantitative analysis. The use of quantitative analysis helps increase the reliability of the data by reducing the possible bias from the researcher’s opinion as well as establishing a commonly accepted basis for drawing conclusion (Taggart, 1997).
Quantitative analysis is used by using statistic tools such as trend analysis that compare statistic trend among province and summary descriptive statistic. Quantitative analysis is use to know the impact of intergovernmental transfer policy to regional economic development. Quantitative Analysis to answer this question use secondary data that are national data, by doing analytical statistic on many indicators such as regional economic growth, percentage of unemployment and percentage of poverty in every province. This analysis using trend analysis on average between years 2004-2008 on every province (aggregate data City/Municipalities in the same province).
Finally, to answer the question of relationship between Intergovernmental Fiscal Transfer and regional economic development indicator, author do statistical analysis using SPSS Software to know their each correlation.
3.2. Research Approach
This research uses a "quantitative descriptive" approach to address the research problems, and to bridge the cause and effect way of thinking. As Creswell (2003) point out, a quantitative approach is one in which the investigator primarily uses post-positivist claims for developing knowledge (i.e. cause and effect thinking, reduction to specific variables and hypotheses and questions, use of measurement and observation, and the test of theories), employs strategies of inquiry such as experiments and surveys, and collects data on predetermined instruments that yield statistical data (Creswell, 2003). Using the "quantitative descriptive" approach, the study seeks objectivity in its analyses of reality based on the empirical evidence and tested theories. In this study, the subjects are views as detached from the researcher in order to establish the objective explanation.
3.3. Research Focus
The research aims to analyze the performance of a government program. In this context, the government program is fiscal decentralization. (i) To convey the importance of fiscal decentralization policy in Indonesia in order to create regional economic development. (ii) To know the impact of fiscal decentralization policy to regional economic development in Indonesia, in regard to the economic development objectives. (iii) To know the impact of Intergovernmental Fiscal Policy to regional economic development in Indonesia. (iv) To know whether sub National Government is run on the right track in implementing fiscal decentralization.
3.4 Data Collection
Data Collection Schedule:
Period Activity
April 2010-Juli 2010 • Data Collection and observation • Proposal Thesis, Literature Review. August 2010-February 2011 • Data collection and In depth observation
in national level (Jakarta)
• Analyst data and finding writing.
April 2011- July 2011 Write a Thesis or Research Report as Master Candidacy requirement.
October 2011-April 2012 • Submit a Thesis or Research Report as Master Candidacy requirement
• Thesis/report review; check and re-check with the supervisor.
• Research finalizing; with the drafting of conclusion and recommendation.
• Submit a Master Thesis/research report.
Selected Respondent and Secondary Data:
Information and data collection required for the analysis are obtained by direct source as follows:
1. Primary Data
Primary data are the data, and information obtained directly from the source who act directly as an actor by conducting an interviews and make a questioner. Primary data are collected by making an interview with senior staff in the ministry of Finance The Republic of Indonesia. With a qualitative interview, there is a possibility to get deeper information about the topic, what happening, how a policy happen and how a policy could be better.
The main goal of an interview with senior staff in directorate general of fiscal balance, Ministry of Finance are to gain all the information about the implementation of intergovernmental fiscal transfer and the obstacle that happen during the implementation of fiscal decentralization in Indonesia.
2. Secondary Data
Secondary data are collected from Regional Financial Information System (Sistem Informasi Keuangan Daerah), Directorate General of Fiscal Balance, MoF. Directorate General of Fiscal Balance provides all regional financial data that cover all province in Indonesia and from Indonesian Statistic Board (Badan Pusat Statistik) that provides data indicator of regional economic development in every province in Indonesia.
The secondary data are:
• Transfer Fund to Sub National Government data series 2001-2008 (Ministry of Finance)
• Revenue Sharing Fund data series 2005-2008 (Ministry of Finance) • General Purpose Fund data series 2005-2008 (Ministry of Finance) • Specific Purpose Fund data series 2005-2008 (Ministry of Finance)
• Special Autonomy Fund and Adjustment Fund data series 2004-2008 (Ministry of Finance)
• Gross Product Domestic Regional Growth base on constant price 2000, Year 2004 – 2008 by province (Regional Economic Growth) (Indonesian Statistic Board/BPS)
• Percentage of Population Below the Poverty Line by Province data series 2005-2008 (BPS)
• Percentage of Unemployment by Province data series 2005-2008 (BPS) • Human Development Index (HDI) data series 1996 – 2008 (BPS) • Percentage of Unemployment by Province data series 2005-2008 (BPS) • Williamson Index for PDRB Year data series 2002 – 2008 (BPS)
• Population by Province, data series 2007 – 2009 (BPS)
• Theoretical data obtained from relevant text books that will be used as the theoretical frameworks in analyzing
• Other related data from journals and media such as newspaper (local, national and international) and internet.
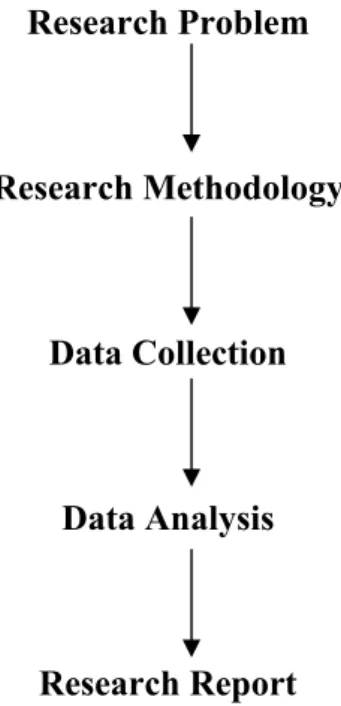
3.5. Research Design
The research design is provided in figure 3.1 below:
Figure 3.1.: Research Design
Research Problem
Research Methodology
Data Collection
Data Analysis
CHAPTER 4
FISCAL DECENTRALIZATION IN INDONESIA
4.1 Fiscal decentralization in Indonesia
Law No. 32 of 2004 on Regional Governance and Law No. 33 of 2004 concerning on Fiscal Balance between Central Government and Local Government, giving greater authority to local governments in managing government and local finance. Thus, regional development is expecting to run in accordance with the aspirations, needs and priority areas, so as to provide a positive impact on regional economic development, which in turn will improve the welfare of the community.
Fiscal decentralization as one of the instruments of government policy have principles and purposes to: (i) reduce fiscal disparities between the Government and the local (vertical fiscal imbalance) and inter-regional (horizontal fiscal imbalance), (ii) improve the quality of public services area and reduce inequalities in public services between regions, (iii) improving the efficiency of utilization of national resources, (iv) good governance, transparency, and accountability in the implementation of the allocation of transfers to regions targeted, timely, efficient, and fair; (v) support to fiscal sustainability in macro-economic policy. In addition, to increase the accountability of financial management area, the area is giving the authority to collect taxes (taxing power).
The main instrument of fiscal decentralization policy is through a policy of intergovernmental fiscal transfer, whose components are Balancing Fund, the Special Autonomy Fund, and Adjustment Fund. Balance Fund, consist of Revenue Sharing
(DBH), General Purpose Fund (DAU) and Specific Purpose Fund (DAK), is the largest component of the intergovernmental fiscal transfer. The amount of intergovernmental fiscal transfers continued to increase in line with the implementation of regional autonomy and fiscal decentralization, from Rp81.1 in 2001 to Rp226.2 trillion in 2006 or increased by an average of 22.8 percent per year. Later in the year 2007 intergovernmental fiscal transfer amounted to Rp254.2 trillion and in 2008 rose by 15 percent to Rp292.4 trillion.
Figure 4.1
Scope of Transfer to Region
Balance Fund
Special Autonomous & Adjustment Fund
Revenue Sharing (DBH) General Allocation Grant (DAU) Specific Allocation Fund (DAK)
Spec Auto For PAPUA Spec Auto ACEH Additional Spec Auto Fund For Infrastructure in PAPUA
Grant For Enhancing Income of Teachers Spec.Auto Fund Adjustment Fund DBH Property Tax DBH Income Tax DBH Forestry DBH General Mining DBH Fishery DBH Oil&Gas DBH Excise DBH Tax DBH Natural Resource DBH Fee Acquisition
Additional Spec Auto Fund For Infras in PAPUA BARAT
Spec Auto PAPUA BARAT
DBH Geothermal Fund For Local Performance
Incentive 27
Source: Ministry of Finance RI
area, namely deconcentration funds, fund assistance duties (TP), and funds to implement programs and activities of Government agencies in the region. Although, these funds are not included in the sub national Government Budget (APBD), significantly, the funds spent in the local government, either physical or non physical expenditures. The amount of funds is quite significant, and the proportion of the expenditure of State Revenues and Expenditures Budget (APBN) is quite high. In 2008, the total funds spent in the region reached Rp408.9 trillion or 41.3 percent of total state budget expenditure.
Thus, approximately 65 percent of the total expenditure budget will be spent in the local government (see Figure 4.2, 4.3 and 4.4).
Figure 4.2
Proportion of Government Expenditure Budget FY 2008 (In Trillion Rupiahs)
Figure 4.3
Proportion of Intergovernmental Fiscal Transfer FY 2008 (In Trillion Rupiahs)
General Purpose Fund, 179.5 Natural Resources Revenue Sharing , 35.9 Tax Revenue Sharing, 41.8 Specific Purpuse Fund, 21.2 Special Autonomy Fund, 7.5 Adjustment Fund, 6.4
Source: Ministry of Finance RI
Figure 4.4
Proportion of Central Government Expenditure in Sub National Government FY 2008 (In Trillion Rupiahs)
In addition to these funds, the Sub National Governments also has its own funding sources of revenue (PAD), which in 2008 total for the province and district Rp54 trillion. The total number of these funds, either from the state budget, as well as those derived from Own Revenue (PAD), will be very useful and a fiscal stimulus to the economy in the region in order to realize the welfare of society. The success of a region in realizing the welfare of society depends on the policy of each local government. The policy can be done through the allocation of funding resources to programs and activities that are oriented towards the needs of society (public interest), so it can create jobs and reduce the number of poor people.
Allocation of funding sources will be reflected in the allocation of spending expenditures. If the allocation of expenditures is divided by type of spending, then during 2005-2008, the share of personnel expenditure is the highest ranked an average of 38 percent of total spending. Meanwhile, the share of goods expenditures reached 25.9 percent, 25.8 percent of capital expenditures and other spending 10.3 percent. Meanwhile, when divided by function, in 2007 the Sub national government Expenditures that are used to perform the functions of public service is top ranked 35 percent of total regional expenditure. While local government expenditures that used to fund the education functions reached 23 percent, the housing function and public facilities by 19 percent, health functions only 8 percent, and allocation for the economic function are 10 percent.
Governments have an important role in improving the regional economy and welfare of the community through efforts to accelerate the disbursement of intergovernmental fiscal transfer and to encourage the implementation or realization of local government expenditure. To that end, the Government continues to push for the
establishment of Regional Regulation (Perda) Budgets can be done in a timely manner in order to accelerate the realization of regional expenditures. This needs to be done because of delays in setting local budget law is feared will lead to the accumulation of idle funds, which tend to be placed into the form of short-term investments, such as Bank Indonesia Certificates (SBI) through the Regional Development Banks.
Acceleration setting budgets and actual expenditures should be coupled with a quality of Local government expenditures. Efforts to improve the quality of local government spending can be done through the pattern of performance-based budgeting, budgeting in the medium term development framework, and accountable reporting systems. It is already started to set in various laws, such as guidelines for financial management and government accounting standards.
Acceleration intergovernmental fiscal transfer distribution, acceleration of the realization of regional spending, and improving the quality of government spending is expected to improve the quality of public services and local economic development. However, improving the quality of public services and local economic development must be balanced also with equality, and the level of inter-regional social welfare.
To measure the prevalence rate mentioned above, according to figures Williamson index that measures the level of inter-provincial distribution of GDP (excluding DKI Jakarta), in 2002 the gap level of economic activity in Indonesia is in the index amounted to 0.722 and decreased to 0.589 in 2006. Decreasing in number of Williamson Index indicates that the development of inter-provincial economic activity in Indonesia has decreased the level of the gap, although the index is still relatively high. Furthermore, to measure the level of social welfare, can be used Human Development Index (HDI). Based on survey results of the United Nations Development
Program (UNDP), Indonesia HDI value in 2001 amounted to 0.682 and in 2005 increased to 0.728. This indicates that an increasing in social welfare during this period. Based on the HDI data measured by the Central Statistics Agency (BPS), in 2007 Jakarta Provincial HDI ranks highest with an index value of 76.33, while Papua Province HDI ranked lowest with an index value of 59.91.
The aggregates size showed increased levels of economic conditions and welfare of the community mentioned above, an indication of the impact of increasing the amount of funds spent in the region, both through the mechanism of decentralization funds and other funds in the region. However, when viewed in partial, economic development and social welfare of each area were still different. Although the national average percentage of poor people has decreased, but still there are some provinces that have increased the percentage of poor population.
The regions that have a per capita allocation of funds, either through funding mechanisms decentralization, deconcentration, and funding assistance duties, as well as vertical agency funds, should also have an exciting achievement in terms of increased economic growth, poverty reduction, and unemployment reduction. However, based on the evaluation results on the last few years indicate that some areas that received great funding per capita was still to have indicators that have not been satisfactory level of prosperity and the economic growth rate is relatively slow. This indicates that the pattern of expenditures in some regions are still not optimal in order to increase people's income and regional economic development.
4.2. Implementation of Fiscal Decentralization in Indonesia
Along with the development of local autonomy and fiscal decentralization, decentralization of funding in the budget nomenclature is also changing. Since the year 2001-2007, nomenclature for the financing of decentralization has been amended several times in the posture adjustment budget which was originally known as the localized expenditure, and last up to 2007 are adjusted to local expenditure. Starting in 2008 the nomenclature was changed to Transfer to region settings specified in Standard Account.
After the implementation of fiscal decentralization policy, the allocation of transfers to the regional development can be seen in Figure 4.5. In the graph we can see that from the years 2001-2008 in nominal allocation of transfers to regions continues to increase on average by 20.7 percent per year.
Figure 4.5
Transfer Fund to Sub National Government 2001-2008 (In Billion Rupiahs)
0 50,000 100,000 150,000 200,000 250,000 300,000 2001 2002 2003 2004 2005 2006 2007 2008 Balancing Fund Special Autonomy and Adjustment Fund
Source: Ministry of Finance RI
Development of the realization of transfers to the regional that allocated in the budget over seven years of fiscal decentralization, from the year 2001 - 2008 are presented in Table 4.1. In 2001, the allocation of transfers to a sub national government
includes a balancing fund. Since 2002, the allocation of transfers to the sub national government also includes a Special Autonomy Fund for Papua Province as the implementation of Law No. 21 of 2001 on Special Autonomy for Papua Province, and Fund Balance or Adjustment Fund allocated to sub national government that receive General Purpose Fund (DAU) smaller than the previous year. Beginning in 2008, the Government also allocates special autonomy fund at 2 % of national General Purpose Fund (DAU) ceiling for 15 years, and starting in the years 16th until the 20th of 1% of national General Purpose Fund (DAU) ceiling for the Province of Nangroe Aceh Darussalam in accordance with Law Number 11 Year 2006 on the Governing of Aceh.
Table 4.1
Transfer Fund to Sub National Government 2001-2008 (In Billion Rupiahs)
2001 2002 2003 2004 2005 2006 2007 2008
I. Balancing Fund 81,054.4 94,656.6 111,070.4 122,867.6 143,221.3 222,130.6 243,967.2 278,714.7
a. Revenue Sharing 20,007.7 24,884.1 31,369.5 36,700.3 49,692.3 64,900.3 62,942.0 78,420.2
b. General Purpose Fund 60,345.8 69,159.4 76,977.9 82,130.9 88,765.4 145,664.2 164,787.4 179,507.1
c. Specific Purpuse Fund 700.9 613.1 2,723.0 4,036.4 4,763.6 11,566.1 16,237.8 20,787.3
II. Special Autonomi Fund and Adjustment Fund 0.0 3,547.5 9,243.9 6,855.3 7,242.6 4,049.4 9,296.0 13,718.8
a. Special Autonomi Fund 0.0 1,175.5 1,539.6 1,642.6 1,775.3 3,488.3 4,045.7 7,510.3
b. Adjustment Fund 0.0 2,372.5 7,704.3 5,212.7 5,467.3 561.1 5,250.3 6,208.5
TOTAL 81,054.4 98,204.1 120,314.3 129,722.9 150,463.9 226,180.0 253,263.2 292,433.5
Source : Ministry of Finance RI
REALIZATION OF NATIONAL BUDGET
Judging from the amount of funds that are located to the regions, the actual transfer to the Regions in 2001 was Rp81.1 trillion (4.8 percent of GDP), in the year 2006 reached Rp226. 2 trillion (6.8 percent of GDP), an increase average of 22.8 per year. In the state budget of 2007, Transfers to the Regions was Rp254.2 trillion (6.8 percent of GDP) or an increase of 12.4 percent compared to 2006. Furthermore, in the
Balancing Fund as the largest component of transfers to regions showed an increase from year to year. In 2001, the realization of Balancing funds amounting to Rp81.1 trillion (4.8 percent of GDP), then in 2007 reached Rp244.6 trillion or increased by an average of 22.3 percent per year. Furthermore, in the year 2008 Revised Budget allocation of equalization funds amounting to Rp278.4 trillion, or 13.8 percent higher than the realization in 2007. Allocation of Balancing consists of General Purpose Fund (DAU), Revenue Sharing (DBH) and Specific Purpose Fund (DAK). Development of the allocation of Balancing Fund from the year 2001-2008 can be seen in Figure IV.6.
Figure IV.6
Trend Balancing Fund DAU, DBH, and DAK FY 2001-2008 (In Billion Rupiahs)
0 50,000 100,000 150,000 200,000 250,000 300,000 2001 2002 2003 2004 2005 2006 2007 2008
Specific Purpose Fund General Purpose Fund Revenue Sharing
Source: Ministry of Finance RI
4.2.1 Implementation of Revenue Sharing (DBH)
Revenue Sharing (DBH) is one component of Balance Funds sourced from the revenue budget allocated to the regions with a certain percentage figure is based on producing regions (by origin) to fund the needs of the region in implementation of decentralization. Allocation policies, calculation, and the DBH distribution confirm that
the source comes from the state budget by a certain percentage with more attention to the potential for producing region. This type of state revenue that has been distributed in the state budget includes several types of tax potential and natural resources are managed by the center. DBH transfers are block grants to reflect the widest possible autonomy in their use, in accordance with the potentials and needs of the region in promoting economic growth and prosperity in the region. The main purpose of the allocation of revenue-sharing is to reduce the vertical fiscal imbalance between central and local governments.
Revenue Sharing (DBH) is calculated based on a certain percentage of each source of domestic revenues, both taxes and revenues from natural resources. Revenue Sharing (DBH) Tax and Natural Resources distribution as stipulated in Law No. 33 of 2004. State revenue derived from tax revenues distributed to the regions covering Income Tax, the Income Tax Article 21 and Article 25/29 individual Domestic taxpayer (WPOPDN), Land and Building Tax (PBB), and Customs and the Land Rights Acquisition Buildings (BPHTB). Meanwhile, state revenues from natural resources distributed to the regions include, among other natural resources: petroleum, natural gas, general mining, forestry resources, fisheries and natural resources. Since 2006, Revenue Sharing (DBH) natural resources also includes forestry reforestation fund, which is a diversion from the Specific Purpose Fund Reforestation Funds (DAK DR).
Realization of Revenue Sharing (DBH) including the transfer of Specific Purpose Fund Reforestation Funds (DAK DR) into the Revenue Sharing (DBH) Forest, in line with the increase in state revenue that has been distributed realization, showing a tendency to increase, from Rp27.07 trillion in 2005 to Rp33.47 trillion in 2006. Furthermore, in the Revised Budget of 2007, the realization of DBH is estimated at
Rp60.87 trillion. Moreover in 2008, the realization of DBH is estimated at Rp78.136 trillion.
Figure 4.7
Revenue Sharing Fund (DBH) FY 2008 (In Rupiahs) 0 2,000,000,000,000 4,000,000,000,000 6,000,000,000,000 8,000,000,000,000 10,000,000,000,000 12,000,000,000,000 14,000,000,000,000 16,000,000,000,000 18,000,000,000,000 Pr ov . N an gg ro e A ce h … Pr ov . S um at er a U ta ra Pr ov . S um at er a Ba ra t Pr ov . R ia u Pr ov . J am bi Pr ov . S um at er a Se la ta n Pr ov . B en gk ul u Pr ov . L am pu ng Pr ov . DK I J ak ar ta Pr ov . J aw a Ba ra t Pr ov . J aw a Te ng ah Pr ov . DI J og ja ka rt a Pr ov . J aw a Ti m ur Pr ov . K al im an ta n Ba ra t Pr ov . K al im an ta n Te ng ah Pr ov . K al im an ta n Se la ta n Pr ov . K al im an ta n Ti m ur Pr ov . S ul aw es i U ta ra Pr ov . S ul aw es i T en ga h Pr ov . S ul aw es i S el at an Pr ov . S ul aw es i T en gg ar a Pr ov . B al i Pr ov . N us a Te ng ga ra B ar at Pr ov . N us a Te ng ga ra T im ur Pr ov . M al uk u Pr ov . P ap ua Pr ov . M al uk u U ta ra Pr ov . B an te n Pr ov . B an gk a Be lit un g Pr ov . G or on ta lo Pr ov . K ep ul au an R ia u Pr ov . P ap ua B ar at Pr ov . S ul aw es i B ar at
Source: Ministry of Finance RI
4.2.2 Implementation of General Purpose Fund (DAU)
General Purpose Fund (DAU) is a fund sourced from the revenue budget allocated for the purpose of inter-regional equalization of financial ability to fund the needs of the region in implementation of decentralization. DAU aims to interregional equity finance capabilities that are intended to reduce the financial imbalance between the regions through the application of a formula that considers the needs and potential areas. DAU determined on a region the size of the fiscal gap of a region which is the difference between fiscal needs and fiscal capacity.
In addition to Revenue Sharing (DBH), a significant increase from year to year also occurred in the General Purpose Fund (DAU). This is reflected, among others, of increasing the ratio of General Purpose Fund (DAU) allocation of net Domestic