THE EFFECTS OF NOTIFICATION CUE DESIGN ON SITUATIONAL AWARENESS
10
0
0
全文
(2) (Bartram et al., 2001) [1]. Gaver, Smith, and O’Shea (1991) [11] argued that auditory cues are designed to convey information from computer systems, and they have been proven to be effective in helping users recognize and judge in complex environments. Both are admirably well suited for conveying semantic information about events. Auditory cues can help appropriately indicate the importance of messages which lead users to the perceived urgency. However, the quality of auditory notifications can be affected due to conflicts caused by environmental interference (Kilander & Lönnqvist, 2001) [17]. Research studies conducted by Brewster and King (2005) [5] and Chohan, Lorna, and Brown (2007) [4] focus on the tactile cues as feedback for mobile devices. They used vibration to present the progress, and the results showed that the addition of tactile cues to the touchscreen significantly improved finger-based text entry. They also suggest that tactile feedback should be used on touchscreen devices to regain some of the feelings lost when interacting with a touchscreen by finger. Visual cues are the most important form of feedback for users interacting with mobile devices. Schlienger et al. (2007) [22] studied the use of animation and sound feedback in a computer interface. The results showed that these dimension cues in combination can improve the user's situational awareness, perception, and understanding level. The results also showed significant advantages when using dynamic visual feedback in the user interface. 2.2 Users’ mental models of situation awareness Situational awareness is the perception of the elements in the environment within a volume of time and space, as well as the comprehension of their meaning and a projection of their status in the near future (Endsley, 1988) [10]. It is often used to describe the psychological process by which a human makes behavioral decisions after perceiving the conditions of the current environment and events. The cognitive process of human beings can be explained by Endsley’s theory of situation awareness when the notification occurred. It includes the following three levels: perception, comprehension, and projection. More specifically, when notifications are presented, users’ series of responses on acting are initiated based on the notification of perceptivity, cognitive information, and prediction of the outcomes. All of these processes correspond to these three levels: (1) Perception of the elements in the environment; (2) Comprehension of the. can only be used to pay attention and process some of the most important stimuli. The way of synchronizing complex information and choices must be made as early as possible. Therefore, mobile notification cues must be designed such that they can achieve the purpose of stimuli, minimize the possibility of the users’ cognitive overload, and avoid possible interruptions. The research objective of this study was therefore to redesign the cues of mobile application notifications, enhance the user experience, and avoid negative emotions caused by the interruptions. The integration styles of different dimension cues as the mobile notifications can also help explore how to combine cues to be better applied to the interaction between the users and the mobile applications. 2. Literature review 2.1 Mobile notification dimensions Notification can be a visual cue, an auditory signal, or a tactile alert generated by an application or service that relays information to a user outside the current focus of attention (Iqbal & Bailey, 2008) [15]. For mobiles, notification is typically delivered as a message or instant feedback on all kinds of applications. Notifications stimulate user perception via different dimensions, including visual, auditory, and tactile cues. Different dimension cues can satisfy the user requirements to help them obtain information regarding different situations. To date, most of the research on notification has focused on the user's handling of immediate messages, emphasizing the negative impact of notifications on work efficiency that disrupts the user's attention to the current task to focus on the interruption temporarily. It is difficult for the person to return to the previous task after having been interrupted by an instant message, a call, or a conversation with others (Czerwinski et al., 2000) [7]. Leiva et al. (2012) [18] found that phone call notifications interrupt the use of an application and significantly increase the time which a user spends completing the initial task. In De Vries et al.'s (2013) [8] study, participants preferred polite notifications during lowworkload tasks and neutral notifications during highworkload tasks. The level of politeness of a notification affects how annoyed and disrupted users may feel. In addition, some scholars have studied different notification cues. The auditory cue is a very appropriate modality for the notification of changes. It brings information regardless of the user's focus of attention 2 50. Journal of the Science of Design. Vol. 4 No. 2 2020.
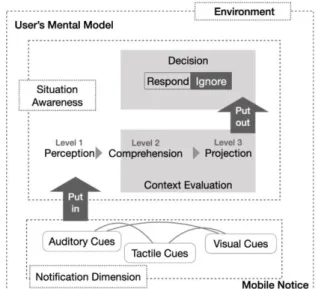
(3) 3.2 Variables The experiment was conducted using a 2 (visual presentation type) x 3 (cue dimension) mixed factorial design (see Table1). The levels of visual presentation type were static and dynamic. The levels of the cue dimension were V, VS, and VV cues. The variable of visual presentation type is a between-subject variable and the cue dimension is a within-subject variable. The dependent variables were task efficiency and subjective preferences including interruption, satisfaction, effectiveness, recollection, and concentration.. current situation; and (3) Prediction of future status. When mobile notifications occur, users will process the information, and their mental models will be created. Integrated with the relevant theories of cognitive psychology [20] [25] [26], figure 1 shows the user’s mental models of situation awareness based on the theory mentioned above. There are three types of notification cues on mobile devices. When the notification occurs, these cues provide feedback to the users in multidimensional forms. Level 1 is related to a sensory experience. Users perceive that there is a piece of new information coming through auditory, tactile, and/or visual channels. In level 2, users comprehensively evaluate the current task and the environmental conditions. In level 3, users decide whether to respond to the notification or not. This decision might also be influenced by the user's emotion. McCrickard (1999) [19] introduced a set of tools entitled "Irwin" that uses graphical, auditory, and textual communication mechanisms to help users maintain a desired level of situation awareness and lead to faster reaction. 3. Methods 3.1 Participants For the experiment, the purposive sampling method was used in this study. A total of 22 males and 38 females were recruited as volunteers to participate in the experiment; their ages ranged from 19 to 40 years old. They had a considerable amount of experience using mobile applications, handling official business, checking mail by mobiles, and/or shopping online on a daily basis.. Table 1. The independent variables of the experiment. Cue dimension (Within Group). Visual presentation type (Between Groups) S D Static design Dynamic design. 1.Vision(V). S(V). D(V). 2.Vision+Sound (VS). S(VS). D(VS). 3.Vision+Vibration (VV). S(VV). D(VV). 3.3 Materials The experimental device is an iPhone with a 5.5-inch screen running the iOS12 system. The application was developed using “Xcode” and the visual part was designed using “Illustrator.” This is a forum prototype which implements general functions such as browsing through the author's home page, sending a message, replying to the author and so on. The notification messages are for presenting the current progress to users. The visual cues of the notification were designed as static and dynamic presentation types. The static presentation type is shown on the left of Figure 2. It was designed using a check mark with text below. Participants will receive the notification when the task is successfully done. The dynamic presentation type is shown on the right of Figure 2. According to different operation tasks, pictogram symbols were designed using dynamic animations presented to participants as positive feedback. In both designs, the notification window will disappear automatically after 1.25 seconds. Participants can also click on the screen to close the window and return to the current user interface status. 3.4 Process Participants were assigned to either the static group or the dynamic experimental group, and each participant experienced three notification cues in a counterbalanced manner. The participant completed the experiment individually in a quiet laboratory. During the experiment,. Figure 1. Users’ mental models of situation awareness. 3 Journal of the Science of Design. Vol. 4 No. 2 2020. 51.
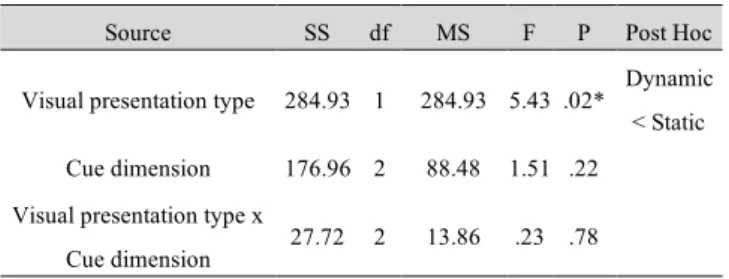
(4) Task 1 required that the participant change the topic classification to the “popular” class, follow one of the authors, and return to the homepage after the “following success” notification was presented on the user interface. Table 3 illustrates the results generated from the mixed factorial ANOVA regarding the comparison of the variables of the visual presentation type and the cue dimension. The results indicated that the main effect of the visual presentation type showed a significant difference (F=5.43, P=.02<.05). The participants who operated the static visual presentation type (M=19.65, Sd=.76) spent more time than those using the dynamic one (M=17.13, Sd=.76). The reason may be that there existed some click steps in task 1 which meant that they needed to recall the task 1 requirements during the operation when they focused on the current user interface status. The notification window of the dynamic presentation type could offer more information to the participants, so they could prioritize the dynamic visual presentation in information-loading situations. Participants’ recall and responses reflect that different forms of visual cues would impact their situation awareness. They perceived notifications in level 1. Then in level 2, participants would comprehend the visual presentation types, and the dynamic presentation type was easier to understand. Level 3 is about the prediction of future state. Participants behaved with a faster response in the dynamic presentation type than in the static presentation type. This result is consistent with Dessart et al. (2011) [9] in that a transition scenario with dynamics can reinforce understandability and trust. Therefore, users respond better to dynamics. There is no significant difference regarding the main effect of cue dimension (F=1.51, P=.22>.05). The interaction effects between the two variables of “visual presentation type” and “cue dimension” revealed no statistically significant difference (F=.23, P=.78>.05).. Figure 1. The static (left) and the dynamic (right) presentation types.. the participants were not informed in advance when the notifications would occur. The operational tasks were designed according to four basic functions (see Table 2). Each task would trigger a notification in a specific interface of the prototype. The notification message is a general reminder in order to present the progress of the task. The participants should go back to the initial home page after the notification was presented on the user interface indicating that the task was completed. After the task operations were completed three times, participants were asked to complete the subjective questionnaire, describe the noticed information, and provide comments on the designed cues. The entire experiment took less than 30 minutes. The experimental data were collected through a time estimation and a 7-point Likert scale. Table 2. The operational task of the experiment Change the topic category to “popular” and Task1. follow an author notification: following success. Task2 Task3 Task4. Archive a post notification: archiving success Give a post a like notification: liking success Reply with the word “good” to a post notification: sending success. 4. Results and Discussion The generated results were analyzed by mixed factorial analysis of variance (ANOVA) with three cue dimensions as the within-subjects factor and two visual presentation types as the between-subjects factor. The significances of main effect and interaction effect were analyzed by SPSS, and the post hoc comparison of LSD was adopted to help resolve the differences among the factor levels. 4.1 Analysis of task efficiency 4.1.1 Task 1: Change the topic category to “popular” and follow an author. Table 3. The mixed factorial ANOVA of task 1 regarding task operation time Source. Journal of the Science of Design. Vol. 4 No. 2 2020. df. MS. F. P. Visual presentation type. 284.93 1. 284.93 5.43 .02*. Cue dimension. 176.96 2. 88.48. 1.51 .22. 27.72. 13.86. .23. Visual presentation type x Cue dimension. 2. * means that P<.05 and there is statistical significance. 4 52. SS. .78. Post Hoc Dynamic < Static.
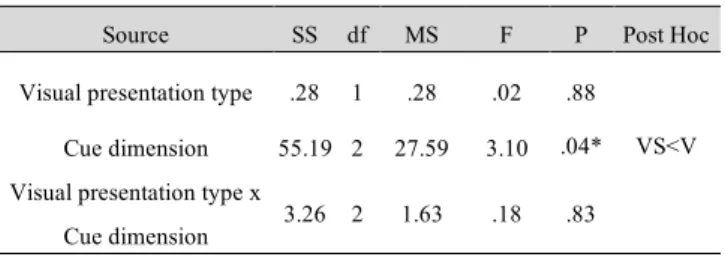
(5) 4.1.2 Task 2: Archive a post The second task required participants to open an author's post and archive it. The participant would need to return to the homepage after the “archiving success” notification was presented on the user interface indicating that Task 2 was completed. The results of mixed factorial ANOVA analysis are shown in Table 4. There existed no significant difference for the main effect of visual presentation type (F=.66, P=.42>.05). Nonetheless, the main effect of cue dimension showed a significant difference (F=3.11, P=.04<.05). The result of the Post Hoc comparison showed that the V cue (M=9.35, Sd=3.05) and the VS (M=8.24, Sd=1.78) cues showed a significant difference (P=.014<.05). No significant difference was found between the V cue and the VV cues (P=.14>.05). The VS cues and the VV cues also showed no significant difference (P=.39>.05). The result showed that the auditory cue would impact level 1 of the participants’ situation awareness. Thus, this might also affect participants’ responses and decisions in levels 2 and 3. Overall, the participants’ task operation efficiency of VS is better than that for the V cues. This result is consistent with the views of Gaver, Smith&O'Shea (1991) [11] and Brewster (2002) [3]. They argued that the similarity in the auditory cues which they support can improve the task operation accuracy compared to no auditory cues. Auditory cues also significantly improved the usability for both standard and small button sizes.. presentation type (F=.02, P=.88>.05). However, the main effect of the cue dimension revealed a significant difference (F=3.10, P=.04<.05). The result of the Post Hoc test indicated that the V cue (M=9.32, Sd=4.02) and the VS cues (M=8.48, Sd=2.96) showed a significant difference (P=.023<.05). No significant difference was found between the V cue and the VV cues (P=.15> .05), or between the VS cues and the VV cues (P=.28> .05). The results suggested that participants’ operation efficiency of VS is better than that of the vision only cues. The interaction effects between the two variables showed no statistically significant difference (F=.18, P=.83>.05). The results of task 3 were consistent with those of task 2. Table 5 The mixed factorial ANOVA of task 3 regarding task operation time. SS. df. MS. F. P. Visual presentation type. 3.50. 1. 3.50. .66. .42. Cue dimension Visual presentation type x Cue dimension. 39.01 2 19.50 3.11 .04* 2.54. 2. 1.27. .20. .81. SS. df. MS. F. P. Visual presentation type. .28. 1. .28. .02. .88. 55.19 2. 27.59. 3.10. .04*. 3.26. 1.63. .18. .83. Cue dimension Visual presentation type x Cue dimension. 2. Post Hoc. VS<V. 4.1.4 Task 4: Reply with the word “good” to a post Task 4 required participants to provide a post of the word “good” and return to the homepage after the “sending success” notification was presented on the interface to complete Task 4. The results of mixed factorial ANOVA analysis are shown in Table 6. The results indicate that the main effect on visual presentation type revealed a significant difference (F=4.42, P=.04<.05). The participants who operated the static presentation type (M=12.84, Sd=.42) spent more time than those using the dynamic presentation type (M=11.57, Sd=.42). There existed no significant difference for cue dimension (F=.13, P=.87>.05). The interaction effects of the two variables of “visual presentation type” and “cue dimension” showed no statistically significant difference (F=.09, P=.90>.05). The results were consistent with the result of task 1. After the participants' task performance in all four tasks was analyzed together with the authors’ observation, the results reflected that different forms of cue designs would impact the participants’ situation awareness. That is, no matter whether they were given a single cue or twodimensional cues, it affected their perceptions of the notification (level 1), comprehension of the message (level 2) and the responding decision (level 3).. Table 4 The mixed factorial ANOVA of task 2 regarding task operation time Source. Source. Post Hoc. VS<V. The interaction effects between the two variables of “visual presentation type” and “cue dimension” showed no statistically significant difference (F=.20, P=.81>.05). 4.1.3 Task 3: Give a post a like Task 3 required participants to give the post a like and return to the homepage after the “liking success” notification was presented on the interface to complete Task 3. The results indicated (see Table 5) that there was no significant difference for the main effect of visual 5. Journal of the Science of Design. Vol. 4 No. 2 2020. 53.
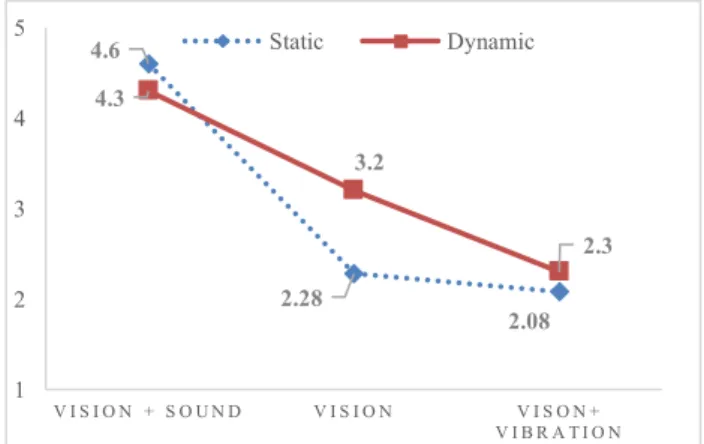
(6) Table 6 The mixed factorial ANOVA of task 4 regarding task operation time Source. SS. df. MS. Visual presentation type 72.64 1 72.64 Cue dimension Visual presentation type x Cue dimension. F. P. 4.42. .04*. 3.93. 2. 1.97. .13. .87. 2.88. 2. 1.44. .09. .90. significant difference from the VV cues (M=2.22, Sd=1.21) (P=.011<.05). There was also significant difference between the VS cues and the VV cues (P=.000<.05). Participants felt that they were most interrupted by the VS cues and least interrupted by the VV cues. Consider that the median score is 4; this means that the VV and V cues were viewed as non-interrupting, but the VS cues caused higher interruption. The results are consistent with Czerwinski (2000) [7] who suggested that sounds disrupted participants’ work. The interaction effect between the “visual presentation type” and “cue dimension” also showed statistically significant effects (F=3.14, P=.04<.05) regarding the feeling of being interrupted by the notification. Figure 3 indicates that the participants felt that the dynamic presentation type would be more disturbing when the cue dimensions were V and VV cues, but less disturbing with the VS cues. This is because the static type of text presentation might produce more cognitive load for the participants than the dynamic presentation type when VS cues appeared.. Post Hoc Dynamic < Static. 4.2 Participants’ subjective emotions The questionnaire investigating participants’ subjective emotions provides a number of psychological aspects on a 7-point Likert scale form to help investigate their user experiences and emotions, i.e., interruption of the notification (from 1 “no interruption feeling” to 7 “much interruption feeling”), satisfaction with the notification (from 1 “most dissatisfied” to 7 “most satisfied”), effectiveness of the notification (from 1 “least effective” to 7 “most effective”), memory recollection of the notification (from 1 “no memory recollection” to 7 “much memory recollection”), and concentration of the notification (from 1 “least concentrated” to 7 “most concentrated”). 4.2.1 Interruption In the degree of feeling interrupted by the notification, a higher score indicates that the participants feel that the interruption is stronger and more disturbing.. 5 4. SS. df. MS. Visual presentation type. 4.50. 1. 4.50 1.26. Cue dimension. 138.52. Visual presentation type x Cue dimension. 9.69. F. P. 2. 4.84 3.14. 2.28. 2. Post Hoc 1. VIS ION + S OUND. VISION. VV<V<VS. VISON+ V IBR A TIO N. reflects the degree of interruption, and higher scores on this measure indicated that the interruption is stronger. The horizontal axis represents the three different cue dimensions.. 4.2.2 Satisfaction For the degree of satisfaction with the notification, higher scores indicated that participants’ satisfaction was stronger. The results generated from the mixed factorial ANOVA are illustrated in Table 8. The results indicated that there was no significant difference on the mail effect of visual presentation type (F=.51, P=.47>.05). However, the main effect of the cue dimension showed a significant difference (F=12.65, P=.00<.05). The results from the post hoc comparison 6. Vol. 4 No. 2 2020. 2.08. Figure 2 The interaction diagram regarding the feeling of being interrupted by the notification. Note: The vertical axis. .04*. Table 7 illustrates the results generated from the mixed factorial ANOVA regarding the interruption degree comparison of the visual presentation type and the cue dimension. The results indicated that there was no significant difference on the main effect of visual presentation type (F=1.26, P=.26>.05), but the main effect of the cue dimension showed significant difference (F=44.99, P=.00<.05). The result from the post hoc comparison indicated that the V cue (M=2.78, Sd=1.55) and the VS cues (M=4.48, Sd=1.70) showed a significant difference (P=.000<.05); the V cue also showed. Journal of the Science of Design. 4.3. 2.3. * means that P<.05, ** means that P<.01 and there is statistical significance. 54. Dynamic. 3. .26. 2 69.26 44.99 .00**. Static. 3.2. Table 7 The mixed factorial ANOVA of the feeling of being interrupted by the notification Source. 4.6.
(7) 4.2.4 Recollection The scoring criterion was based on the recollected notice information by participants, where higher scores indicated more complete memories. Table 10 indicated that there was no significant difference on the main effect of visual presentation type (F=1.01, P=.31>.05). The main effect of the cue dimension showed significant difference (F=8.06, P=.00<.05). The result from the post hoc comparison indicated that the V cue (M=4.34, Sd=1.84) and the VS cues (M=5.12, Sd=1.63) showed significant difference (P=.004<.05), and the VV cues (M=5.22, Sd=1.70) and the V cue also showed significant difference (P=.001<.05). There existed no significant difference between the VV cues and the VS cues (P=.64>.05). The results indicated that participants could accurately recall the information shown on the notification window. The interaction effect between the “visual presentation type” and “cue dimension” also showed statistically significant difference (F=4.62, P=.01<.05).. showed that there existed significant differences among the three levels of cue dimension, i.e., VV (M=5.24, Sd=1.11)>V (M=4.64, Sd=1.48)>VS (M=4.08, Sd=1.82). Table 8 The mixed factorial ANOVA of the feeling of being satisfied with the notification Source. SS. df. MS. F. P. 1. 2.16. .51. .47. Visual presentation type 2.16 Cue dimension Visual presentation type x Cue dimension. 33.65 2 16.82 12.65 .00** .00. 2. .00. .00. Post Hoc. VS<V<VV. 1.00. ** means that P<.01 and there is statistical significance. In addition, the means were all greater than the median of 4, indicating that participants felt strong satisfaction with these three kinds of cue dimension designs. They also ranked VV cues as the most satisfactory cues. The interaction effect between the “visual presentation type” and “cue dimension” showed no statistically significant difference (F=.00, P=1.00>.05) for satisfaction. 4.2.3 Effectiveness This section requires participants to judge the feeling of the degree of effectiveness of the notification, and higher scores indicated that the notification was more effective. The results of mixed factorial ANOVA are shown in Table 9. There was no significant difference on the main effect of visual presentation type (F=.65, P=.42>.05). Nonetheless, the main effect of the cue dimension showed a significant difference (F=5.43, P=.00<.05). The result from the post hoc comparison indicated that the VV cues (M=6.00, Sd=.94) showed significant difference from the V cue (P=.005<.05). The VV cues also had significant difference from the VS cues (P=.009<.05). The V cues (M=5.46, Sd=1.28) and the VS cues (M=5.60, Sd=1.08) showed no significant difference (P=.43>.05). The mean scores were all higher than the median score of 4. Participants believed that different notification cues were effective. The VV cues had the highest degree of effectiveness. The interaction effect between the “visual presentation type” and “cue dimension” showed no statistically significant difference (F=.58, P=.56>.05) for effectiveness.. Table 10 The mixed factorial ANOVA of the recollection feeling of notification Source. Visual presentation type 6.00 Cue dimension Visual presentation type x Cue dimension. SS. df. MS. F. P. 1. 1.50. .65. .42. 7.85. 2. 3.92 5.43. .84. 2. .42. Visual presentation type 1.50 Cue dimension Visual presentation type x Cue dimension. .58. .00**. df. MS. F. 1. 6.00 1.01. P .31. 23.21 2 11.60 8.06. .00**. 13.32 2. .01*. 6.66 4.62. Post Hoc. V<VS=VV. According to Figure 4, the results indicated that participants judged that when there were only visual cues, the dynamic presentation type offered better recollection of the notification than the static type. However, with the addition of the sound or vibration cues, the static presentation type was easier to recollect than the dynamic type. 6. Static. Dynamic. 5.6. 5.56. 5.5 5. 4.68. 4.84 4.56. 4.5 4.12. 4. Table 9 The mixed factorial ANOVA of the feeling of the effectiveness of the notification Source. SS. 3.5. Post Hoc. VISION+SOUND. VISION. V IS IO N + V IBR A TIO N. Figure 3. The interaction diagram regarding the notification of information recollection. Note: The vertical axis reflects the degree of recollection, and higher scores on this measure indicated more. VS=V<VV. complete memories. The horizontal axis represents the three different cue. .56. dimensions.. 7 Journal of the Science of Design. Vol. 4 No. 2 2020. 55.
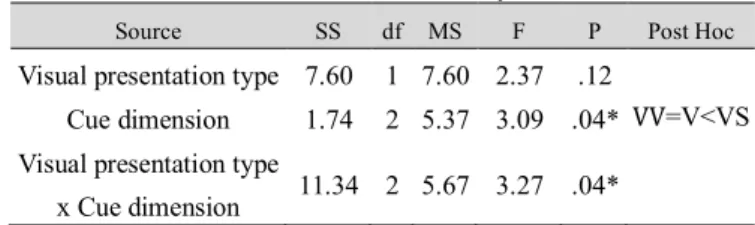
(8) they could pay more attention to static visual presentation than to dynamic types. On the contrary, a single visual notification designed with the dynamic presentation type could be better. This result is consistent with Bartram, Ware, and Calvert (2001) [1] who argued that users tend to pay more attention to dynamic motions than to static images. 5. Discussions 5.1 The effects of efficiency of task operation This experiment revealed that different notification cues combined in different ways would have a certain impact on the efficiency of users’ task operation. In the tasks, there were more steps required in task 1 (i.e., change the topic category to “popular” and follow an author) and task 4 (i.e., reply with the word “good” to a post), which means that the participants needed more clicking actions to complete these two complicated tasks. Therefore, they could not focus on the current interface status at all times, but needed to constantly recall the task requirements during the operation. Meanwhile, participants are more attracted to the dynamic visual type. The dynamic presentation type of the notification interface is another important design factor for improving the efficiency of task operation in complex tasks. It makes it easier for users to identify information and then quickly respond to the interface notification. This result is consistent with Dessart et al. (2011) [9] who suggested that animation for interface transition can reduce the interruption and cognitive interference, and can enhance the comprehensibility and trustworthiness of the interface for users. The different combinations of the cue dimensions were the important design factor for the efficiency of task operation in task 2 (i.e., archive a post) and task 3 (i.e., give a post a like). It is mainly reflected in the stimulation of auditory cues. Participants can often respond more quickly to notifications with auditory cues in simple tasks. The results verify the findings of Gaver, Smith, and O'Shea (1991) [11] who suggested that sounds are more likely to attract attention and accurately convey information. Two-dimensional cues with sound can provide better stimuli than a single visual cue in tasks 2 and 3. Among all four tasks, whether it was a combination of cues or just a single cue, the participants often preferred to respond to those with stronger stimuli, e.g., the dynamic visual presentation type stimuli were stronger than the static ones, and the sound and vision cues were stronger. This might imply that when the cue dimensions increase, it could be clearer for visual presentation. This phenomenon reflects that the different forms of cue designs would impact level 3 of the situation awareness. This result revealed similarity to the study conducted by Bezerianos, Dragicevic, and Balakrishnan (2006) [2] who suggested dynamic visual breaks can hinder participants’ understanding of additional context changes. 4.2.5 Concentration The results regarding the concentration feeling of notification are illustrated in Table 11. Table 11 The mixed factorial ANOVA analysis of concentration Source. SS. df. Visual presentation type 7.60 Cue dimension Visual presentation type x Cue dimension. 1.74. MS. F. P. Post Hoc. 1 7.60 2.37. .12. 2 5.37 3.09. .04* VV=V<VS. 11.34 2 5.67 3.27. .04*. There existed no significant difference on the main effect of visual presentation type (F=2.37, P=.12>.05). However, the main effect of the cue dimension showed significant difference (F=3.09, P=.04<.05). The results of the post hoc comparison indicated that the V cue (M=4.93, Sd=1.41) and the VS cues (M=5.50, Sd=1.59) showed significant difference (P=.026<.05). There was no significant difference between the VV cues (M=5.05, Sd=1.52) and the VS cues (P=.057>.05). In addition, the VV cues and the V cue also showed no significant difference (P=.63>.05). The mean values were all greater than the median of 4, which indicates that the participants could pay attention to all three kinds of cue dimensions. The interaction effect between the “visual presentation type” and “cue dimension” also showed statistically significant difference (F=3.27, P=.04<.05). According to Figure 5, the results indicated that the participants felt that when there were two cue dimensions, 6.5 6. Static. Dynamic. 5.96. 5.5 5 4.5. 5.33. 5.06. 5.03. 4.76. 4.8 VISON+SOUND. VISON. V IS O N + V IBR A TIO N. Figure 4 The interaction diagram regarding the. concentration. Note: Higher scores on this measure indicate that participants were more concentrated.. 8 56. Journal of the Science of Design. Vol. 4 No. 2 2020.
(9) 5.3 The emotional effects of participants The experimental results showed that the most satisfactory cue dimension for participants is tactile cues, and the least satisfactory is auditory cues. The degree of satisfaction depends on the type of stimulus cue. The stronger the interruption, the more unsatisfactory it was for the participants. Users generally have greater experience of the vibration designed together with the static presentation type of notification. Participants were not disturbed by the dynamic presentation type of stimulus, so they were more likely to be attracted by the tactile stimulus. This is consistent with the findings of Brewster et al. (2007) [4] and Hoggan et al. (2008) [13] who argue that the tactile cues used in general notifications for applications are beneficial in terms of providing feedback to the users. Similar to the findings of Vries (2013) [8] and Leiva et al. (2012) [18], the auditory notification could cause negative emotions to the users, especially the notification of the static presentation type with VS cues. Participants may amplify their sense of boredom and negative emotions with a static presentation type. Emotion is a key aspect of user experience (Park et al., 2011) [21]. A good notification cues design can bring a positive emotional experience to users.. than the other cue designs. These results confirm the attention theory proposed by Kahneman (1973) [16], who suggested that when the surrounding environment presents a large number of stimuli at the same time, human’s limited cognitive resources can only deal with some of the stronger stimuli, and others cannot be processed. In summary, the dynamic presentation type and VS cues could be important factors to help improve the efficiency of the task operation. 5.2 The effects of the situation awareness Different cue designs might impact the users' situation awareness, which caused the existence of significant differences in the task efficiency and subjective questionnaires. In the three levels of situation awareness, level 1 was related to perception, level 2 was related to comprehension, and level 3 was about projection. Compared to a single visual cue, stimuli designed with twodimensional cues are more likely to be perceived by the participants. This is consistent with the view of Tarasewich and Campbell (2004) [6] who argue that collocation of mixed dimensions can enhance stimuli and users’ perceptions and processing. When the notifications are used to deliver important messages, it is recommended to use two-dimensional cues to attract users’ attention. Level 2 is about comprehension, which includes the users’ cognition of the cues, memory of the notification content, and so on. The experimental results indicated that participants were visually affected at this level of process. The dynamic presentation type in a single visual cue is easier to cognitively process and remember than the static cue. On the other hand, the static presentation type is better when the cue dimensions are combined with auditory or tactile cues. The static visual presentation type with vibration was the most preferable to the users. This kind of notification design is easy to perceive without interruption and can help prevent users suffering from information overload. Level 3 is about projection, which affects the efficiency of the users’ decision-making response to the notification, especially when the participants were more likely to return to previous tasks quickly with auditory cues. This means that the auditory cues can help lead to a quicker response. However, the results contradict those of Czerwinski et al. (2000) [7] who suggest that sound effects could be negative, as they interrupted the participants’ work. However, in this study, the sounds made the participants quickly finish the tasks. The reason could be the difference in the notification information.. 6. Conclusions This study was conducted based on the past research studies pertinent to the design of notification cues. That is, it focuses on the impact of auditory, visual, and tactile cues designed for mobile applications. In summary, the results generated from this study indicate that: (1) The different combinations of notification dimensions affect users’ situational awareness and are reflected in the participants’ subjective preferences and notification responses. (2) The notification of VS cues may significantly improve the participants’ task efficiency compared with the V cue alone. (3) When the notifications are the VV and VS cues, the dynamic presentation of visual cues would interfere with the users’ recollection of the information. (4) VV cues could enhance the users’ overall experience. Compared with VS cues, vibration is easily perceived from the environment and is not invasive. Users considered static and vibration cues to be one of the best ways to offer notification on a mobile device. In order to increase users’ interactive experience and provide instant feedback in an appropriate way, the authors suggest a combination of tactile cues with static vision to be used by mobile applications. The static visual presentation type could make users more sensitive to the 9 Journal of the Science of Design. Vol. 4 No. 2 2020. 57.
(10) [11] Gaver, W. W., Smith, R. B., & O'Shea, T. (1991). Effective sounds in complex systems: The ARKola simulation. In proceedings of the SIGCHI Conference on Human Factors in Computing Systems. CHI, Vol.91, 85-90. [12] Hansson, R., Ljungstrand, P., & Redström, J. (2001). Subtle and public notification cues for mobile devices. In International Conference on Ubiquitous Computing. Springer, Berlin, Heidelberg, 240-246. [13] Hoggan, E., Brewster, S. A., & Johnston, J. (2008). Investigating the effectiveness of tactile feedback for mobile touchscreens. In proceedings of the SIGCHI conference on Human factors in computing systems. ACM, 1573-1582. [14] Hudson, S. E., & Smith, I. (1996). Electronic mail previews using non-speech audio. In Conference companion on Human factors in computing systems. ACM, 237-238. [15] Iqbal, S. T., & Bailey, B. P. (2008). Effects of intelligent notification management on users and their tasks. In proceedings of the SIGCHI Conference on Human Factors in Computing Systems. ACM, 93-102. [16] Kahneman, D. (1973). Attention and effort, Vol. 1063, Englewood Cliffs, NJ: Prentice-Hall. [17] Kilander, F., & Lönnqvist, P. (2001). A weakly intrusive ambient soundscape for intuitive state perception. Continuity in future computing systems, 70-74. [18] Leiva, L., Böhmer, M., Gehring, S., & Krüger, A. (2012). Back to the app: the costs of mobile application interruptions. In proceedings of the 14th international conference on human-computer interaction with mobile devices and services. ACM, 291-294. [19] McCrickard, D. S. (1999). Maintaining information awareness with Irwin. In EdMedia+ Innovate Learning. Association for the Advancement of Computing in Education (AACE), 552-557. [20] Neisser, U. (1976). Cognition and reality: Principles and implication of cognitive psychology. San Francisco, CA: WH Freeman and Company. [21] Park, D., Lee, J.-H., & Kim, S. (2011). Investigating the affective quality of interactivity by motion feedback in mobile touchscreen user interfaces. International Journal of Human-Computer Studies, 69(12), 839-853. [22] Schlienger, C., Conversy, S., Chatty, S., Anquetil, M., & Mertz, C. (2007). Improving users’ comprehension of changes with animation and sound: An empirical assessment. In proceedings of the IFIP Conference on Human-Computer Interaction. Springer, Berlin, Heidelberg, 207-220. [23] Severin, W. (1967a). Another look at cue summation. AV Communication Review, 15(3), 233-245. [24] Severin, W. (1967b). The effectiveness of relevant pictures in multiple-channel communications. AV Communication Review, 15(4), 386-401. [25] Tversky, A., & Kahneman, D. (1973). Availability: A heuristic for judging frequency and probability. Cognitive psychology, 5(2), 207-232. [26] Ware, C. (2012). Information visualization: perception for design. Elsevier.. tactile cue which helps accurately convey information and make users pay more attention to the message. The dynamic visual presentation type could make the users focus more on the screen information. Nevertheless, it is not suitable for use in designing two-dimensional cues because it may make users experience information overload. The authors suggest that the static presentation type could be better to match a two-dimensional notification which benefits an auditory cue or a tactile cue. In future studies, different contexts may be considered as a variable to help further explore the impact of different dimensional cues on users in different environments. References [1]. Bartram, L., Ware, C., & Calvert, T. (2001). Moving icons: Detection and distraction. In proceedings of the IFIP TC.13 International Conference on Human-Computer Interaction (INTERACT 2001). Tokyo, Japan. Vol.1, 157165. [2] Bezerianos, A., Dragicevic, P., & Balakrishnan, R. (2006). Mnemonic rendering: an image-based approach for exposing hidden changes in dynamic displays. In proc.UIST, ACM, 159-168. [3] Brewster, S. (2002). Overcoming the lack of screen space on mobile computers. Personal and Ubiquitous Computing, 6(3), 188-205. [4] Brewster, S., Chohan, F., & Brown, L. (2007). Tactile feedback for mobile interactions. In proceedings of the SIGCHI conference on Human factors in computing systems. ACM, 159-162. [5] Brewster, S., & King, A. (2005). An investigation into the use of tactons to present progress information. In IFIP Conference on Human-Computer Interaction. Springer, Berlin, Heidelberg, 6-17. [6] Campbell, C. S., & Tarasewich, P. (2004). Designing visual notification cues for mobile devices. In CHI'04 Extended Abstracts on Human Factors in Computing Systems. ACM, 1199-1202. [7] Czerwinski, M., Cutrell, E., & Horvitz, E. (2000). Instant messaging and interruption: Influence of task type on performance. In proceedings of the OZCHI 2000 conference. Vol. 356, pp. 361-367. [8] de Vries, R. A. J., Lohse, M., Winterboer, A., Groen, F. C., & Evers, V. (2013). Combining social strategies and workload: a new design to reduce the negative effects of task interruptions. In CHI'13 Extended Abstracts on Human Factors in Computing Systems. ACM, 175-180. [9] Dessart, C.-E., Genaro Motti, V., & Vanderdonckt, J. (2011). Showing user interface adaptivity by animated transitions. In proceedings of the 3rd ACM SIGCHI symposium on Engineering interactive computing systems. ACM, 95-104. [10] Endsley, M. R. (1988). Design and evaluation for situation awareness enhancement. In proceedings of the Human Factors Society annual meeting. Sage CA: Los Angeles, CA: SAGE Publications. Vol. 32, No. 2, 97-101.. 10 58. Journal of the Science of Design. Vol. 4 No. 2 2020.
(11)
図
+3

関連したドキュメント
Although the holonomy gives infinitely many tight contact structures up to isotopy (fixing the boundary), this turns out to be a special feature of the nonrotative case. This
Although the point data for the compressor configuration were converted to four Bezier curves; two for the flow passage at the hub and shroud, and the other two for the impeller
Standard domino tableaux have already been considered by many authors [33], [6], [34], [8], [1], but, to the best of our knowledge, the expression of the
When we have a non-homogeneous container, and we want to apply different operations (depending on the concrete type of the element) then Visitor design pattern is appropriate to
4 because evolutionary algorithms work with a population of solutions, various optimal solutions can be obtained, or many solutions can be obtained with values close to the
[11] Karsai J., On the asymptotic behaviour of solution of second order linear differential equations with small damping, Acta Math. 61
Kartsatos, The existence of bounded solutions on the real line of perturbed non- linear evolution equations in general Banach spaces, Nonlinear Anal.. Kreulich, Eberlein weak
We give a methodology to create three different discrete parametrizations of the bioreactor geometry and obtain the optimized shapes with the help of a Genetic Multi-layer
