Emission characteristics of laser-induced plasma using collinear
long and short dual-pulse LIBS
Zhenzhen Wang1,2, Yoshihiro Deguchi2,*, Renwei Liu2, 3, Akihiro Ikutomo2, Zhenzhen Zhang3, Daotong Chong1, Junjie Yan1, Jiping Liu3, Fang-Jung Shiou4
1State Key Laboratory of Multiphase Flow in Power Engineering, Xi’an Jiaotong University, Xi’an 710049, China
2Graduate School of Advanced Technology and Science, Tokushima University, Tokushima 770-8501, Japan
3Moe Key Laboratory of Thermo-Fluid Science and Engineering, Xi’an Jiaotong University, Xi'an 710049, China
4Department of Mechanical Engineering, National Taiwan University of Science and Technology, Taipei 10607, Taiwan
Corresponding author: Yoshihiro Deguchi
Graduate School of Advanced Technology and Science, Tokushima University
TEL: (+81)-88-656-7375
FAX: (+81)-88-656-9082
Email address:[email protected]
Postal address: 2-1, Minamijyosanjima, Tokushima 770-8506 Japan
Zhenzhen Wang, Yoshihiro Deguchi, Renwei Liu, Akihiro Ikutomo, Zhenzhen Zhang, Daotong Chong, Junjie Yan, Jiping Liu, Fang-Jung Shiou, Emission Characteristics of Laser-Induced Plasma Using Collinear Long and Short Dual-Pulse Laser-Induced Breakdown Spectroscopy (LIBS) , Applied Spectroscopy (Volume: 71 issue: 9) pp. 2187-2198 . Copyright © 2017 SAGE Publications. DOI: 10.1177/0003702817693239.
Abstract
The collinear long and short dual-pulse LIBS (DP-LIBS) was employed to clarify the emission characteristics from laser-induced plasma. The plasma was sustained and became stable by the long pulse-width laser with the pulse pulse-width of 60 μs under FR (free running) condition as an external energy source. Comparing the measurement results of stainless steel in air using SP-LIBS and DP-LIBS, the emission intensity was enhanced using DP-LIBS markedly. The temperature of plasma induced by DP-LIBS was maintained at higher temperature under different gate delay time and short pulse-width laser power conditions compared with these measured using SP-LIBS of short pulse width. Moreover, the variation rates of plasma temperature measured using DP-LIBS were also lower. The superior detection ability was verified by the measurement of aluminum sample in water. The spectra were clearly detected using DP-LIBS, whereas it cannot be identified using SP-LIBS of short pulse width and long pulse width. The effects of gate delay time and short pulse-width laser power were also discussed. These results demonstrate the feasibility and enhanced detection ability of the proposed collinear long and short DP-LIBS method.
Keywords: Long pulse, DP-LIBS, Enhancement, Plasma temperature stabilization, Underwater
Introduction
Laser-induced breakdown spectroscopy (LIBS) technique as a useful elemental
composition determination method has been applied in various fields, such as space
exploration, industrial processes, environment protection, food safety, etc. 1-6 due to its
advantages of fast response, high sensitivity, non-contact and multi-elemental detection.
The researches of LIBS fundamentals and applications have been extensively studied
to improve LIBS technique. Most fundamental researches focus on the signal
enhancement to improve the accuracy and detection ability of LIBS measurement, as
well as understanding of the basic plasma physics. Various papers reported the signal
enhancement by optimizing the experimental conditions to improve LIBS detection
ability, such as pulse width, laser wavelength, laser power, gate delay time,
lens-to-sample distances, atmospheric condition, etc.7-11 Some improvement approaches of
LIBS technique have also been developed, such as dual-pulse LIBS (DP-LIBS),12-15
resonance-enhanced LIBS (RE-LIBS),16,17 laser ablation fast pulse discharge plasma
spectroscopy (LA-FPDPS),18,19 microwave-assisted LIBS (MA-LIBS),20 LIBS
laser-induced fluorescence (LIBS-LIF)21 and other combination methods.
DP-LIBS is an important way to enhance the emission intensities to improve LIBS
analytical capability. The combinations of laser pulses with different pulse width, laser
wavelength and laser power have been studied. Four geometrical configurations have
been employed to realize DP-LIBS technique, such as collinear, crossed beam,
also been successfully demonstrated to enhance the emission intensity of plasma by
increasing the lifetime of plasma to a few hundred microseconds.24-26 In LIBS process,
the atomic emission signals arise in the plasma cooling process. These techniques are
conceptually similar as they employ an external energy source to sustain the plasma
and to enhance the emission intensity. In MA-LIBS, the additional microwave device
should be installed around the measurement target to cause the system complex, which
may suffer some limitations in real applications. Usually, the second laser employed in
DP-LIBS is Q-switched Nd:YAG laser. The second laser is not only to sustain the
plasma but also to induce the plasma to some extent. The plasma generation processes
become confused for analyses.
Nd:YAG-CO2 DP-LIBS using a second and long pulse of 10.6 μm CO2 laser pulse was
applied to enhance the emission signal with the crossed beam configuration.27-29
However, CO2 laser is not suitable for the long distance measurement coupling with the
optical fiber. The benefits of long pulse LIBS for underwater spectroscopy were
reported to demonstrate an improvement in the quality of the signal observed by
increasing the duration of the pulse used for ablation to 150 ns at hydrostatic pressures
between 0.1 MPa and 30 MPa.30,31 The timing of the bubble formation was examined
by irradiating the target with two different pulse widths, 150 ns long pulse as the
ablation laser and 20 ns short pulse under normal operating conditions with the
orthogonal pre-ablation configuration.32 There are several geometrical configurations
for DP-LIBS as stated above. However, the collinear configuration is much more
In this study, a new collinear long and short DP-LIBS method was proposed to improve
the detection ability and measurement accuracy by the control of the plasma cooling
process using the long pulse-width laser radiation. In this method, the laser-induced
plasma was generated by the short pulse-width laser and the external energy was
supplied by the long pulse-width laser with the pulse width of 60 μs under FR (free
running) condition, which means the Q value of optical resonant cavity does not change
during laser pulse formation, to sustain the plasma to improve the detection ability and
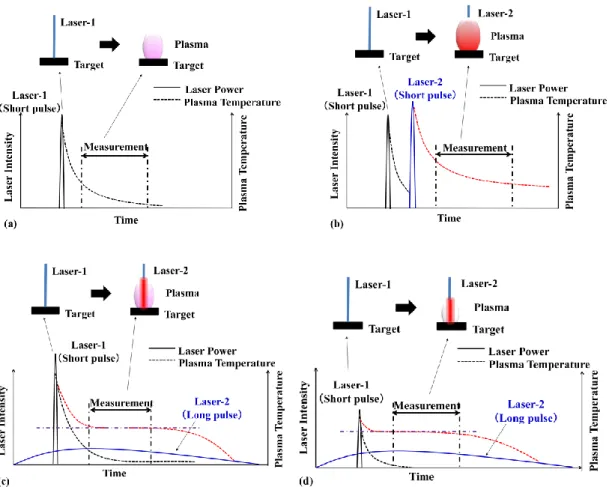
feasibility in the real applications due to its collinear configuration. Fig.1 shows the
notional comparison of laser-induced plasma processes of single-pulse LIBS (SP-LIBS),
conventional DP-LIBS and long and short DP-LIBS. The plasma temperature and
lifetime can be increased using DP-LIBS compared with SP-LIBS.33,34 The plasma
temperature is usually not uniform according to the spatial and temporal distribution.
When using the conventional DP-LIBS, as shown in Fig.1(b), the plasma temperature
can be enhanced. However, the temperature distribution is also not uniform and
fluctuates. In the case of long and short DP-LIBS, the plasma temperature can be
maintained at certain higher level along the long pulse-width laser path without obvious
undesirable effect, even if the short pulse-width laser power becomes lower, as
illustrated in Fig.1(c) and Fig.1(d). The plasma generated by the short pulse-width laser
is stabilized and maintained at high temperature during the plasma cooling process by
long pulse-width laser radiation. It is significant for laser-induced plasma processes.
1) There are the cleaning and pre-treatment effects of target surface by long
pulse-width laser radiation in condition that the short pulse-pulse-width laser, which induces the
plasma, is applied in the middle of the long pulse-width laser radiation.
2) Optical fiber delivery is easy for the long pulse-width laser radiation because peak
laser intensity is low.
3) The self-absorption effect supposed to be reduced by restricting the hot plasma
region by the long pulse-width laser radiation.
In this study, the solid samples, such as stainless steel in air and aluminum(Al) sample
in water, were analyzed using this proposed method which is the first LIBS application
to actively control and stabilize the LIBS plasma temperature temporally and spatially
using long and short DP-LIBS. The enhancement mechanism and the experimental
parameter effects were discussed to reveal the merits of this new proposed method.
Theory
The processes involved in LIBS are complex and the laser-induced plasma is not
uniform. Plasma creation and evolution processes were analyzed and clarified including
multi-photon ionization and electron impact ionization processes. Once ions are
produced by the LIBS process, laser energy is absorbed intensively and plasma grows
rapidly by electrons and the electron impact ionization process, that is, inverse
bremsstrahlung absorption. After the termination of the laser pulse, the plasma
continues expanding. Simultaneously, the three-body recombination proceeds and the
emission signals appears from this temporally and spatially non-uniform plasma. It is
often the case that the electrons, ions or neutrals in plasma are not in local
thermodynamic equilibrium (LTE) condition.35,36 These effects was also analyzed by
the theoretical model including multi-photon ionization and electron impact ionization
processes.37 On the other hand, most of the LIBS methods assume the spatially uniform
plasma and the LTE condition to calculate the quantitative elemental analyses. This
induces a decrease in the precision of LIBS quantitative analyses.
When low energy laser radiation is applied to the area of this cooling plasma, inverse
bremsstrahlung absorption by this low energy laser radiation and the recombination can
become equilibrium. Accordingly temporally and spatially uniform plasma can be
attained in this region. This theoretical model is briefly described below and the details
are shown elsewhere.37 The laser light propagation is modeled using Maxwell equations
as follows,
∇ × 𝐇 = ε𝜕𝐄
𝜕𝑡+ 𝐉 (1)
∇ × 𝐄 = −μ𝜕𝐇
𝜕𝑡 (2)
In above equations, H and E are magnetic and electric fields respectively, ε and μ are
permittivity and magnetic permeability, J is the current density because of movements
of charged particles in plasma. The evolution processes of gas phase plasma (neutral,
ion and electron) were modeled using Boltzmann equations. 37
𝜕𝑓e 𝜕𝑡 + 𝐯e∙ ∇𝑓e+ 𝐚e∙ ∇𝐯e𝑓e = − 𝑓e−𝑓en eq λen + 𝑅e𝑓e eq (3)
𝜕𝑓i 𝜕𝑡 + 𝐯i∙ ∇𝑓i+ 𝐚i∙ ∇𝐯i𝑓i = − 𝑓i−𝑓in eq λin + 𝑅i𝑓i eq (4) 𝜕𝑓n 𝜕𝑡 + 𝐯n∙ ∇𝑓n = − 𝑓n−𝑓nn eq λnn + 𝑅n𝑓n eq (5)
In equations (3) – (5), the subscript s (e, i or n) denotes the type of particles and takes
e, i or n for electrons, ions or neutrals respectively. fs is the distribution function, and
fseq is its value when the particle is in the equilibrium state. vs is the microscopic velocity,
as is acceleration of charged particles because of Lorentz force. λen, λin and λnn are
relaxation times for electron-neutral, ion-neutral and neutral-neutral collisions. feneq,
fineq and fnneq are the equilibrium distribution functions in these collisions respectively.
Rs is the number density change rate because of inelastic collisions, and it contains three
parts: Rsm by multi-photon ionization, Rsi by electron impact ionization and Rsr by
three-body recombination.
fe and fi in equations (3) – (4) are reduced rapidly after the termination of the laser pulse
because the source items of electrons and ions, i.e. Rsm and Rsi (s: e or i) become zero.
When the low energy laser radiation (long pulse-width laser) is applied to this cooling
plasma, fe and fi become quasi-equilibrium depending on the laser fluence and plasma
temperature in this region is stabilized temporally and spatially to make a uniform
plasma. It also helps to attain the LTE condition by the maintaining quasi-equilibrium
plasma condition temporally and spatially. Because LTE requires each local change
slowly enough to practically sustain its local Maxwell–Boltzmann distribution.
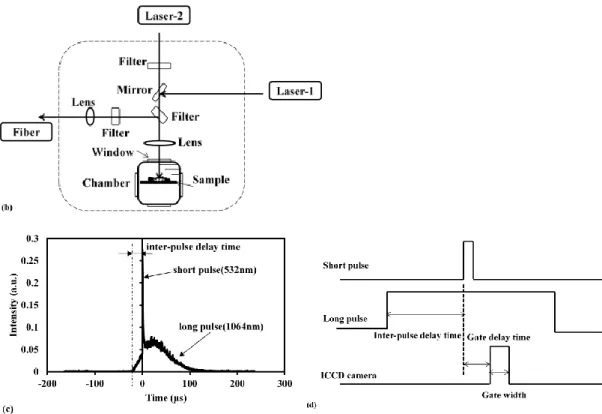
Fig.2(a) and Fig.2(b) illustrates the experimental setup of DP-LIBS consisting of two
lasers, digital delay generator, fiber, spectrometer, ICCD (Intensified Charge Coupled
Device) camera and auxiliary equipment. The nanosecond laser 1 (LOTIS TII,
LS-2134UTF, 5-8 ns, 10 Hz, beam diameter: 6 mm) was operated at 532 nm with laser
power of dozens of milli-joule and the pulse width of 5-8 ns under normal operating
conditions. The nanosecond laser 2 (LOTIS TII, LS-2137U, 6-8 ns, 10 Hz, beam
diameter: 8 mm) was operated at 1064 nm with the pulse width of 60 μs under FR (free
running) condition. Its laser power was set to 400 mJ/pulse and 500 mJ/pulse for
different experiment to stabilize and maintain the plasma. The inter-pulse delay time
between these two lasers was adjusted by the digital delay generator (Stanford Research
Systems, Model DG645) and verified by the oscilloscope (Tektronix, MDO3014).
Fig.2(c) and Fig.2(d) shows the schematic diagram of measured shapes of two pulses
and different delay time. In order to determine the inter-pulse delay time, the shape of
short and long pulse-width laser radiations were monitored at the combining point of
long and short pulse-width lasers. The gate delay time of ICCD was triggered by the
short pulse-width laser under all experimental conditions. SP-LIBS was performed by
setting either of the long or short pulse-width laser power to be zero. These two laser
beams were focused on the samples under collinear configuration using different focal
lenses. Each focal lens with focal length of 300 mm was employed for 1064 nm and
532 nm laser beams and then the focused laser beams employed collinear configuration
for stainless steel measurement in air, as shown in Fig.2(a). The optical setup for Al
employed collinear configuration and then were focused on the target using the focal
lens with focal length of 80 mm due to the necessity of higher energy density to induce
plasma for underwater measurement. Emission signals from the plasma of the
measurement samples were focused on the fiber using a focal lens with focal length of
100 mm and detected by the combination of a spectrometer (SOL, NP-250-2M), an
ICCD camera (Andor, iStar DH334T-18U-03), and auxiliary equipment. The grating of
spectrometer employed was 300 l/nm with the resolution of 0.15 nm/pixel and the
spectra range of 235nm-385nm.
Measurement results of stainless steel in air
Stainless steel in air was measured using SP-LIBS of short pulse width, SP-LIBS of
long pulse width and DP-LIBS under different conditions. Measured spectra in different
measurement conditions were shown in Fig.3. The detection features were discussed in
various inter-pulse delay time, gate delay time and short pulse-width laser power
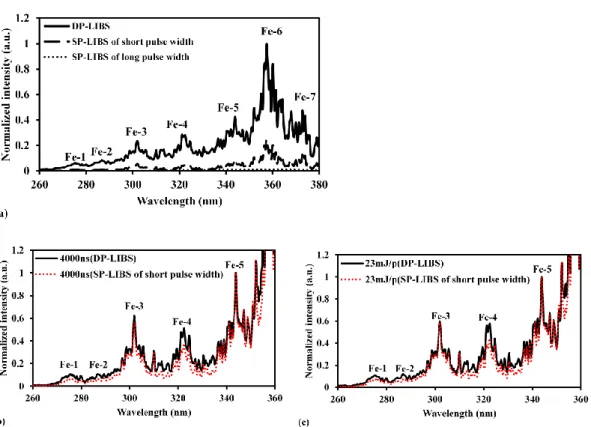
conditions. Fig.3(a) shows the comparison of measured spectra using DP-LIBS and
SP-LIBS. The signals were normalized with respect to maximum signal using
DP-LIBS. As is well known, there are numerous Fe emission lines. According to the
measurement results, several representative wavelength ranges of Fe emission were
determined. The emission intensity was summed as these wavelength ranges. In each
wavelength range, Fe specific emission lines and their corresponding parameters were
checked using the database and listed as data range in Table 1.38 In every Fe wavelength
The data range of upper level energy and Einstein A coefficient were listed in Table 1
for the conspicuous and representative Fe emission line groups in each Fe wavelength
range. The distinct spectra were observed when using SP-LIBS of short pulse width and
DP-LIBS, whereas the spectra cannot be identified from SP-LIBS measurement of long
pulse width. It is recognized that the long pulse-width laser was unable to make plasma
to generate LIBS signals. It can also be seen that the emission intensity was enhanced
obviously when using DP-LIBS. In LIBS process, the core of plasma is first produced
by the absorption of the incident laser energy. Once the initial free electrons are
produced, laser photons are also absorbed through inverse bremsstrahlung absorption
to induce rapid expansion of plasma. When introducing the external energy from the
long pulse-width laser during the plasma cooling process, the inverse bremsstrahlung
absorption can appear37 in this process to maintain the plasma at higher and constant
temperature. It also extends the plasma lifetime. Therefore the emission intensity from
plasma can be improved. In order to clarify this phenomenon, the detection ability and
features between SP-LIBS of short pulse width and DP-LIBS were evaluated under
various experimental conditions, such as inter-pulse delay time, gate delay time and
short pulse-width laser power.
The measured spectra using SP-LIBS of short pulse width and DP-LIBS were compared
and discussed in detail under a specific condition. Fig.3(b) shows the measured spectra
in gate delay time of 4000 ns using SP-LIBS of short pulse width and DP-LIBS. The
signals were normalized with respect to signal of Fe-5 using SP-LIBS and
the emission lines of Fe-1, Fe-2 and Fe-4 were enhanced more compared with other
signals using DP-LIBS. Fe-1, Fe-2 and Fe-4 emission signals are attributed to those
from higher upper level energy compared with other emissions. The absolute emission
intensity of Fe lines was enhanced obviously when using DP-LIBS as shown in Fig.3(a).
Fig.3(c) shows the measured spectra using SP-LIBS of short pulse width and DP-LIBS
at short pulse-width laser power of 23 mJ/pulse. The signals were normalized with
respect to signal of Fe-5 using SP-LIBS and DP-LIBS, respectively. When
comparing the measured spectra at the same short pulse-width laser power, the emission
lines with higher upper level energy, such as Fe-1, Fe-2 and Fe-4, displayed the
enhanced emission signals using DP-LIBS. The quantitative analyses of various
parameters were discussed as follows.
Effect of inter-pulse delay time
The inter-pulse delay time between two lasers is an important parameter for DP-LIBS.
The stainless steel in air was measured using DP-LIBS in different inter-pulse delay
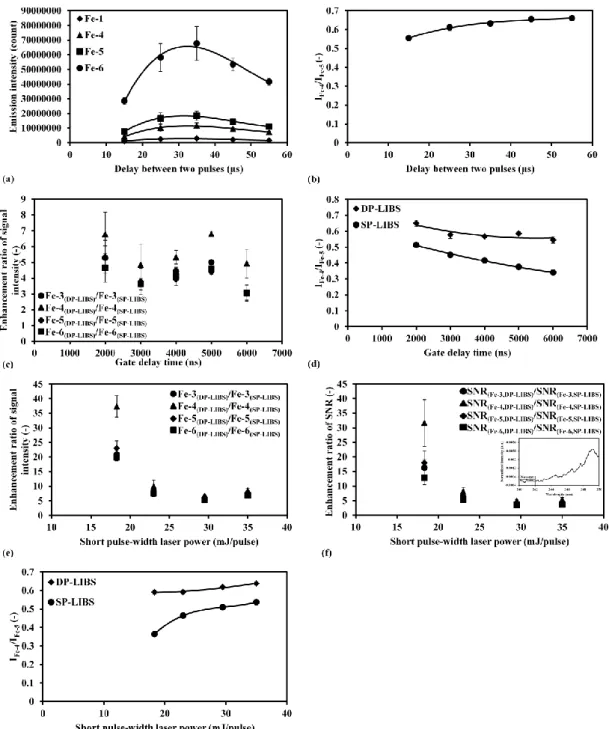
time. Fig.4(a) shows the inter-pulse delay time dependence of several Fe emission
signals. The emission intensity increased first and then decreased when increasing the
inter-pulse delay time, which shows the similar profile to the long pulse-width laser
shape. This result agrees to the long pulse-width laser function. It is demonstrated that
the long pulse-width laser does not make plasma to generate LIBS signals and just
sustains the plasma induced by the short pulse-width laser in high temperature condition.
The time scale of plasma generation and growth processes is usually tens of
atom with different upper level energy can be employed as the temperature indicator to
discuss the detection features. The emission intensity ratio of Fe-4 to Fe-5 (IFe-4/IFe-5)
was used to evaluate the inter-pulse delay time effect, as shown in Fig.4(b). When
increasing the inter-pulse delay time, IFe-4/IFe-5 increased slightly. It is demonstrated that
the plasma temperature can be maintained at certain level. The atomic emission signals
arise in the plasma cooling process, which is very essential for signal detection.
Therefore, the inter-pulse delay time between two lasers affects the conservation of
plasma temperature during the plasma cooling process to sustain the atomic emission
signals. The optimal inter-pulse delay time to sustain the plasma was determined
according to these measurement results. Consequently, the effects of gate delay time
and short pulse-width laser power were evaluated to compare the detection ability of
SP-LIBS of short pulse width and DP-LIBS in inter-pulse delay time of 25 μs.
Gate delay time effect of SP-LIBS and DP-LIBS
The stainless steel in air was measured using SP-LIBS of short pulse width and
LIBS in different gate delay time. The enhancement ratio of signal intensity using
DP-LIBS compared with that using SP-DP-LIBS of short pulse width was shown in Fig.4(c).
When comparing the enhancement ratios of Fe-3, Fe-4, Fe-5 and Fe-6 in different gate
delay time, Fe-4 was enhanced notably because of its higher upper level energy. The
emission intensity from upper levels with higher energy is more sensitive to plasma
temperature compared with that with lower energy. IFe-4/IFe-5 was employed to compare
the measurement results using SP-LIBS of short pulse width and DP-LIBS, as shown
SP-LIBS of short pulse width, which means the plasma temperature was maintained at
higher temperature using DP-LIBS. When increasing the gate delay time, the intensity
ratios decreased. One reason for this is the different upper level energy of each emission
line. The emission intensity of Fe-4 presented a relatively quick decline as increasing
the gate delay time due to emission lines with higher upper level energies compared
with the emission lines of Fe-5. Additionally, the decrease rate of DP-LIBS was lower
compared with that using SP-LIBS of short pulse width. When employing the long
pulse-width laser to sustain the plasma, the plasma decay was deferred to extend the
plasma lifetime. This effect was valid more than 6000 ns under these experimental
conditions.
Short pulse-width laser power effect of SP-LIBS and DP-LIBS
The plasma was induced by the short pulse-width laser when using long and short
DP-LIBS. The short pulse-width laser power effect on emission signals was discussed in
gate delay time of 2000 ns. The enhancement ratio of signal intensity using DP-LIBS
compared with that using SP-LIBS of short pulse width was shown in Fig.4(e). The
emission signals were improved obviously using DP-LIBS, especially at lower short
pulse-width laser power. The signal to noise ratio (SNR) was also compared at different
short-pulse width laser power between DP-LIBS and SP-LIBS. The signal intensity (S)
was defined as the peak of each wavelength range. The noise (N) was the standard
deviation of emission intensity around 240nm-242nm. The reason for the wavelength
range of noise was that the emission signals can be observed between 245nm-385nm.
the enhancement ratio of signal intensity. In the same condition, the enhancement ratio
of SNR was slightly lower than that of the enhancement ratio of signal intensity. When
employing DP-LIBS, the noise increased slightly, whereas, the emission signals were
improved obviously. The plasma temperature can be maintained stable at higher
temperature level, which mainly contributed to the signal emission intensity.
IFe-4/IFe-5 using DP-LIBS was higher than that using SP-LIBS of short pulse width, as
shown in Fig.4(g). It is also demonstrated that the higher plasma temperature using
DP-LIBS was attained, which shows the consistent results with the gate delay time effect.
IFe-4/IFe-5 increased with increase in the short pulse-width laser power. Because Fe-4
with its higher upper level energy showed a relatively quick increase as increasing the
short pulse-width laser power compared with the emission intensity of Fe-5. Comparing
IFe-4/IFe-5 between SP-LIBS and DP-LIBS, IFe-4/IFe-5 by DP-LIBS was almost constant.
The plasma was sustained by the long pulse-width laser radiation as an external energy
without obvious undesirable effects. This means that long and short DP-LIBS can
control the plasma at cooling process to be insensitive to the initial plasma generation
process and stabilize the plasma emission condition of LIBS measurement period. This
feature is one of the merits of long and short DP-LIBS.
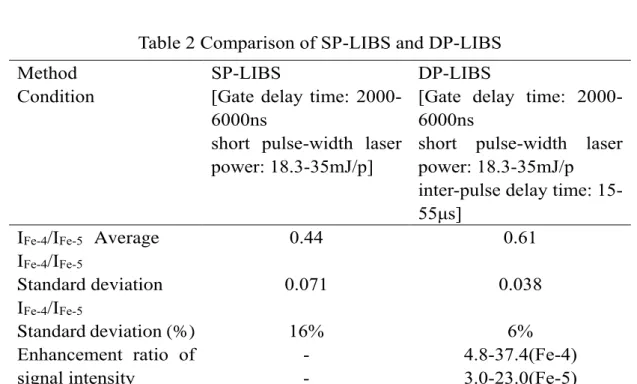
It is worth noting that, comparing the measurement results in Fig.4(b), Fig.4(d) and
Fig.4(g), IFe-4/IFe-5 presents the averaged value of 0.44 using SP-LIBS and 0.61 using
DP-LIBS under various conditions, as listed in Table 2. It is demonstrated that the
temperature was maintained at certain higher temperature level even if under various
sustained by the long pulse and became stable. The signal emission intensity was
enhanced obviously using DP-LIBS compared with that using SP-LIBS. For example,
the enhancement ratios of Fe-4 and Fe-5 were 4.8-37.4 and 3.0-23.0 under different
gate delay time and short pulse-width laser power conditions.
Measurement results of Al sample in water
LIBS detection ability for stainless steel measurement in air was improved using the
proposed DP-LIBS method. The lifetime of plasma was extended when employing the
long pulse-width laser to sustain the plasma. The difficulty for underwater measurement
is the short lifetime of plasma. Therefore, the Al sample in water was also measured
using this method under various experimental conditions to verify its superior detection
ability.
Comparison of Al sample in air and water
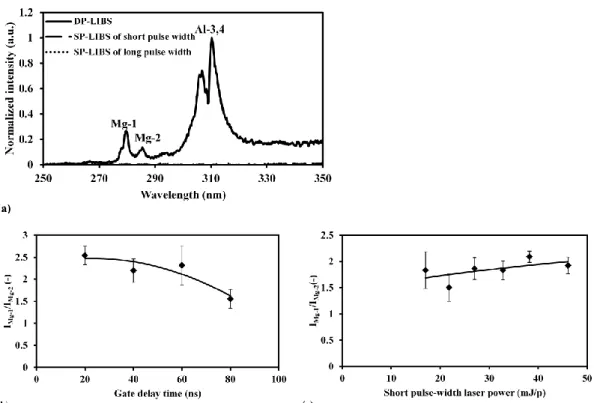
An Al sample in air was measured first using SP-LIBS of short pulse width in different
gate delay time to identify the detectable emission lines from Al sample, as shown in
Fig.5(a) in gate delay time of 200 ns. The emission lines from Al samples and the
self-absorption effect of Al lines have been investigated by experimental analyses of LIBS
spectra in some papers,40,41 which demonstrate the corresponding measured spectral
lines in this study. The spectral parameters of different observed lines of Al sample are
listed in Table 3.38,42-46 The emission intensity ratio of Mg-1 to Mg-2 (I
Mg-1/IMg-2) was
employed to evaluate its emission features. Fig.5(b) shows the gate delay time
Theoretical dependence of IMg-1/IMg-2 on plasma temperature is shown in Fig.5(c).38 I
Mg-1/IMg-2 was normalized at 2000 K to compare the tendency of IMg-1/IMg-2 dependence on
plasma temperature. IMg-1/IMg-2 increased rapidly at higher temperature, which is
consistent with the experimental result.
Fig.6(a) shows the comparison of Al sample measurement results in water using
SP-LIBS and DP-SP-LIBS. The signals were normalized with respect to maximum signal
using DP-LIBS. The spectra were recognized using neither SP-LIBS of short pulse
width nor SP-LIBS of long pulse width. However, the distinguishable emission lines
were detected using DP-LIBS. It demonstrates the feasibility for underwater
measurement. According to the measurement results of DP-LIBS in different
inter-pulse delay time, the optimal inter-inter-pulse delay time was set in 25 μs.
Al sample measurement in water using DP-LIBS
An Al sample in water was measured in different gate delay time using DP-LIBS. The
lifetime of plasma under water is shorter than that in air. The gate delay time employed
here was set to be less than 100 ns. Fig.6(b) shows the gate delay time dependence of
IMg-1/IMg-2 using DP-LIBS. When increasing the gate delay time, IMg-1/IMg-2 decreased.
The results can be explained by the fact that the ionic emission line of Mg-1 decreased
faster compared with the atomic emission line of Mg-2 when increasing the gate delay
time, which means the decrease of plasma temperature. The Al sample was also
measured under different long pulse-width laser power. Distinguishable Al signals by
until the gate delay times of 50, 80, and 120 ns, respectively. It is considered that the
continuance of plasma in water depends on the long pulse-width laser energy density.
The effect of short pulse-width laser power on emission signal using DP-LIBS was also
investigated in gate delay time of 40 ns. The short pulse-width laser power dependence
of IMg-1/IMg-2 was shown in Fig.6(c). When increasing the short pulse-width laser power,
IMg-1/IMg-2 increased slightly. Because the plasma can be sustained by the long
pulse-width laser as the external energy using DP-LIBS according to the above results, the
emission intensity was not sensitive to the short pulse-width laser energy, which shows
the stabilization of the plasma condition using DP-LIBS. The measurement results
demonstrate the feasibility of DP-LIBS for LIBS measurements in water.
Conclusions
A new collinear long and short DP-LIBS method was proposed in this study. The
external energy source was supplied by the long pulse-width laser with the pulse width
of 60 μs under FR (free running) condition to sustain the plasma. The plasma became
stable and it was maintained at higher temperature to improve LIBS detection ability
and feasibility for applications. The stainless steel in air and Al sample in water were
measured using the proposed DP-LIBS method to evaluate its detection features.
The emission intensity of stainless steel measurement in air was enhanced using
DP-LIBS compared with that using SP-DP-LIBS of short pulse width. However, the long
pulse-width laser was unable to make plasma to generate LIBS signals using SP-LIBS of long
discussed to compare the detection features of SP-LIBS of short pulse width and
DP-LIBS. Because the plasma was sustained by the long pulse-width laser as an external
energy source, the temperature of plasma induced by DP-LIBS was maintained at
higher temperature and became stable under various conditions, such as inter-pulse
delay time, gate delay time and short pulse-width laser power. In the case of Al sample
measurement in water, the spectra can be distinguished using DP-LIBS, whereas, the
spectra cannot be identified using SP-LIBS of short pulse width and long pulse width.
The gate delay time effect and short pulse-width laser power effect were also discussed.
The measurement results verify the applicability of DP-LIBS for LIBS measurements
in water. These results presented here demonstrate the feasibility and detection
Acknowledgements
This work was supported by National Natural Science Foundation of China (No.
51506171, 51436006), the National Key Basic Research Development Plan (No.
2015CB251504), Postdoctoral Science Foundation of China (No. 2015M582655) and
the joint research fund between Tokushima University and National Taiwan University
References
[1] J.B. Sirven, B. Salle, P. Mauchien, J.L. Lacour, S. Maurice, G. Manhes. “Feasibility
Study of Rock Identification at the Surface of Mars by Remote Laser-Induced
Breakdown Spectroscopy and Three Chemometric Methods”. J. Anal. At.
Spectrom. 2007. 22(12): 1471-1480.
[2] Z.Z. Wang, Y. Deguchi, M. Kuwahara, T. Taira, X.B. Zhang, J.J. Yan, J.P. Liu, H.
Watanabe, R. Kurose. “Quantitative Elemental Detection of Size-Segregated
Particles using Laser-Induced Breakdown Spectroscopy”. Spectrochim. Acta Part
B. 2013. 87: 130-138.
[3] S. Kashiwakura, K. Wagatsuma. “Rapid Sorting of Stainless Steels by Open-Air
Laser-Induced Breakdown Spectroscopy with Detecting Chromium, Nickel, and
Molybdenum”. ISIJ Int. 2015. 55(11): 2391-2396.
[4] R. Noll. Laser-Induced Breakdown Spectroscopy: Fundamentals and Applications.
Germany: Springer, 2012.
[5] M.Y. Yao, L. Huang, J.H. Zheng, S.Q. Fan, M.H. Liu. “Assessment of Feasibility
in Determining of Cr in Gannan Navel Orange Treated in Controlled Conditions
by Laser Induced Breakdown Spectroscopy”. Opt. Laser Technol. 2013. 52: 70-74.
[6] D.W. Hahn, N. Omenetto. “Laser-Induced Breakdown Spectroscopy (LIBS), Part
II: Review of Instrumental and Methodological Approaches to Material Analysis
and Applications to Different Fields”. Appl. Spectrosc. 2012. 66(4): 347-419.
[7] Z.Z. Wang, Y. Deguchi, J.J. Yan, J.P. Liu. “Comparison of the Detection
and Laser Breakdown Time-of-Flight Mass Spectrometry”. Sensors. 2015. 15:
5982-6008.
[8] Z.Z. Wang, Y. Deguchi, M. Kuwahara, J.J. Yan, J.P. Liu. “Enhancement of
Laser-Induced Breakdown Spectroscopy (LIBS) Detection Limit using a Low-Pressure
and Short-Pulse Laser-Induced Plasma Process”. Appl. Spectrosc. 2013. 67(11):
1242-1251.
[9] Y. Zhang, Y.H. Jia, J.W. Chen, X.J. Shen, L. Zhao, C. Yang, Y.Y. Chen, Y.H. Zhang,
P.C. Han. “Study on Parameters Influencing Analytical Performance of
Laser-Induced Breakdown Spectroscopy”. Front. Phys. 2012. 7(6): 714-720.
[10] S. Abdulmadjid, M.M. Suliyanti, K.H. Kurniawan, T.J. Lie, M. Pardede, R. Hedwig,
K. Kagawa, M.O. Tjia. “An Improved Approach for Hydrogen Analysis in Metal
Samples using Single Laser-Induced Gas Plasma and Target Plasma at Helium
Atmospheric Pressure”. Appl. Phys. B. 2006. 82: 161-166.
[11] M. Marpaung, Z.S. Lie, H. Niki, K. Kagawa, K.I. Fukumoto, M. Ramli, S.N.
Abdulmadjid, N. Idris, R. Hedwig, M.O. Tjia, M. Pardede, M.M. Suliyanti, E.
Jobiliong, K.H. Kurniawan. “Deuterium Analysis in Zircaloy using ps
Laser-Induced Low Pressure Plasma”. J. Appl. Phys. 2011. 110: 063301-1-063301-6.
[12] J. Uebbing, J. Brust, W. Sdorra, F. Leis, K. Niemax. “Reheating of a
Laser-Produced Plasma by a Second Pulse Laser”. Appl. Spectrosc. 1991. 45(9):
1419-1423.
[13] G. Cristoforetti, S. Legnaioli, V. Palleschi, A. Salvetti, E. Tognoni.
Ambient Gas Pressures by Spectrally- and Time-Resolved Imaging”. Appl. Phys.
2005. 80: 59-568.
[14] J. Scaffidi, W. Pearman, J.C. Carter, S.M. Angel. “Observations in Collinear
Femtosecond–Nanosecond Dual-Pulse Laser-Induced Breakdown Spectroscopy”.
Appl Spectrosc. 2006. 60(1): 65-71.
[15] Y. Lu, V. Zorba, X.L. Mao, R. Zheng, R.E. Russo. “UV fs–ns Double-Pulse Laser
Induced Breakdown Spectroscopy for High Spatial Resolution Chemical Analysis”.
J. Anal. At. Spectrom. 2013. 28: 743-748.
[16] W.L. Yip, N.H. Cheung. “Analysis of Aluminum Alloys by Resonance-Enhanced
Laser-Induced Breakdown Spectroscopy: How the Beam Profile of the Ablation
Laser and the Energy of the Dye Laser Affect Analytical Performance”.
Spectrochim. Acta Part B. 2009. 64: 315-322.
[17] C. Goueguel, S. Laville, F. Vidal, M. Sabsabi, M. Chaker. “Investigation of
Resonance-Enhanced Laser-Induced Breakdown Spectroscopy for Analysis of
Aluminium Alloys”. J. Anal. At. Spectrom. 2010. 25: 635-644.
[18] W.D. Zhou, X.J. Su, H.G. Qian, K.X. Li, X.F. Li, Y.L. Yu, Z.J. Ren. “Discharge
Character and Optical Emission in a Laser Ablation Nanosecond Discharge
Enhanced Silicon Plasma”. J. Anal. At. Spectrom. 2013. 28: 702-710.
[19] M. Vinić, M. Ivković. “Spatial and Temporal Characteristics of Laser Ablation
Combined with Fast Pulse Discharge”. IEEE Trans. Plasma Sci. 2014. 42(10):
[20] K. Ali, M. Tampo, K.Akaoka, M. Miyabe, I. Wakaida. “Enhancement of LIBS
Emission using Antenna-Coupled Microwave”. Opt. Express. 2013. 21(24):
29755-29768.
[21] H. Loudyi, K. Rifaï, S. Laville, F. Vidal, M. Chaker, M. Sabsabi. “Improving
Laser-Induced Breakdown Spectroscopy (LIBS) Performance for Iron and Lead
Determination in Aqueous Solutions with Laser-Induced Fluorescence (LIF)”. J.
Anal. At. Spectrom. 2009. 24: 1421-1428.
[22] D. Giacomo, M. Dell'Aglio, O.D. Pascale, M. Capitelli. “From Single Pulse to
Double Pulse ns-Laser Induced Breakdown Spectroscopy Under Water: Elemental
Analysis of Aqueous Solutions and Submerged Solid Samples”. Spectrochim. Acta
Part B. 2007. 62: 721-738.
[23] V.I. Babushok, F.C. DeLucia Jr., J.L. Gottfried, C.A. Munson, A.W. Miziolek.
“Double Pulse Laser Ablation and Plasma: Laser Induced Breakdown
Spectroscopy Signal Enhancement”. Spectrochim. Acta Part B. 2006. 61: 999-1014.
[24] M. Tampo, M. Miyabe, K. Akaoka, M. Oba, H. Ohba, Y. Maruyama, I. Wakaida.
“Enhancement of Intensity in Microwave-Assisted Laser-Induced Breakdown
Spectroscopy for Remote Analysis of Nuclear Fuel Recycling”. J. Anal. At.
Spectrom. 2014. 29: 886-892.
[25] Y. Liu, B. Bousquet, M. Baudelet, M. Richardson. “Improvement of the Sensitivity
for the Measurement of Copper Concentrations in Soil by Microwave-Assisted
Laser-Induced Breakdown Spectroscopy”. Spectrochim. Acta Part B. 2012. 73:
[26] M. Wall, Z.W. Sun, Z.T. Alwahabi. “Quantitative Detection of Metallic Traces in
Water-Based Liquids by Microwave-Assisted Laser-Induced Breakdown
Spectroscopy”. Opt. Express. 2016. 24(2): 1507-1517.
[27] D.K. Killinger, S.D. Allen, R.D. Waterbury, C. Stefano, E.L. Dottery.
“Enhancement of Nd:YAG LIBS Emission of a Remote Target using a
Simultaneous CO2 Laser Pulse”. Opt. Express. 2007. 15(20): 12905-12915.
[28] A. Pal, R.D. Waterbury, E.L. Dottery, D.K. Killinger. “Enhanced Temperature and
Emission from a Standoff 266 nm Laser Initiated LIBS Plasma using a
Simultaneous 10.6 μm CO2 Laser Pulse”. Opt. Express. 2009. 17(11): 8856-8870.
[29] M. Weidman, M. Baudelet, S. Palanco, M. Sigman, P.J. Dagdigian, M. Richardson.
“Nd:YAG-CO2 Double-Pulse Laser Induced Breakdown Spectroscopy of Organic
Films”. Opt. Express. 2010. 18(1): 259-266.
[30] B. Thornton, T. Sakka, T. Masamura, A. Tamura, T. Takahashi, A. Matsumoto.
“Long-Duration Nano-second Single Pulse Lasers for Observation of Spectra from
Bulk Liquids at High Hydrostatic Pressures”. Spectrochim. Acta Part B. 2014. 97:
7-12.
[31] T. Sakka, H. Oguchi, S. Masai, K. Hirata, Y.H. Ogata, M. Saeki, H. Ohba. “Use of
a Long-Duration ns Pulse for Efficient Emission of Spectral Lines from the Laser
Ablation Plume in Water”. Appl. Phys. Lett. 2006. 88: 061120-1-061120-3.
[32] T. Sakka, A. Tamura, A. Matsumoto, K. Fukami, N. Nishi, B. Thornton. “Effects
of Pulse Width on Nascent Laser-Induced Bubbles for Underwater Laser-Induced
[33] M.L. Snyder, J. Scaffidi, S.M. Angel, A.P.M. Michel, A.D. Chave.
“Sequential-Pulse Laser-Induced Breakdown Spectroscopy of High-Pressure Bulk Aqueous
Solutions”. Appl Spectrosc. 2007. 61(2): 171-176.
[34] J. Register, J. Scaffidi, S.M. Angel. “Direct Measurements of Sample Heating by a
Laser-Induced Air Plasma in Pre-Ablation Spark Dual-Pulse Laser-Induced
Breakdown Spectroscopy (LIBS)”. Appl Spectrosc. 2012. 66(8): 869-874.
[35] M. Skočić, S. Bukvić “Laser Induced Plasma Expansion and Existence of Local
Thermodynamic Equilibrium”.Spectrochim. Acta Part B. 2016. 125: 103-110.
[36] O. Barthelemy, J. Margot, S. Laville, F. Vidal, M. Chaker, B. Le Drogoff, T.W.
Johnston, M. Sabsabi. “Investigation of the State of Local Thermodynamic
Equilibrium of a Laser-Produced Aluminum Plasma”. Appl Spectrosc. 2005. 59(4):
529-536.
[37] X.B. Zhang, Y. Deguchi, J.P. Liu. “Numerical Simulation of Laser Induced Weakly
Ionized Helium Plasma Process by Lattice Boltzmann Method.” Jpn. J. Appl. Phys.
2012. 51: 01AA04.
[38] R. Payling, P. Larkins. Optical Emission Lines of the Elements. New York: John
Wiley & Sons, 2000.
[39] X.L. Mao, X.Z. Zeng, S.B. Wen, R.E. Russo. “Time-Resolved Plasma Properties
for Double Pulsed Laser-Induced Breakdown Spectroscopy of Silicon”.
[40] F. Rezaei, S.H. Tavassoli. “Quantitative Analysis of Aluminum Samples in He
Ambient Gas at Different Pressures in a Thick LIBS Plasma”. Appl. Phys. B. 2015.
120: 563-571.
[41] J.M. Li, L.B. Guo, C.M. Li, N. Zhao, X.Y. Yang, Z.Q. Hao, X.Y. Li, X.Y. Zeng,
Y.F. Lu. “Self-Absorption Reduction in Laser-Induced Breakdown Spectroscopy
using Laser-Stimulated Absorption”. Opt. Lett. 2015. 40(22): 5224-5226.
[42] F. Paschen. “Erweiterung Der Spektren Al II, Mg I, Be I und Al I”. Ann. Phys. 1932.
404: 509-527.
[43] K.B.S. Eriksson, H.B.S. Isberg. “The Spectrum of Atomic Aluminium, Al I”. Ark.
Fys. 1963. 23: 527-542.
[44] P. Risberg. “The Spectrum of Singly-Ionized Magnesium, Mg II.” Ark. Fys. 1955.
9: 483-494.
[45] G. Risberg. “The Spectrum of Atomic Magnesium, Mg I”. Ark. Fys. 1965. 28:
381-395.
[46] G. Shenstone. “The First Spectrum of Copper (Cu I)”. Philos. Trans. R. Soc.
Table 1 Fe specific emission lines38
Element Wavelength range (nm)
Upper level energy (cm-1) A (108 s-1)
Fe-1 270-281 35611.62-38858.96 0.15-9.10 Fe-2 281-290 35379.21-36079.37 0.12-0.27 Fe-3 295-309 33095.94-34547.21 0.14-1.10 Fe-4 317-327 31307.24-32133.99 0.06-0.22 42532.73-44411.15 0.95-4.70 Fe-5 340-350 29056.32-29732.73 0.08-0.27 Fe-6 350-368 27166.82-29056.32 0.01-0.18 34782.41-40894.98 0.18-6.40 Fe-7 370-375 26874.55-27666.35 0.05-0.16 33695.39-34692.14 0.22-0.90
Table 2 Comparison of SP-LIBS and DP-LIBS
Method SP-LIBS DP-LIBS
Condition [Gate delay time: 2000-6000ns
short pulse-width laser power: 18.3-35mJ/p]
[Gate delay time: 2000-6000ns
short pulse-width laser power: 18.3-35mJ/p inter-pulse delay time: 15-55μs]
IFe-4/IFe-5 Average 0.44 0.61
IFe-4/IFe-5 Standard deviation 0.071 0.038 IFe-4/IFe-5 Standard deviation (%) 16% 6% Enhancement ratio of signal intensity - - 4.8-37.4(Fe-4) 3.0-23.0(Fe-5)
Element Wavelength (nm)
Upper level energy (cm-1) A (108 s-1)
Al-1(I) 257.51 38933.97 0.28,38 0.3642 Al-2(I) 266.04 37689.41 0.26,38 0.2842 Al-3(I) 308.22 32435.45 0.63,38 0.5943 Al-4(I) 309.27 32436.80 0.74,38 0.7343 Mg-1(II) 279.55 35760.88 2.60,38,44 280.27 35669.31 2.60,38 2.5744 Mg-2(I) 285.21 35051.26 4.90,38 4.9145 Cu(I) 324.75 30783.70 1.40,38,46 327.40 30535.32 1.40,38 1.3846
Fig. 1 Laser-induced plasma processes of single-pulse LIBS (SP-LIBS), conventional DP-LIBS and long and short DP-LIBS. (a) SP-LIBS; (b) Conventional DP-LIBS; (c) Long and short DP-LIBS with higher short pulse-width laser power; (d) Long and short DP-LIBS with lower short pulse-pulse-width laser power.
Fig. 2 Experimental setup of DP-LIBS. (a) Schematic diagram of DP-LIBS for stainless steel measurement in air; (b) Optical setup for Al sample measurement in water; (c) Pulse shapes and delay time between two pulses; (d) Different delay time.
Fig. 3 Measured spectra of stainless steel in air under different conditions. (a) Comparison of SP-LIBS and DP-LIBS at short pulse-width(532 nm) laser power of 29.5 mJ/pulse and in gate delay time of 2000 ns. (b) Measured spectra using SP-LIBS of short pulse width and DP-LIBS in gate delay time of 4000 ns and at short pulse-width(532 nm) laser power of 29.5 mJ/pulse; (c) Measured spectra using SP-LIBS of short pulse width and DP-LIBS at short pulse-width laser power of 23 mJ/pulse and in gate delay time of 2000 ns. Conditions: long pulse-width(1064 nm) laser power: 400 mJ/pulse, inter-pulse delay time: 25 μs, gate width: 1000 ns.
Fig. 4 Effect of different parameters on emission signals. (a) Inter-pulse delay time dependence of several Fe emission signals; (b) Inter-pulse delay time dependence of IFe-4/IFe-5. Conditions: short pulse-width(532 nm) laser power:
29.5 mJ/pulse, long pulse-width(1064 nm) laser power: 400 mJ/pulse, gate delay time: 2000 ns, gate width: 1000 ns. (c) Enhancement ratio of signal intensity using DP-LIBS and SP-LIBS of short pulse width in different gate delay time; (d) Emission intensity ratio of Fe-4 to Fe-5 in different gate delay time. Conditions: short width(532 nm) laser power: 29.5 mJ/pulse, long pulse-width(1064 nm) laser power: 400 mJ/pulse, inter-pulse delay time: 25 μs, gate width: 1000 ns. (e) Enhancement ratio at different short pulse-width laser power; (f) Enhancement ratio of signal to noise ratio(SNR); (g) Emission intensity ratio of Fe-4 to Fe-5 at different short width laser power. Conditions: long
pulse-width(1064 nm) laser power: 400 mJ/pulse, gate delay time: 2000 ns, inter-pulse delay time: 25 μs, gate width: 1000 ns.
Fig.5 Measurement result of Al sample in air using SP-LIBS of short pulse width in different gate delay time. (a) Measured spectra in gate delay time of 200 ns; (b) Gate delay time dependence of IMg-1/IMg-2. Conditions: short pulse-width(532
nm) laser power: 12.2 mJ/pulse, gate width: 1000 ns. (c) The dependence of normalized IMg-1/IMg-2 on plasma temperature38. IMg-1/IMg-2 was normalized at
Fig. 6 Measurement results of Al sample in water under different conditions. (a) Comparison of SP-LIBS and DP-LIBS at short pulse-width(532 nm) laser power of 46.1 mJ/pulse and in gate delay time of 20 ns; (b) Gate delay time dependence of IMg-1/IMg-2 at short pulse-width(532 nm) laser power of 46.1 mJ/pulse; (c) Short
pulse-width laser power dependence of IMg-1/IMg-2 in gate delay time of 40 ns.
Conditions: long pulse-width(1064 nm) laser power: 500 mJ/pulse, inter-pulse delay time: 25 μs, gate width: 20 ns.