85
Original Article
Determination of Polychlorinated Naphthalenes in Landfill
Leachates and its Removal in Wastewater Treatment Processes
Koji Ito, Hiroshi Kameoka, Junko Ono, Arisa Banno, Yoshinori Yabuki Research Institute of Environment, Agriculture and Fisheries, Osaka Prefecture, Habikino, Japan ABSTRACT
Di-through octachlorinated naphthalenes (DiCNs, TrCNs, TeCNs, PeCNs, HxCNs, HpCNs and OcCN) in landfill leachates can be analyzed with the same cleanup procedure as dioxins. In this study, a modified method was developed by confirming the elution order of each isomer of polychlorinated naphthalenes (PCNs) in a chromatogram of a gas chromatograph/high resolution mass spectrometer (GC/HRMS) using an Rh-12 ms capillary column, which is mainly employed for the analysis of dioxins. Using this method, PCNs in landfill leachate samples and treated leachate samples from each corresponding wastewater treatment process were quantified. PCN concentrations in landfill leachates ranged from 8.0–12,000 pg/L, and DiCNs-PeCNs were detected in almost all samples. Removal of PCNs by flocculation and active carbon treatment was greater than that achieved by activated sludge treatment in wastewater treatment plants. Furthermore, by changing the temperature of the H2SO4
coated silica gel column in the modified method, it became possible to measure monochlorinated naphthalenes (MoCNs), which could not be measured previously. MoCN concentrations detected were much higher compared to concentrations of DiCNs-OcCN in most of landfill leachates. Unlike PCNs, MoCNs are not POPs, but they are nevertheless important for understanding the properties of landfill leachates.
Keywords: polychlorinated naphthalenes, landfill leachate, gas chromatography, high resolution
mass spectrometry
INTRODUCTION
Polychlorinated naphthalenes (PCNs) are chemically and thermally stable and show electrical insulation properties, with a structure similar to that of polychlorinated biphenyls (PCBs) [1–4]. PCNs are persistent, bioaccumulative, trans-ported over long ranges, and widely present in the environ-ment [5,6]. Numerous serious health issues, such as chloracne and liver disease mortality for industrial workers caused by exposures to PCNs, have been reported [3]. The structural similarity of PCNs to the highly toxic 2,3,7,8-tetrachlorod-ibenzo-p-dioxin (2378-TCDD) indicates an aryl hydrocarbon receptor-mediated mechanism of toxicity (dioxin-like toxic-ity). Among PCNs, 1,2,3,6,7,8-hexachlorinated naphthalene showed the highest toxicity, and its relative potency has been detected by a CALUX test as 0.0051 compared to
2378-TCDD [7–9]. This relative toxicity value corresponds to the third highest for the Co-PCB in the WHO’s 2005 reevalu-ation of toxic equivalency factors (TEFs) for dioxins and dioxin-like compounds [9]; therefore, the behaviors, toxicity, and removal of PCNs in aquatic environments should be investigated.
The manufacture of PCNs began in around 1910, and they were sold as waxes with typical product names such as Halowax (Koppers, USA), Nibren waxes (Bayer, Germany), and Seekay waxes (ICI, UK) [1]. The industrial applications of PCNs comprise mainly cable insulation, automotive capacitors (dielectric), engine oil additives, and as stopoff compounds for the electroplating industry. PCNs cause industrial hygiene addiction, and their production declined in the late 1970s [3,4]. However, PCNs are persistent and continue to be present in previously manufactured products.
Corresponding author: Koji Ito, E-mail: [email protected]
Received: September 18, 2020, Accepted: January 21, 2021, Published online: April 10, 2021
Open AccessThis is an open-access article distributed under the terms of the Creative Commons Attribution (CC BY) 4.0 License. http:// creativecommons.org/licenses/by/4.0/
Moreover, PCNs are derived from technical PCB byproducts (technical biphenyl contains naphthalene) and unintention-ally from thermal processes in the presence of chlorine [1]. Since PCN-containing products are hardly available now, the main sources of PCNs in the environment that should be considered are leachate from landfill sites where PCN-containing products have been disposed of and exhaust gases from waste incinerators or other thermal processes [3–6].
Monochlorinated naphthalenes (MoCNs) were used as raw material for dyes and as a wood preservative in the 1940s and 1950s [4]. 1-MonoCN is designated as a class 2 chemical sub-stance for their thorough Safety Data Sheet (SDS) system un-der the Act on Confirmation of Release Amounts of Specific Chemical Substances in the Environment and Promotion of Improvements to the Management in Japan [10]. Di-through octachlorinated naphthalenes (DiCNs, TrCNs, TeCNs, PeCNs, HxCNs, HpCNs, and OcCN) are listed in Annexes A and C of the Stockholm Convention on Persistent Organic Pollutants (POPs), due to their degrees of toxicity, stability, bioaccumulation, and their long-range transportation [5]. Parties that have signed the POPs convention must take measures to eliminate the production and use of the chemi-cals listed under Annex A and to reduce the unintentional releases of chemicals listed under Annex C with the goal of continuing minimization and, where feasible, ultimate elimination [5]. In Japan, TrCNs-OcCN were designated as a Class 1 Specified Chemical Substance under the Chemical Substances Control Law in 1979, and its manufacture and use have been prohibited. Because of the properties of MoCNs and PCNs, their usage is currently restricted; however, they could still be present in the environment.
In the 1970s, PCNs were measured at nd–5.5 µg/L in water near two capacitor manufacturing sites [11]. A Swedish study reported that PCN concentrations in PCB-polluted rivers and percolating water at city dump sites were 0.89 and 2.6 ng/L, respectively [12]. In a recent monitoring survey in Japan, the MoCNs and PCNs in environmental water were cumu-latively nd–260 pg/L [13]. In addition, various results have been reported regarding their presence in the atmosphere, sediments, aquatic and terrestrial organisms, and biota in and outside the polar region [5]. However, few reports have examined the state of PCN concentrations in leachate from landfills where PCN-containing products might have been discarded [14]. Few investigations have been performed be-cause of the need for a complex analytical method that must cover all PCN isomers as target analytes. Our previous report suggested that PCNs listed as POPs in leachate at the final disposal site could be determined with the same pretreatment
as for dioxin analysis [14]. In the previous research, DB-5 ms or (5%-Phenyl)-methylpolysiloxane-based similar non-polar capillary column for which the elution behavior of PCNs in GC-HRMS analysis was known [2,15,16] was applied, but these column is not commonly used in dioxin analysis [17]. Ninety one percent of dioxin analyses conducted by labora-tories that participated in the ISO/IEC 17043 proficiency test in 2019 had adopted an Rh-12 ms column [18]. In Japan, it is common to measure dioxins by combining an Rh-12 ms and a BPX-DXN capillary column [18]. Therefore, if PCNs can also be analyzed with this column, dioxin and PCNs can be efficiently analyzed without replacing the column.
The purpose of this study was to enable GC-HRMS analy-sis of PCNs by fitting various parameters of the Rh-12 ms capillary column, and to determine PCN concentrations in landfill leachates, and PCNs behavior in the wastewater treatment processes. We also examined MoCN measurement conditions that could not be quantified in the previous report because D7-labeled 2-MoCN cleanup spikes could not be
detected.
MATERIALS AND METHODS
Standards and other reagents
Analytical standards were prepared using certified stan-dards solutions, Mono-Octa PCN Calibration Solutions (Cambridge Isotope Laboratories Inc., Tewksbury, USA). The isotope-labeled analytical solution, which is used as a clean-up and syringe spike, was prepared using certified Mono-Octa PCN Cleanup Spike (Cambridge Isotope Labora-tories Inc.) and Mono-Octa PCN Syringe Spike (Cambridge Isotope Laboratories Inc.). Mono-Octa PCN Native PAR Solution (Cambridge Isotope Laboratories Inc.) was used for recovery tests and method detection limits (MDL) tests. Each spike solution was diluted with nonane (dioxin-analysis grade, FUJIFILM Wako Pure Chemical Corporation, Osaka, Japan) before use. Toluene, hexane, and acetone (dioxin-analysis grade, FUJIFILM Wako Pure Chemical Corpora-tion) were used for the extraction and cleanup processes during the analysis.
Leachate samples
Leachate samples collected with a stainless steel bucket from 6 landfills were dispensed into 3 L glass bottles and 500 mL polypropylene (PP) bottles. The leachates were col-lected five times from these landfills during September 2019 to November 2020. Landfill A-1, A-2, and A-3 are the dispos-al sites for industridispos-al wastes which are mainly sludge, waste
plastic, waste paper, waste rubber, waste metal, waste glass, fibers waste and slag. These landfills are located in the same area. In contrast, landfill B-1, B-2, and C are the disposal sites for municipal solid wastes (MSW) where incineration residues are landfilled. Landfill B-1 and B-2 are located nearby, but landfill C is located apart from them. Among all landfills investigated in this study, landfill A is the oldest and landfill C is the newest. Landfill B-1 was constructed earlier than B-2. The collected leachate samples were stored at 4°C until extraction for PCNs analysis or measurement of other parameters. Water temperature, pH, electric conductiv-ity (EC), and dissolved oxygen were measured using a pH/ EC meter (D73, HORIBA, Kyoto, Japan) in the field. Total organic carbon (TOC), chemical oxygen demand (COD), biochemical oxygen demand (BOD), total nitrogen (TN), and total phosphate (TP) were analyzed in the laboratory using a TOC meter (TCN, Shimadzu, Kyoto, Japan) or according to the JIS method (JIS K 0102). Dissolved organic carbon (DOC) was analyzed using a TOC meter after filtration of leachate samples by a grass filter (GF/F, WhatmanTM, Maidstone, UK). PCNs were analyzed as described in the following steps.
Extraction and purification for analysis of MoCNs and PCNs
In order to quantify MoCNs and PCNs, the pH of each leachate sample was adjusted to a value from 6 to 9, accord-ing to the standard method for dioxin analysis (JIS K 0312) [17]. Then, a cleanup spike (200 pg for each isomer) diluted with acetone was added to each sample. These samples were treated with DioFLOCK® for wastewater samples (Miura Co. Ltd., Matsuyama, Japan), and the flocks formed were col-lected through glass fiber filter paper (pore size of 0.5 μm). The filter papers were dried in a drying oven heated to 45°C, and a Dean Stark Soxhlet extraction performed with 500 mL toluene was refluxed for 16 h at a rate of approximately 6 cycles per hour. The extracts were concentrated by rotary evaporation, and the solvents changed to 0.5 mL of decane (dioxin-analysis grade, FUJIFILM Wako Pure Chemical Corporation).
The decane solutions were automatically purified using the SPD-600GC system (Miura Co. Ltd.), which can carry out accurate and rapid purification of extracts. This system con-sists of a multi-layer silica gel column and an active carbon silica gel column. The multi-layer silica gel column was in its usual combination of an upper column packed with 10% AgNO3 coated silica gel, and a lower column packed with
37% H2SO4 coated silica gel. The standard method for
di-oxin analysis involves putting the decane solution through a multi-layer silica gel column and passing it through 80 mL of hexane heated at 60°C for purification. An activated carbon column will then capture the coplanar compounds. Finally, the activated carbon silica gel column was backflushed with a small amount of toluene and sample solution concentrated to approximately 1.5 mL.
PCNs can be treated in the same way, while MoCNs are tightly bound to the H2SO4 coated silica gel and will not
elute. Therefore, a 30 cm Teflon tube was connected between the upper and lower columns of the multi-layer silica gel and was cooled by the fan attached to the SPD-600GC system. This procedure allowed hexane in the tube to be cooled at room temperature of 25°C before flowing into the lower column. This modified method promotes elution of MoCNs from the lower column.
Prior to GC-HRMS analysis, 1.5 mL of toluene solution was fortified with a syringe spiked solution containing 13C
12
labeled PCB (200 pg each). It was sprayed with N2 gas and
concentrated to less than 20 µL to prepare a sample for GC-HRMS.
GC-HRMS analysis
The samples were analyzed for PCNs using a gas chro-matograph/high-resolution mass spectrometer (7890B GC, Agilent, Santa Clara, USA) and JMS-800D Ultra-FOCUS (JEOL, Tokyo, Japan) fitted with an Rh-12 ms column (60 m × 0.25 mm i.d. InventX, Torrance, USA). The GC-HRMS system was tuned to > 10,000 resolving power (10% valley definition) and 1 µL of the sample solution was injected in the splitless mode with a He carrier gas at a flow rate of 1.7 mL/ min, with the inlet and transfer line temperatures maintained at 250°C and 270°C, respectively. The GC program was set at an initial temperature of 90°C (hold for 2 min), then ramped to 160°C at a rate of 20°C/min, 220°C at a rate of 3°C/min, 280°C at a rate of 4°C/min, 320°C at a rate of 5°C/min, and finally to 320°C (hold for 1.5 min). The HRMS was oper-ated in electron ionization mode and selected ion monitoring (SIM) mode, as shown in Table 1, at an electron energy of
38 eV and ionizing current of 500 μA. Perfluorokerosene (PFK) was used as a reference compound for lock mass, to adjust for drift. Polychlorinated naphthalene isomers were identified based on the standard method for dioxin analysis. That is, the signal-to-noise ratio (S/N) was > 3, the isotopic ratios of the two isotope peaks were within ±15%, and the coefficient of variation (CV) of the calibration curves was within ±10% for RRcs and within ±20% for RRrs. The rela-tionship between native PCN isomers, clean-up spikes, and
syringe spikes are shown in Table 2. The isomers without
the corresponding cleanup spikes were quantified using the average RRcs of each chloride.
Confirmation of elution order of PCNs using a RH-12 ms capillary column
Mono-Octa PCN Calibration Solutions (Cambridge Iso-tope Laboratories Inc.), PCN-INC (Wellington Laboratories
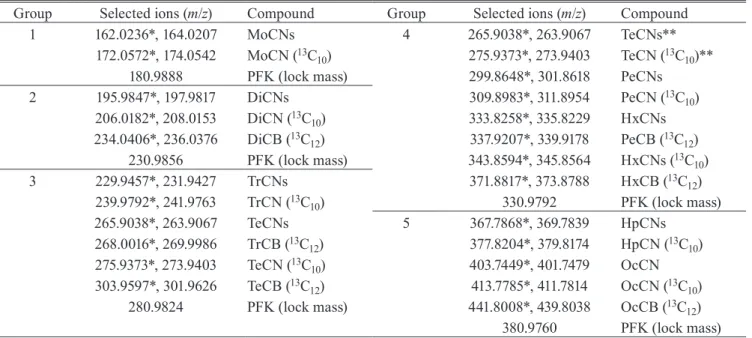
Table 1 SIM settings and grouping conditions.
Group Selected ions (m/z) Compound Group Selected ions (m/z) Compound
1 162.0236*, 164.0207 MoCNs 4 265.9038*, 263.9067 TeCNs**
172.0572*, 174.0542 MoCN (13C
10) 275.9373*, 273.9403 TeCN (13C10)**
180.9888 PFK (lock mass) 299.8648*, 301.8618 PeCNs
2 195.9847*, 197.9817 DiCNs 309.8983*, 311.8954 PeCN (13C 10) 206.0182*, 208.0153 DiCN (13C 10) 333.8258*, 335.8229 HxCNs 234.0406*, 236.0376 DiCB (13C 12) 337.9207*, 339.9178 PeCB (13C12) 230.9856 PFK (lock mass) 343.8594*, 345.8564 HxCNs (13C 10) 3 229.9457*, 231.9427 TrCNs 371.8817*, 373.8788 HxCB (13C 12) 239.9792*, 241.9763 TrCN (13C 10) 330.9792 PFK (lock mass) 265.9038*, 263.9067 TeCNs 5 367.7868*, 369.7839 HpCNs 268.0016*, 269.9986 TrCB (13C 12) 377.8204*, 379.8174 HpCN (13C10) 275.9373*, 273.9403 TeCN (13C 10) 403.7449*, 401.7479 OcCN 303.9597*, 301.9626 TeCB (13C 12) 413.7785*, 411.7814 OcCN (13C10)
280.9824 PFK (lock mass) 441.8008*, 439.8038 OcCB (13C
12)
380.9760 PFK (lock mass)
*Most abundant ion in an ion cluster. **1,2,3,8-, 1,4,5,8-, 1,2,7,8-TeCN elutes in this group
Table 2 Cleanup and syringe spikes for standard quantitation.
Native isomer PCN Labeled isomer in cleanup spike Labeled isomer in syringe spike PCB
2-MoCN 2 2-MoCN (13C 10) 2,5-DiCB (13C12) 9 1,5-DiCN 6 1,5-DiCN (13C 10) 1,2,3-TrCN 13 1,2,3-TrCN (13C 10) 2,2′,5,5′-TeCB (13C12) 52 1,2,3,4-TeCN 27 1,2,3,5-TeCN 28 1,3,5,7-TeCN 42 1,3,5,7-TeCN (13C 10) 1,4,5,8-TeCN 46 2,3,6,7-TeCN 48 1,2,3,4,5-PeCN 49 2,2′,4,5,5′-PeCB (13C 12) 101 1,2,3,4,6-PeCN 50 1,2,3,5,7-PeCN 52 1,2,3,5,7-PeCN (13C 10) 1,2,3,5,8-PeCN 53 1,2,3,4,5,8-HxCN 65 2,2′,3,4,4′,5′-HxCB (13C 12) 138 1,2,3,5,6,7-HxCN 67 1,2,3,5,6,7-HxCN (13C 10) 1,2,3,5,6,8-HxCN 68 1,2,3,5,7,8-HxCN 69 1,2,3,6,7,8-HxCN 70 1,2,4,5,7,8-HxCN 72 1,2,3,4,5,6,7-HpCN 73 1,2,3,4,5,6,7-HpCN (13C 10) 2,2′,3,3′,4,4′,5,5′-OcCB (13C12) 194 OcCN 75 OcCN (13C 10)
Inc., Guelph, Canada), PCN-HWX (Wellington Laboratories Inc.), and fly ash samples were analyzed by DB-5 ms capil-lary column (60 m × 0.32 mm i.d., 0.25 µm film thickness, Agilent) and an Rh-12 ms capillary column, and each peak area was compared to determine the elution order. The chro-matogram of the PCNs obtained with the Rh-12 ms capillary column is displayed in Fig. 1, which shows selected ion
chromatograms obtained from fly ash samples.
RESULTS AND DISCUSSION
Method application and performance
In order to assess the application of the modified method, recovery tests (n = 6) were performed using fortified leach-ate samples. The samples were fortified with native isomers
(MoCNs and PCNs) and their stable isotopes for a cleanup spike at concentrations of 97–100 and 183–209 pg/L, respec-tively. The measured concentrations of each native isomer were 87–112 pg/L with the mean CV of 3.9%. The mean re-covery rates of each isomer of the cleanup spike was 72–110% (Table S1). When hexane was heated at 60°C as in the ordinal
dioxins analysis, the recovery rate of 13C
10 labeled 2-MoCN
decreased to 31%, and the recovery rates of Di-Octa cleanup spikes remained at 60 to 106%. These results indicate that the modified method is robust and suitable for the analysis of MoCNs and PCNs in leachate from landfills. The instrumen-tal detection limits (IDLs) were calculated as the standard deviation multiplied by 3, respectively, for five replicate injections of the lowest level standard (native 0.2pg each), the IDLs for the MoCNs and PCNs were 0.02 and 0.01–0.04
pg. The method detection limits (MDLs) were calculated as the standard deviation multiplied by 3, respectively, for six replicate injections of 3,000 mL leachate samples to which 0.5 pg of each native isomer had been added, the MDLs for MoCNs and PCNs were 0.40 and 0.20–0.67 pg/L.
PCNs in landfill leachate samples
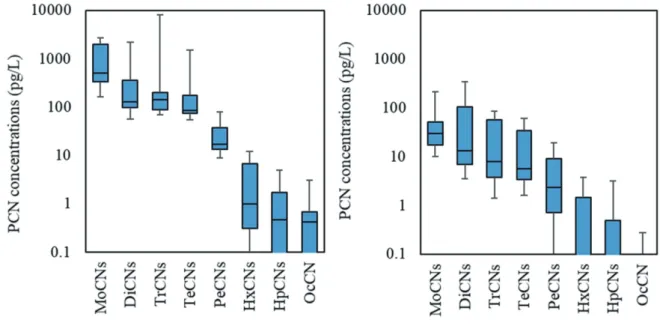
The concentration ranges of PCN homologues in leach-ates at the 6 landfill sites are shown in Fig. 2 (Table S2).
DiCNs-OcCN concentrations ranged from 8.0 to 12,000 pg/L in each leachate (Table S3). Among MoCNs and PCNs,
MoCNs-PeCNs, relatively high hydrophilic homologues, were predominantly detected in landfill leachates. HxCNs-OcCN homologues were rarely contained in landfill leach-ates, and their concentrations were less than a few pg/L. The average percentage of homologues of PCNs listed as POPs (DiCNs-OcCN) in landfill leachates were as follows: DiCNs was 27%, TrCNs was 54%, TeCNs was 17%, PeCNs was 2.1%, HxCNs was 0.29%, HpCNs was 0.11%, and OcCN was 0.049%, respectively (Fig. S1). The CVs of DiCNs, TrCNs,
and TeCNs were 36%, 47%, and 46%, respectively. The con-centration of DiCNs-TeCNs in the leachates from industrial wastes disposal sites were about 10 times higher than those
in the leachates from MSW disposal landfill sites.
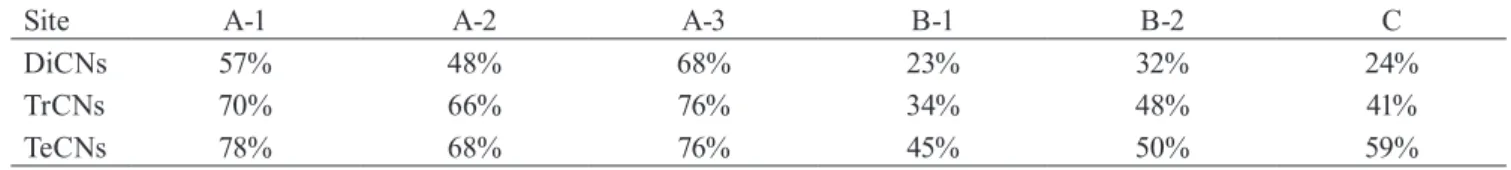
Table 3 shows the percentage of product-derived isomers
in the DiCNs-TeCNs homologues at of each leachate. The leachate from industrial waste sites A-1, A-2, and A-3 had a higher percentage of product-derived DiCNs-TeCNs than the MSW site. This result suggests that the type of PCN isomers contained in the leachate reflects the properties of landfill waste to some extent. The PCNs contents of MSW incinera-tion residues are lower than that of PCN-containing products such as rubber belts and waste woods [19,20]. This might be a reason that higher PCN concentrations were determined in the leachates from industrial waste landfill. Under the GC column conditions of this study, the product-derived isomers 136-TrCN, 1467-TeCN and the incineration-derived isomers 137-TrCN, 1367-TeCN could not be separated on each mass number channel. This separation is a future task to clarify the resources of PCNs in the exudate. At the MSW site, only the incineration residue is landfilled, but at the industrial waste site where various wastes are landfilled, it is difficult to esti-mate what kind of PCN-containing products in the leachate is derived from. The concentrations of PCNs in the leachates from landfill B-1 were higher than those from B-2, while the percentage of homologues of PCNs were similar between
Fig. 2 The concentration ranges of PCN homologues in landfill leachates. The box plots represent the 1st quartile, median
and 3rd quartile values. The negative and positive error bars represent the difference between 1st quartile and minimum value, and maximum and 3rd quartile value, respectively. The Y-axis is displayed the logarithmic scale. PCN homologues concentrations below the MDL plotted values 1/10 of the MDL.
the landfill sites. Landfill B-1 was constructed earlier than B-2, so advances in a landfill management and incineration technology may have contributed in the decreasing of PCN concentrations in landfill site B-2, but the specific reason still remains unclear.
The means of water qualities except PCNs were shown in Table S4. Although the number of data is not sufficient
(only 5 data set for each site), significant positive correlations between PCN concentrations and turbidity, TOC, DOC, COD, and TN. On the other hand, there was no correlation between the PCNs concentrations and BOD. The tendency might suggest that PCNs move with suspended solids (SS) or dissoluble organic substances which is not BOD, assuming turbidity relates to SS. There are future plans to examine the relationship between PCN concentrations and these pa-rameter or other water qualities, for example aquatic humic substances and SS from more survey sites. Moreover, the leachate at landfill sites B-1, B-2 and C, where only incinera-tion residue was landfilled, had low PCN concentraincinera-tions. A greater variety of leachate samples should be investigated to clarify whether this tendency is common.
Behavior of PCNs in wastewater treatment process
The leachate from the landfill sites is collected as raw wastewater and it undergoes several treatment processes in a wastewater treatment plant before exhausted to the environ-ment. In the three out of five times surveys on the leachate from in the landfill sites, the PCN concentrations in the raw wastewater and water sample collected from the different stage of treatment processes in the wastewater treatment plants were analyzed in addition to the leachate samples. Here, the raw wastewater at each leachate treatment plant A
and B stands for the mixture of the leachate from landfill site A-1, A-2, and A-3 and landfill site B-1 and B-2, respectively.
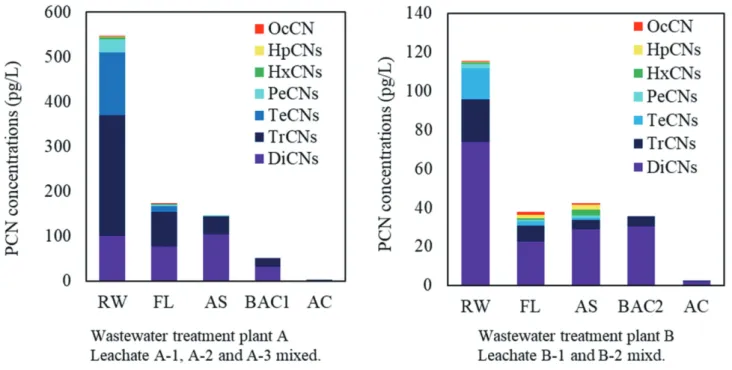
Figure 3 shows the concentrations of PCN homologues
list-ed as POPs (DiCNs-OcCN) at each treatment process in the plant A and B. The removal rates of PCNs were calculated by comparing the PCN concentrations before and after each treatment processes. Table 4 shows the average removal rate
of DiCNs-PeCNs after each treatment at the plant A and B. In the flocculation process, the average removal rates of DiCNs, TrCNs, TeCNs, and PeCNs were 47, 67, 87, and 80%, respectively. Although the removal rates varied depending on the plants or/and survey day, PCNs were effectively re-moved by the flocculation treatment. Notably, the removals of TeCNs and PeCNs, which are highly hydrophobic homo-logues, were higher than those of DiCNs and TrCNs. This suggests that PCNs of highly hydrophobic homologues were removed more effectively than that of hightly hydrophilic homologues by a flocculation process. However, the average removal rate of DiCNs-PeCNs in the biological treatment was ranged from −32–70%. There were large variations in the removal rates depending on the collection day or/ and plants, and no particular tendency was observed in the biological treatment. In contrast, TOC, DOC, COD and BOD were gently removed in each treatment process, and TN were removed in a process of activated sludge treatment (Figs. S2, S3, S4, and S5), therefore the removal process of
PCNs seems to be different form these parameters and the biological treatment might be ineffective for PCNs removal. Activated carbon treatment resulted in a high removal rate for PCNs (Fig. 3 and Table 4). However, since most of the
PCNs had already been removed from the leachate during the water treatment process up to that point, it is difficult Table 3 The percentage of product-derived isomers in the DiCNs-TeCNs homologues at of each leachate.
Site A-1 A-2 A-3 B-1 B-2 C
DiCNs 57% 48% 68% 23% 32% 24%
TrCNs 70% 66% 76% 34% 48% 41%
TeCNs 78% 68% 76% 45% 50% 59%
A-1, A-2 and A-3 ; leachate-controlled landfill sites for industrial wastes B-1, B-2 and C ; leachate-controlled landfill sites for municipal soild wastes Type of isomers at each homologue; derived from product or incineration [2,15,16].
Product (Halowax) incineration (fly-ash) Included in both
DiCNs 14/16 13,27,12,23,18 15,17/26
TrCNs 146,145 127,125,126,137,167/236,123 136/135,124,138,128
TeCNs 1257/1246,1358/1236,1248, 1258/1268,1458 1247,1368/1256/1235,1237,1234, 1267,2367,1238 1357,1367/1467,1245,1278 Isomers that cannot be separated into product or incineration are underlined.
to verify the treatment efficiency. Table S5 shows the mean
concentrations of PCN homologues in leachate wastewater at each process of the treatment plant. After the activated carbon treatment, DiCNs-OcCN were decreased to below or near MDL. In addition, MoCNs was also decreased to below 6.9 pg/L after the treatment. These results demonstrated that MoCNs and PCNs removal progressed through these water treatment processes. So the leachates were adequately released at a lower concentration than in river water [13]. In order to determine the types of water treatment processes
effective in removing PCNs, it is necessary to obtain results from fact-finding surveys at monitoring sites as well as labo-ratory experiments of unit operations.
MoCN isomers in landfill leachate samples
Figure 4 shows the mean concentrations of MoCN
iso-mers and DiCNs-OcCN at each landfill leachate (Table S4).
At some industrial waste disposal sites, the concentrations of MoCNs were much higher than those of PCNs. Similar to metal compounds and pentachlorophenol (PCP), MoCNs
Fig. 3 The concentrations of PCN homologues listed as POPs (DiCNs to OcCN) at each process in the leachate treatment
plants.
RW: raw wastewater; FL: after flocculation treatment; AS: after activated suldge treatment; BAC: before activate carbon; AC: after activate carbon
BAC1: after chemical treatment; BAC2: after second flocculation treatment
Table 4 The average removal rate of PCN homologues (DiCNs-PeCNs) after each water treatment process at the a and B
plant. Site A B Average Process FL AS AC FL AS AC FL AS AC DiCNs 24% -35% 96% 69% -28% 93% 47% -32% 95% TrCNs 72% 48% 89% 63% 41% 96% 67% 45% 92% TeCNs 91% 92% * 84% 49% * 87% 70% * PeCNs 88% 81% * 72% -76% * 80% 2.1% *
*: The removal rate could not be calculated because most of the PCNs were removed before the activated carbon treatment. In order to calculate the removal rate, the value less than MDL were setting to 1/10 of MDL.
have been used as wood preservatives, especially in its role as an antiseptic [21,22]. In a study investigating wood pre-servative POPs in waste timber from demolished buildings and their recycled products in Japan, chlorden, PCP, and PCNs were detected in wood chips from waste timber [20]. In addition, it has been reported that most of the chlorinated naphthalene in recycled products are MoCNs and DiCNs [20]. The industrial waste at disposal sites A-1, A-2, and A-3 contains waste wood, and thus, MoCNs and DiCNs that leached out from these sites are probably derived from wood preservatives that had been used a long time ago. Moreover, the leachates in site A contain a high proportion of 1-MoCN in which chlorine is substituted at the α-position. This result is consistent with previous studies that have described that most of the industrially produced MoCNs are considered to be 1-MoCN [1,2].
CONCLUSIONS
Isomer-specific analysis of MoCNs and PCNs in landfill leachate was developed in accordance with standard dioxin analysis methods (JIS K 0312). The elution order of PCNs by the Rh-12 ms capillary column was determined. The modi-fied method of cooling hexane on multilayer silica gel made it possible to measure MoCNs in a stable manner. Among the DiCNs-OcCN listed as POPs, most of the PCN
homo-logues detected in the leachates were DiCNs-PeCNs, and their concentrations varied depending on the landfill sites. Although further investigation is required for the removal rate of each water treatment process, flocculation and an ac-tive carbon treatment were assumed to be effecac-tive for the removal of PCNs, and the PCN concentrations were reduced from MDLs to a few pg/L thorough water treatments, and the leachates were adequately released. MoCNs that may be derived from wood preservatives were detected at much higher concentrations than PCNs in landfill sites containing waste wood.
In order to estimate the potential risk of PCNs in landfill leachates and manage them appropriately over the long term, it is necessary to clarify the actual state of leaching of vari-ous leachates and study more effective treatment methods. The modified method developed in this study is practical and will help to elucidate the content of PCNs, including MoCNs, in leachate from landfill sites.
ACKNOWLEDGEMENTS
This work was supported by the Environment Research and Technology Development Fund (JPMEERF20193004) of the Ministry of the Environment, Japan. We thank land-fill managers and technicians for their assistance with our sampling. We also thank Keiko Goto and Manami Ochi
(Re-Fig. 4 The mean concentrations of MoCN isomers and DiCNs-OcCN in each
search Institute of Environment, Agriculture and Fisheries, Osaka, Japan) for their assistance with laboratory analysis.
SUPPLEMENTARY MATERIALS
Supplementary Materials file for this article is available at the link below.
https://www.jstage.jst.go.jp/article/jwet/19/2/19_20-135/ _supplement/_download/19_20-135_1.pdf
REFERENCES
[1] Falandysz J: Polychlorinated naphthalenes: an environ-mental update. Environ. Pollut., 101(1), 77–90, 1998. PMID:15093100 doi:10.1016/S0269-7491(98)00023-2
[2] Schneider M, Stieglitz L, Will R, Zwick G: Forma-tion of polychlorinated naphthalenes on fly ash.
Che-mosphere, 37(9–12), 2055–2070, 1998. doi:10.1016/ S0045-6535(98)00269-0
[3] WHO: Concise International Chemical Assessment Document 34, Chlorinated Naphthalenes, 2001. https:// www.who.int/ipcs/publications/cicad/en/cicad34. pdf?ua=1 [accessed in September, 2020]
[4] US EPA: Environmental Hazard Assessment Report: Chlorinated Naphthalenes., US EPA Report, 560/8– 56075-001, 1975. https://nepis.epa.gov/
[5] UNEP: Risk profile on chlorinated naphthalenes, Report of the Persistent Organic Pollutants Review Committee on the work of its eighth meeting, UNEP/ POPs/PORRC.8.16/Add.1, 2012. http://chm.pops.int/ Convention/POPsReviewCommittee/LatestMeeting/ POPRC8/POPRC8ReportandDecisions/tabid/2950/ Default.aspx [accessed in September, 2020]
[6] Environment Canada: Ecological Screening Assess-ment Chlorinated Naphthalenes, 2011.
[7] Suzuki G, Michinaka C, Matsukami H, Noma Y, Kajiwara N: Validity of using a relative potency fac-tor approach for the risk management of dioxin-like polychlorinated naphthalenes. Chemosphere, 244,
125448, 2020. PMID:31812059 doi:10.1016/j.chemo-sphere.2019.125448
[8] Blankenship AL, Kannan K, Villalobos SA, Villeneuve DL, Falandysz J, Imagawa T, Jakobsson E, Giesy JP: Relative potencies of individual polychlorinated naph-thalenes and halowax mixtures to induce Ah receptor-mediated responses. Environ. Sci. Technol., 34(15),
3153–3158, 2000. doi:10.1021/es9914339
[9] Van den Berg M, Birnbaum LS, Denison M, De Vito M, Farland W, Feeley M, Fiedler H, Hakansson H, Hanberg A, Haws L, Rose M, Safe S, Schrenk D, To-hyama C, Tritscher A, Tuomisto J, Tysklind M, Walker N, Peterson RE: The 2005 World Health Organization reevaluation of human and Mammalian toxic equiva-lency factors for dioxins and dioxin-like compounds.
Toxicol. Sci., 93(2), 223–241, 2006. PMID:16829543
doi:10.1093/toxsci/kfl055
[10] Ministry of Economy, Trade and Industry: Safety Data Sheet system − List of Class 2 Designated Chemical Substances, Ministry of Economy, Trade and Industry, Government of Japan. https://www.meti.go.jp/policy/ chemical_management/law/msds/sin2shueng.pdf [ac-cessed in September, 2020]
[11] Erickson MD, Michael LC, Zweidinger RA, Pellizzari ED: Sampling and analysis for polychlorinated naph-thalenes in the environment. J. AOAC Int., 61(6), 1335–
1346, 1978. PMID:730637 doi:10.1093/jaoac/61.6.1335
[12] Järnberg U, Asplund L, Wit C, Egebäck AL, Wid-eqvist U, Jakobsson E: Distribution of polychlorinated naphthalene congeners in environmental and source-related samples. Arch. Environ. Contam. Toxicol.,
32(3), 232–245, 1997. PMID:9096072 doi:10.1007/ s002449900181
[13] Ministry of the Environment: 20 Polychlorinated naphthalenes, Detailed version of Chemicals in the Environment, Ministry of the Environment, Govern-ment of Japan, pp.421–424, 2020. http://www.env.go.jp/ chemi/kurohon/2019/shosai/3_0_2.pdf [accessed in September, 2020, in Japanese]
[14] Daifuku T, Ito K, Banno A, Yabuki Y: Isomer-specific determination of polychlorinated naphthalenes in land-fill leachates by gas chromatography/high-resolution mass spectrometry. J. Water Environ. Technol., 17(6),
448–457, 2019. doi:10.2965/jwet.19-073
[15] Ministry of the Environment: Method for measuring POPs (polychlorinated biphenyl, hexachlorobenzene, pentachlorobenzene, polychlorinated naphthalene) in exhaust gas. Ministry of the Environment, Govern-ment of Japan, 2019. https://www.env.go.jp/air/osen/ manual2/pdf_rev201903/03_chpt3-2.pdf [accessed in September, 2020, in Japanese]
[16] Nakano T, Fujimori K, Takaishi Y, Umeda H: Isomer specific analysis of polychloronaphthalenes. Report of
the Hyogo Prefectural Institute of Environmental Sci-ence, 25, 34–41, 1993. [in Japanese]
[17] Japan Industrial Standard (JIS): Method for determi-nation of tetra-through octachlorodibenzo-p-dioxins, tetra-through octachlorodibenzofurans and dioxin-like polychlorinatedbiphenyls in industrial water and waste water, K 0312 (2020). Japanense Standards Associa-tion, Tokyo, Japan, 2019.
[18] Proficiency Test Committee: Report of the 22nd ISO / IEC 17043 compliant dioxin analysis technology test -Simulated wastewater-. The Japan Society for Ana-lytical Chemistry, Tokyo, Japan, 2019. [in Japanese] [19] Noma Y, Yamamoto T, Giraud R, Sakai S: Behavior
of PCNs, PCDDs, PCDFs, and dioxin-like PCBs in the thermal destruction of wastes containing PCNs.
Che-mosphere, 62(7), 1183–1195, 2006. PMID:16154176
doi:10.1016/j.chemosphere.2005.07.039
[20] Koyano S, Ueno D, Yamamoto T, Kajiwara N: Con-centrations of POPs based wood preservatives in waste timber from demolished buildings and its recycled products in Japan. Waste Manag., 85, 445–451, 2019. PMID:30803600 doi:10.1016/j.wasman.2018.12.039
[21] Tsunenari S, Yonemitsu K, Uchimura Y, Takaesu H, Kamisato M: A rare fatal case of wood preservative, monochloro-naphthalene (MCN), poisoning.
Foren-sic Sci. Int., 20(2), 173–178, 1982. PMID:7118029
doi:10.1016/0379-0738(82)90143-8
[22] Inone Y: Safety of wood preservatives. Wood
Pres-ervation, 2, 15–49, 1975. [in Japanese] doi:10.5990/ jwpa.1975.2_15