87
ARTICLES
Historical Occurrence of El Nino and its Impact
on Food Crop Production at a Regional Level
in Asia and the Pacific
Shigeki Yokoyama
1Abstract
This paper aims to clarify the effects of ENSO (El Nino Southern Oscillation) on food crop production in tropical Asia and the Pacific. Firstly, we review the historical occurrence of El Nino events in the last forty years, and measure their impact on cereal production in the region. Secondly, we clarify the characteristics of production loss in El Nino years compared to that of non-El Nino years. Thirdly, we examine production variability and its ENSO sensitivity by major food crops in the region. We conclude with policy implications focusing on the roles of upland crops.
1. Mechanism of El Nino
The term El Nino (the Christ Child in Spanish) was originally referred to the phenomenon of an annual weak warm sea current from south to north along Peru and Ecuador about Christmas time by the local fishermen in the late 19th century or some time before (Fagan, 1999; Glantz, 1996). It was known that this abnormal warming disrupted local fish and bird populations. Scientists later showed that the coastal warming is associated with the Pacific basin-wide phenomenon linking atmospheric and oceanic components. As research continues to progress, the term El Nino now covers a wider range of phenomena: (i) The occasional return of unusually warm water in the normally cold water (upwelling) region along the Peruvian coast (ENSO warm event), (ii) A Pacific basin-wide increase in both sea surface temperature in the central and/or eastern equatorial Pacific Ocean and in sea level atmospheric pressure in
Kochi University Review of Social Science No. 97 March 2010
the western Pacific (Southern Oscillation), (iii) ENSO (El Nino Southern Oscillation) basin-wide changes in air-sea interaction in the equatorial Pacific region (Glantz, 1996).
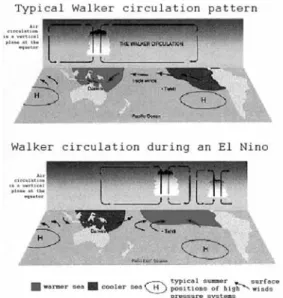
Under “normal” conditions, the western part of the Pacific Ocean is warmer than its eastern counterpart. As a result, air rises high over eastern Indonesia and Papua New Guinea, moves east across the Pacific at a high altitude, where it descends and returns back across the Pacific as westerly winds. When the sea is warmer and the air pressure is lower, large amounts of moist air are lifted up and carried over the land to be released as rain. The result is very high rainfall over large areas of the western Pacific including Indonesia, northern Australia and Papua New Guinea much of the time. When the eastern Pacific begins to warm up an El Nino event occurs. As the El Nino develops, the western Pacific becomes cooler than the eastern Pacific and the circulation of air across the Pacific reverses and goes in the opposite direction to usual. These dynamics of ocean and atmosphere are called “the Walker circulation” named after Sir Gilbert Walker, a Director-General of British observatories in India who, early last century, identified a number of relationships between seasonal climate variations in Asia and the Pacific (Figure 1).
Figure 1. Walker circulation
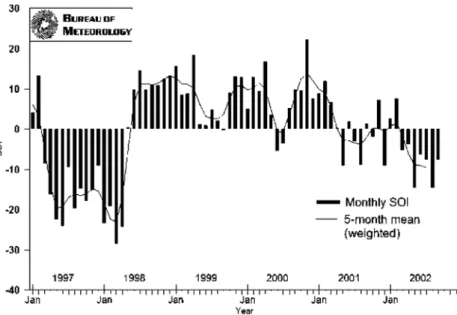
89 Historical Occurrence of El Nino and its Impact on Food Crop Production at a Regional Level in Asia and the Pacific The Southern Oscillation is a seesaw like oscillation of sea level air pressure change across the Pacific basin. Southern Oscillation Index (SOI) is the normalized difference in pressure between Tahiti (south-central Pacific) and Darwin (northern Australia) (Tahiti minus Darwin). The combination of El Nino, the oceanic component, and the Southern Oscillation, the atmospheric component, makes up the term ENSO. Negative SOI is associated with warm ENSO and positive with cold ENSO, which is referred to as La Nina, the young girl in Spanish. As shown in Figure 2, El Nino of 1997/98 was clearly evidenced by rapid fall and continuous large negative value of SOI.
Figure 2. Southern Oscillation Index 1997-2002 source: http://www.bom.gov.au/climate/glossary/elnino/
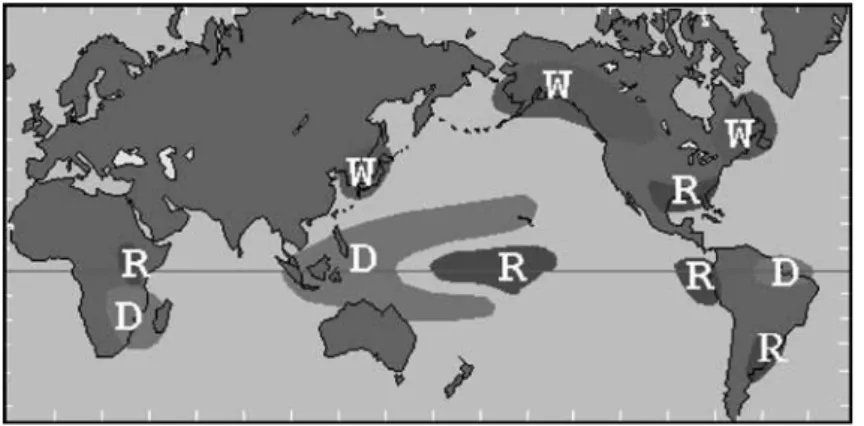
The ENSO system arouses keen interest for three reasons: it can be modelled, its influence on climate is global, and there is a time lag between climatic consequences (Gommes et al., 1998). During the months of April-September, the ENSO warm event has been associated with drought in Indonesia, northern Australia, India and northeastern Latin America, while its expected impacts in October-March are drought in southern Africa, continuing drought in northern Australia and Indonesia, high rainfall in eastern equatorial Africa, the Gulf of Mexico, western equatorial Latin America
and southeastern Latin America, and unseasonably warm weather in parts of North America, eastern China, the Korean peninsula and Japan (Figure 3 and 4).
2. Specification of an El Nino year
The ENSO event is commonly measured by SOI and sea surface temperature (SST) across the Pacific Ocean. However, due to the variations in timing and geographic patterns of warming, defining El Nino and La Nina universally, agreeable both
Figure 3. Climatic impacts of warm ENSO during April to September D: Drought, R: High rainfall (not necessarily intense).
Source: Gommes et al., 1998.
Figure 4. Climatic impacts of warm ENSO during October to March D: Drought, R: High rainfall (not necessarily intense), W: Abnormally warm.
91 Historical Occurrence of El Nino and its Impact on Food Crop Production at a Regional Level in Asia and the Pacific qualitatively and quantitatively, is difficult (World Meteorological Organization, 1999). A quantitative definition of El Nino, originally proposed by the Japan Meteorological Agency, then modified by the Climate Variability and Predictability (CLIVAR) project, gives five-month running means of SST anomalies in the Nino 3.4 region (5°N-5°S, 170°W-120°W) that exceed 0.4°C for six months or more, based on accepted concepts and designed to be consistent with previous recognized events (Trenberth, 1997). The multivariate ENSO Index (MEI) was devised to measure the strength of ENSO events which is expressed in the first principal component of six observed variables over the tropical Pacific: sea-level pressure (P), zonal (U) and meridional (V) components of the surface wind, sea surface temperature (S), surface air temperature (A), and total cloudiness fraction of the sky (C) (Wolter and Timlin, 1993). These two indices are well accepted for overall monitoring of the ENSO phenomenon. However, if one’s interest in ENSO is to a specific part of the world, it is recommended to establish another index to fit one’s needs (Trenberth, 1997; comment by Wolter at MEI Web site, 2002).
For our study area, southeast Asia and Australia, the SOI is known as a good indicator of rainfall (Podbury et al., 1998; Yoshino et al., 2000; Nicholls and Beard, 2000; Tawang et al., 2002; and Naylor et al., 2002). Consistently negative and rapidly falling SOI phase is associated with dry spells (Stone and Auliciems, 1992). Based on this finding, we specified El Nino years as when the annual average of SOI was lower than the standard deviation (-7.28), in the period of 1961-2000, and the annual average of SOI substantially (more than 2.00) declines from that of the previous year. Accordingly, since 1961 we can identify eight El Nino years as 1965, 1972, 1977, 1982, 1987, 1991, 1994 and 1997. This specification is mostly identical with those of CLIVAR and MEI (Trenberth, 1997; Wolter and Timlin, 1998).
3. Methods and data
To clarify the impacts of El Nino-induced abnormal weather conditions on total cereal production in the region, we ran simple linear regressions of production, area harvested, and yield against time, incorporating a dummy variable for El Nino years.
Production variability was measured for each crop by percentage deviation from a five-year moving average as trend, assuming no technological progress took place in the five-year period (Gommes, 1998, measured production loss based on seven-year
moving maximum). ENSO sensitivity was measured by correlation coefficient between percentage deviation from the 5-year moving average and monthly average of SOI (June to September in concurrent years).
The estimation period was 1961-2000. Analyzed crops were Total Cereals (aggregation of wheat, rice, barley, maize, rye, oats, millet, and sorghum), rice, maize, soybean, groundnut, sweet potato, and cassava. The data is aggregation of the following countries: Myanmar, Thailand, Lao People’s Democratic Republic, Cambodia, Viet Nam, Malaysia, Indonesia, the Philippines, Australia, New Zealand*, and Fiji (* Not applicable to variability and sensitivity analyses). Data sources were as follows. Production, area harvested, and yield were obtained from FAOSTAT (http:// apps.fao.org/) and SOI was taken from the SOI Archives, Bureau of Meteorology, Australia (http://www.bom.gov.au/climate/current/soihtm1.shtml).
4. Results
1) Occurrence of El Nino
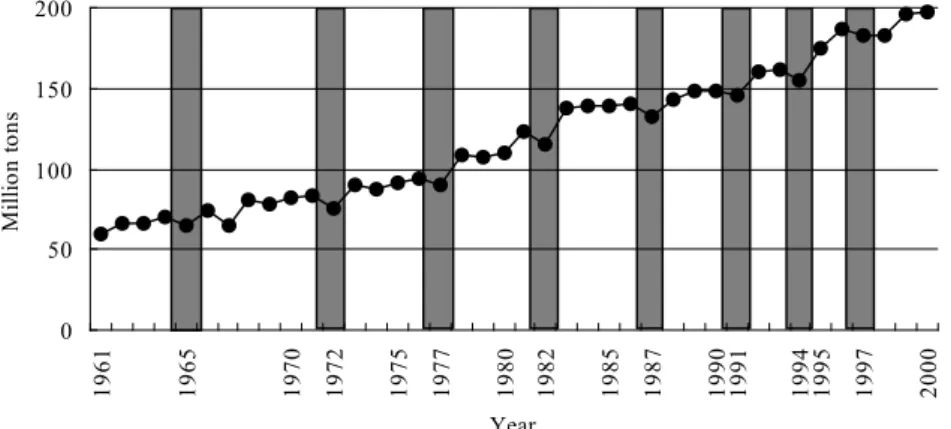
The El Nino event has been increasingly frequent in the last 40 years, as shown by one occurrence in the 1960s, two in the 1970-1980s and three in the 1990s (Figure 5, 6, and 7). This finding is consistent with the well-accepted observations that the characteristics of ENSO, over the second half of the 20th century, may have changed,
0 50 100 150 200 19 61 19 65 19 70 19 72 19 75 19 77 19 80 19 82 19 85 19 87 19 90 19 91 19 94 19 95 19 97 20 00 Year M ill io n to ns
Figure 5. Production of total cereals in the region, 1961-2000 Source: FAOSTAT. El Nino years are shown in shadow.
93 Historical Occurrence of El Nino and its Impact on Food Crop Production at a Regional Level in Asia and the Pacific
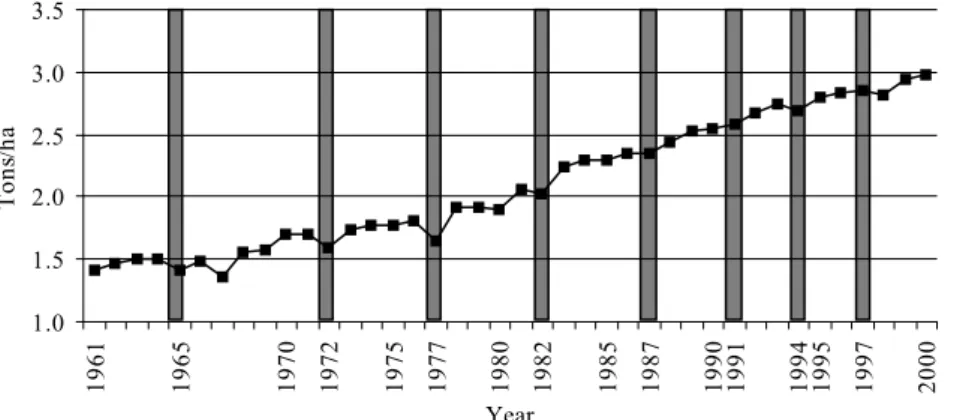
namely, more El Nino events since the 1970s, with a continuous sequence in the early 1990s and two major events in 1982-1983 and 1997-1998. It is also suggested that the changed frequency and intensity of recent El Nino events is beyond the expected climate system variability but may be linked to anthropogenic influences (World Meteorological Organization, 1999). 1.0 1.5 2.0 2.5 3.0 3.5 19 61 19 65 19 70 19 72 19 75 19 77 19 80 19 82 19 85 19 87 19 90 19 91 19 94 19 95 19 97 20 00 Year To ns /h a
Figure 6. Yield of total cereals in the region, 1961-2000 Source: FAOSTAT. El Nino years are shown in shadow.
Figure 7. Area harvested of total cereals in the region, 1961-2000 Source: FAOSTAT. El Nino years are shown in shadow.
40 45 50 55 60 65 70 19 61 19 65 19 70 19 72 19 75 19 77 19 80 19 82 19 85 19 87 19 90 19 91 19 94 19 95 19 97 20 00 Years M ill io n ha
2) El Nino impacts on cereal production
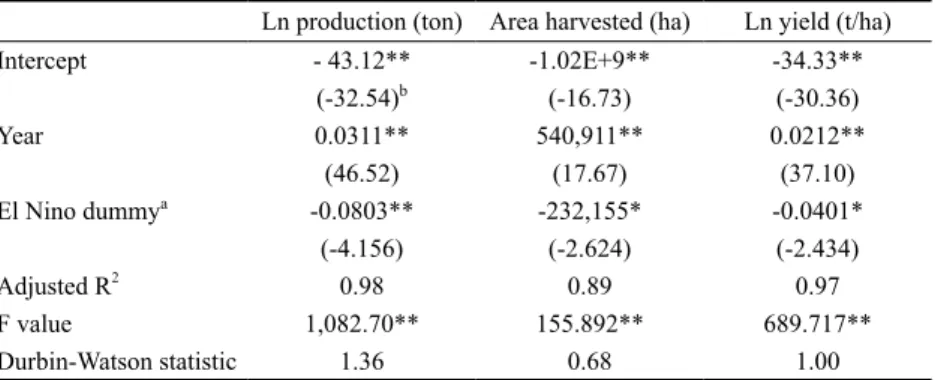
The results of regression analyses are shown in Table 1. All three functions are well fitted with a high value of adjusted R2. Coefficient of “Year” was significant at the
1 per cent level for the three functions. Coefficient of “El Nino dummy” was significant at the 1 per cent level for production and at the 5 per cent level for area harvested and yield.
Table 1 Results of regression analyses, total cereals, in the region, 1961-2000 Ln production (ton) Area harvested (ha) Ln yield (t/ha)
Intercept - 43.12** -1.02E+9** -34.33** (-32.54)b (-16.73) (-30.36) Year 0.0311** 540,911** 0.0212** (46.52) (17.67) (37.10) El Nino dummya -0.0803** -232,155* -0.0401* (-4.156) (-2.624) (-2.434) Adjusted R2 0.98 0.89 0.97 F value 1,082.70** 155.892** 689.717** Durbin-Watson statistic 1.36 0.68 1.00
a1 for 1965, 1972, 1977, 1982, 1987, 1991, 1994 and 1997, and 0 otherwise. bNumbers in parentheses are t-statistics.
** Significant at the 1 per cent level. * Significant at the 5 per cent level. Source: Author’s calculation.
As the dependent variable of production and yield functions were transformed into natural log, the coefficient of the independent variable can be directly interpreted as change ratio (Naylor et al., 1997). Thus, total cereal production of the region in the period from 1961 to 2000 had grown 3 per cent annually but dropped by 8 per cent in El Nino years. The annual growth rate of its yield was 2 per cent, while in El Nino years it declined by 4 per cent (Table 2).
3) Characteristics of El Nino-induced production loss
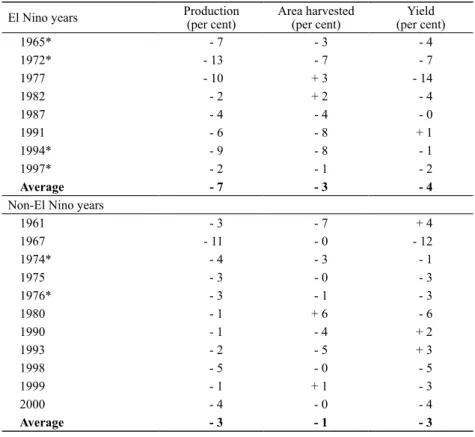
To illustrate the characteristics of the El Nino impact, production loss in El Nino years and that in non-El Nino years were compared. During the period of 1961-2000 we identified 19 cases of reduced production by 1 per cent or more from the trend, namely, 8 El Nino years and 11 non-El Nino years.
95 Historical Occurrence of El Nino and its Impact on Food Crop Production at a Regional Level in Asia and the Pacific
magnitude in El Nino years of 7 per cent on average was significantly larger than that of 3 per cent in non-El Nino years. Secondly, in El Nino years 4 out of 8 cases or 50 per cent, of both area harvested and yield declined simultaneously, while that happened only 18 per cent (2 out of 11) in non-El Nino years (Table 2).
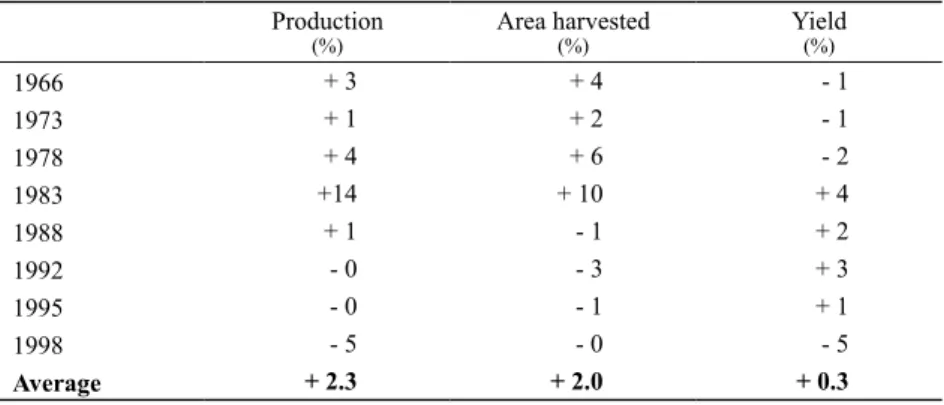
Although the damage was substantial, El Nino production loss was mostly a single year phenomenon with recovery of production in the following year due to the La Nina occurrence up until the late 1980s. However, the cyclical pattern of El Nino and La Nina has become unclear since the early 1990s, resulting in poor recovery or continuous loss (Table 3).
Table 2. Percentage deviation from the trend in production reduction yearsa, 1961-2000 El Nino years Production(per cent) Area harvested(per cent) (per cent)Yield
1965* - 7 - 3 - 4 1972* - 13 - 7 - 7 1977 - 10 + 3 - 14 1982 - 2 + 2 - 4 1987 - 4 - 4 - 0 1991 - 6 - 8 + 1 1994* - 9 - 8 - 1 1997* - 2 - 1 - 2 Average - 7 - 3 - 4
Non-El Nino years
1961 - 3 - 7 + 4 1967 - 11 - 0 - 12 1974* - 4 - 3 - 1 1975 - 3 - 0 - 3 1976* - 3 - 1 - 3 1980 - 1 + 6 - 6 1990 - 1 - 4 + 2 1993 - 2 - 5 + 3 1998 - 5 - 0 - 5 1999 - 1 + 1 - 3 2000 - 4 - 0 - 4 Average - 3 - 1 - 3
a Years in which production reduced by 1 per cent or more from the trend.
Trend is estimated as ln y = a + bt for production and yield, and: y = a + bt for area harvested. * Years in which both area and yield declined by 1 per cent or more.
Table 3. Percentage deviation from trend following El Nino years, 1961-2000 Production
(%) Area harvested(%) Yield(%)
1966 + 3 + 4 - 1 1973 + 1 + 2 - 1 1978 + 4 + 6 - 2 1983 +14 + 10 + 4 1988 + 1 - 1 + 2 1992 - 0 - 3 + 3 1995 - 0 - 1 + 1 1998 - 5 - 0 - 5 Average + 2.3 + 2.0 + 0.3
Trend is estimated as per Table 2.2. Source: Author’s calculation.
4) Production variability by crop
The ENSO impact differs by crop, according to its water requirement, dominant production condition (irrigated or rainfed), crop season, applied technology, farmer choice, etc. To clarify the characteristics of individual crops against ENSO, production variability and ENSO sensitivity are measured separately by crop and the results are then synthesized.
Production variability is measured by standard deviation of percentage departure from trend as a 5-year moving average (Table 4). Among the six major food crops, maize was the most variable in production and yield. A unique feature of maize is its positive correlation (0.53) between area harvested and yield which intensifies production variability. Soybean is the second most unstable crop for which variability is mostly explained by area fluctuation. Cassava, sweet potato and groundnut are all moderately variable. Cassava and sweet potato show negative correlation between area and yield, though their absolute value is small. Rice stands most stable, even though the water requirement, 600-1,000 mm during the 90-100 days growing period (De Datta, 1981), is largest among the crops. Rice production stability is attributed to its favorable production condition, as irrigated rice makes up 55 per cent of the world’s harvested area and 75 per cent of world rice production (IRRI, 2002).
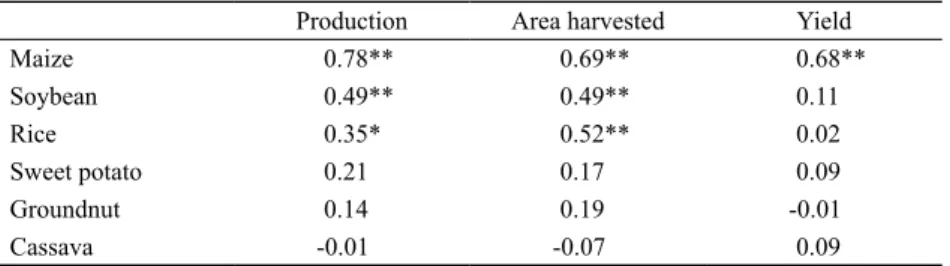
5) ENSO sensitivity by crop
97 Historical Occurrence of El Nino and its Impact on Food Crop Production at a Regional Level in Asia and the Pacific
departure from a 5-year moving average and SOI (monthly average of June to September in concurrent years) (Table 5). Same as is in the case for production variability, maize is the most ENSO sensitive followed by soybean. Maize is sensitive both in its area and yield, while soybean is significantly correlated only in area. Rice is moderately ENSO sensitive in its area, as is soybean, while its production is less sensitive than that of soybean. Sweet potato, groundnut and cassava are not ENSO sensitive, though their production variability is larger than that of rice (Table 4). However, it should be noted that production of sweet potato, which is a staple food in the highlands of New Guinea Island, was substantially damaged in the El Nino years. A series of frosts associated with drought destroyed this root crop, resulting in serious famine (Ballard, 2000 and Bourke, 2000).
Table 4. Production variability by crop in the region1, 1963-1998 Variability2
Correlation3
Area vs. Yield Production Area harvested Yield
Maize 7.7 5.6 3.2 0.53 Soybean 6.8 6.2 2.8 0.03 Cassava 5.1 4.5 3.0 -0.12 Sweet potato 4.7 4.5 2.6 -0.19 Groundnut 4.2 3.1 2.7 0.04 Rice 2.6 1.7 1.7 0.18
1Myanmar, Thailand, Laos, Cambodia, Viet Nam, Malaysia, Indonesia, the Philippines, Australia, Fiji. 2Standard deviation of percentage departure from the 5-year moving average.
3Correlation coefficient of percentage departure from the 5-year moving average.
Source: Author’s calculation.
Table 5. ENSO sensitivity1 by crop in the region, 1963-1998
Production Area harvested Yield
Maize 0.78** 0.69** 0.68** Soybean 0.49** 0.49** 0.11 Rice 0.35* 0.52** 0.02 Sweet potato 0.21 0.17 0.09 Groundnut 0.14 0.19 -0.01 Cassava -0.01 -0.07 0.09
1Correlation between percentage departure from the 5-year moving average and SOI (Jun-Sep in
concurrent years).
** Significant at the 1 per cent level. * Significant at the 5 per cent level. Source: Author’s calculation.
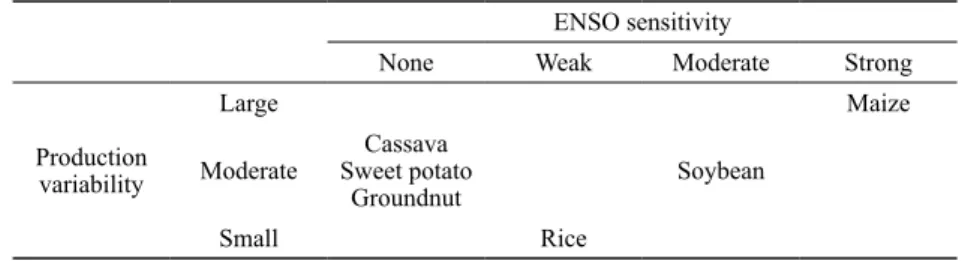
Productive variability and ENSO sensitivity are summarized in Table 6. As expected, the more ENSO sensitive, the more variable the production. Exceptions are root crops (cassava and sweet potato) and groundnut. These crops are moderately variable in production but ENSO non-sensitive. The common characteristics of these crops are drought tolerance, especially root crops, and they are widely grown under sub-optimal land and climatic conditions with traditional technologies (Horton, 1988; Wallis and Byth (eds.), 1987). Cassava, known as famine reserve, is cultivated in a substantially wide range of agro-ecological settings at an altitude of sea level to 2,000 masl and under annual rainfall of 500 mm to tropical rainforest. It can withstand 5-month dry periods (Horton, 1988). Thus, production variability of these crops is more attributed by the latter characteristic rather than the ENSO impact. However, it should also be noted that their production is not fully represented in the official statistics since they are mainly grown as a second or third crop in a mixed cropping system for home consumption.
Table 6. Productive variability and ENSO sensitivity by crop in the region ENSO sensitivity
None Weak Moderate Strong
Production variability
Large Maize
Moderate Sweet potatoCassava
Groundnut Soybean
Small Rice
Compiled from Table 2.4 and 2.5.
5. Summary and Conclusions
The El Nino event has been increasingly frequent in the last 40 years. Compared to production loss in non-El Nino years, that in El Nino years was characterized by: i) Absolute magnitude (El Nino years: 7 per cent vs. non-El Nino years: 3 per cent); ii) Simultaneity of both yield and area decline (production loss in non-El Nino years was mainly caused by yield decline); and iii) Single year phenomenon with recovery of production in the following year.
99 Historical Occurrence of El Nino and its Impact on Food Crop Production at a Regional Level in Asia and the Pacific the area harvested and yield, followed by soybean which was significantly sensitive to ENSO in terms of area but not yield. Rice was weakly affected by ENSO. Cassava, sweet potato and groundnut were not significantly affected by ENSO, though their production variability was larger than that of rice. Enhancement of the production stability of maize and soybean and crop diversification by incorporating root crops may improve the stability of food crop production in the region.
Production of legumes and root cops in the region is stagnant or declining despite increasing demand. The roles of these secondary crops are summarized as follows. Legumes are important supplements to a cereal-based diet, a low cost alternative to protein, a supplemental source of green vegetables, animal feed, fuel material (beanstalk and pod), a source of soil nutrients through nitrogen fixation, and a disease control in crop rotation (McWilliams, J.R. and Dillon, J.L., 1987). Root crops are also known as security food, an important income source for resource poor farmers in marginal areas, cheap food for the urban poor, animal feed, and fuel material (cassava stem) (Scott et al., 2000). Processing and marketing these crops provides job opportunities for the landless and rural women. The gap of root crop yield between the developed and developing countries remains large, suggesting a high potential for production increases in the latter without area expansion. Prospects for yield increases of root crops appears much greater than those of major cereals, many of which are already trapped on a yield plateau (TAC, 1997). Thus, promotion of legumes and root crops contributes to reducing climatic risk of rainfed agriculture, improving food security, and poverty alleviation in a cost effective manner.
Acknowledgment
This paper was originally published as “Occurrence of El Nino and its impact on food crop production at the regional Level” in Yokoyama, S. and Concepcion, R. N. eds. (2004) Integrated Report of the Project “Stabilization of Upland Agriculture and Rural Development in El Nino Vulnerable Countries”, CAPSA Working Paper, No. 77, UNESCAP CAPSA, Bogor, Indonesia. Reference
Ballard, C., 2000. Condemned to repeat history? ENSO-related drought and famine in Irian Jaya, Indonesia, 1997-98. In R.H. Grove and J. Chappell (eds.) El Nino: History and crisis, Cambridge, UK: The White Horse Press.
Bourke, R.M., 2000. Impact of the 1997 drought and frosts in Papua New Guinea. In Grove, R.H. and Chappell, J. (eds.) El Nino: History and crisis, Cambridge, UK: The White Horse Press.
De Datta, S.K., 1981. Principles and Practices of Rice Production, New York: John Wiley and Sons.
Fagan, B., 1999. Flood, Famines and Emperors, New York: Basic Books.
Glantz, M.H., 1996. Currents of Change: El Nino’s impacts on climate and society, Cambridge, UK Cambridge University Press.
Gommes, R., 1998. Climate-Related Risk in Agriculture. A note prepared for the IPCC Expert Meeting on Risk Management Methods.
(http://www.fao.org/waicent/faoinfo/sustdev/EIdirect/agroclim/concepts.htm). Gommes, R., Bakun, A. and Farmer, G., 1998. An El Nino Primer.
(http://www.fao.org/WAICENT/FAOINFO/SUSTDEV/EIdirect/EIan0008.htm).
Horton, D., 1988. Underground crops: Long-term trends in production of roots and tubers, AR, USA: Winrock International Morrilton.
IPCC (Intergovernmental Panel on Climate Change), 2001. Climate Change 2001: Impacts, Adaptation and Vulnerability, Cambridge, UK: Cambridge University Press.
IRRI (International Rice Research Institute), 2002. Rice fact. (http://www.irri.org/Facts.htm#irrigated).
McWilliams, J.R. and Dillon, J.L. 1987. Food legume crop improvement: Progress and constraints.
In Wallis, E.S. and Byth, D.E. (eds.) Food legume Improvement for Asian Farming Systems.
Proceedings of an international workshop, Khon Kaen, Thailand, 1-5 September 1986. Australian Centre for International Agricultural Research.
MEI index (update 3 June 2002). (http://www.cdc.noaa.gov/~kew/MEI/table.html).
Naylor, R., Falcon, W. and Zavaleta, E., 1997. Variability and Growth in Grain Yields, 1950-94: Dose the Record Point to Greater Instability? Population and Development 23(1).
Naylor, R., Falcon, W., Wada, N. and Rochber, D., 2002. Using El Nino Southern Oscillation climatic data to improve food policy planning in Indonesia. Bulletin of Indonesian Economic Studies 38(1).
Nicholls, N. and Beard, G., 2000. The application of El Nino-Southern Oscillation information to seasonal forecasts in Australia. In Wilhite, D.A. (ed.). Drought: Volume I A Global Assessment, London and New York: Routledge.
Podbury, T., Sheales, T.C., Hussain, I. and Fisher, B.S., 1998. Use of El Nino climate forecasts in Australia. Amer. J. Agr. Econ. 80(5).
Scott, G.J., Rosegrant, M.W. and Ringler, C., 2000. Roots and Tubers for the 21st Century: Trends,
Projections and Policy Options. IFPRI and CIAT, Food, Agriculture, and Environment Discussion Paper 31.
Stone, R. and Auliciems, A., 1992. SOI phase relationship with rainfall in eastern Australia. Int. J. Climatology 12.
Tawang, A., Ahmad, T.A.T. and Abdullah, M.Y., 2002. Stabilization of upland agriculture under El Nino-induced climatic risk: Impact assessment and mitigation measures in Malaysia.
101 Historical Occurrence of El Nino and its Impact on Food Crop Production at a Regional Level in Asia and the Pacific Working Paper No. 61, Bogor, Indonesia: CGPRT Centre.
Technically Advisory Committee (TAC), 1997. Report on the inter-centre review of root and tuber crops research in the CGIAR, Washington, D.C: Consultative Group on International Agricultural Research (CGIAR).
Trenberth, K.E., 1997. Definition of El Nino. Bulletin of American Meteorology Society, August 1, 1997.
Wallis, E.S. and Byth, D.E. (eds.), 1987. Food legume improvement for Asian Farming Systems. Proceedings of an international workshop, Khon Kaen, Thailand, 1-5 September 1986. Australian Centre for International Agricultural Research.
Wolter, K. and Timlin, M.S., 1993. Monitoring ENSO in COADS with a seasonally adjusted principal component index. In Norman, Proceedings of the 17th Climate Diagnostics Workshop, p. 52-57. OK, NOAA/N MC/CAC, NSSL, Oklahoma Clim. Survey, CIMMS and the School of Meteor, Univ. of Oklahoma.
Wolter, K. and Timlin, M.S., 1998. Measuring the strength of ENSO: How dose 1997/98 rank? Weather, 53:315-324.
World Meteorological Organization, 1999. The 1997-1998 El Nino Event: A Scientific and Technical Retrospective.
Yoshino, M., Urushibara, K. and Suratman, W., 2000. Agricultural production and climate change in Indonesia. Global Environ. Res. 3(2).