関西学院大学リポジトリ
134
0
0
全文
(2) Contents. General Introduction. Scope of this thesis 1. Surface-enhanced Raman scattering 5 Surface-enhanced Raman spectroscopy of proteins 8 Protein adsorption phenomenon on a solid-liquid interface 11. Chapter 1: Label-free Rapid Semi-quantitative Detection ofProteins Down to. Submonolayer Coverage by Using Surface-Enhanced Raman Scattering of Nitrate Ion. Material and Methods 25 Results and Discussion 29. Chapter 2: Experimental Parameters for SERS of Nitrate Ion for Labe1-free Semi-quantitative Detection of Proteins and Mechanism for Proteins to Form SERS Hot-sites: A SERS Study.
(3) Material and Methods. 48. Results and Discussion. 52. Conclusion. 65. References. 67. Chapter 3: Co-adserption of Electrolyte and Protein to Ag Colloid Observed. by. Surfaceenhanced Raman Scattering Abstract. 87. Introduction. 88. Material and Methods. 89. Results and Discussion. 91. Conclusion. 96. References. 97. Chapter 4: Surface-enhanced Raman Scattering ofBinary Mixtures ofProteins Abstract. 107. Introduction. 108. Material and Methods. 109. Results and Discussion. 111. Conclusion. 116. References. 117.
(4) Acknowledgements. 128. List of Publications. 130.
(5) List ofAbbreviations SERS. :. Surface-enhanced Raman scattering. Mb. :. myoglobin. apoMb. :. apomyoglobin. cyt c. :. cytochrome c. HSA. Human serum albumin. IR. Infrared. NMR. :. Nuclear Magnetic Resonance. Trp. Tryptophan. Tyr. Tyrosine. Phe. Phenylalanine.
(6) General Introduction 1. Scope ofthis thesis. There are two main purposes ofthis study. One purpose is to develop a. novel method for quantitative detection of proteins by use of surface-enhanced Raman scattering. Another purpose is to explore the. adsorption mechanism of proteins on Ag colloid by use of surface-enhanced Raman scattering. Ramari spectroscopy is a useful technique to detect protein structure and there are several advantages to use Raman spectroscopy.i' 2 First of all,. the sample for Raman spectroscopy can be dissolved in water, which is similar to physiological condition.2 Moreover, comparing to Infrared (IR). spectroscopy, much more bands suggesting structure information appear in Raman spectra and the intensities of these bands can be strong and. sharp. Therefore, Raman spectra of proteins can give abundant information for protein structure. Thanks to a big advance in the quality. of Raman equipment in recent 15 years, including appearance of high. sensitive CCD, spectrometer giving monochromic light source, near-Infrared laser system and optical fiber, Raman spectroscopy has played an important role in structure analysis.2. However, one disadvantage in protein detection by use of Raman spectroscopy is that the samples need high concentration of proteins.. Generally speaking, 10-100 mg proteins without chromophores are. 1.
(7) needed. i'2Fortunately, it was found that Raman scattering can be highly. enhanced at nano-roughed metal surface, which is called surface-enhanced Raman scattering (SERS). 3-6 Due to its great enhancement of Raman signal, SERS has been used to detect a variety of biomolecules including lipids, carbohydrates, DNA, peptides and proteins with a low detection of 1imit. 3'ii. A number of SERS spectra of proteins have been published.iO'22 However, quantitative study of proteins by use of SERS is lack of reporting, except for one work in our group.i5 Moreover, experimental parameters for sample preparation are poorly reported in previous studies.. And also the adsorption mechanism ofprotein on Ag surface has not been well investigated by use ofsERs. iO'22. Chapter 1 describes a novel method developed for protein detection. used through the studies of this thesis. A heat-induced SERS-sensing method was used to selectively enhance the peak at 1049 cm'i originating. from N03- for detection of proteins. A bell shape variation in the. concentration dependent study was found, which can be used for semi-quarttitative detection of proteins. The detection limit for lysozyme and insulin is 1Ony9M and 1O-8M, respectively.. Chapter 2 describes effects of experimental parameters on SERS intensities ofN03' and proteins by use ofthe SERS method established in. Chapter 1. The results have shown that strong SERS signal can be. 2.
(8) obtained at pH 4.0, using Ag colloid prepared with reduction time of 15. min (the average size of Ag nanoparticle is 56.5 nm), diluting prepared. Ag colloid by a factor of2 by use ofa 5 mM citrate buffer, using 6 mM NaN03 and drying a sample at 100 OC, respectively. Based on the results,. two possible mechanisms for proteins to form SERS hot-sites during the sample preparations are proposed. Samples prepared by the heat-induced SERS method are so stable that the samples prepared by this method can be used as a standard and transferred to different laboratories for direct. comparlson.. One of complexities of SERS phenomenon involves in protein adsorption on the surface of the metal substrate. A number of SERS spectra of proteins without resonant chromophores have been published, iO-22 and it has been found that in practice, an electrolyte is needed during. sample preparation to obtain intense SERS signals from a protein.3-7. However, adsorption mechanism of an electrolyte and a protein to Ag colloid is still vague, which inhibits precise sample preparation for detection ofprotein by using SERS. A direct observation ofco-adsorption. of a protein and an electrolyte to Ag colloid by using SERS spectra of polypeptide and electrolyte has not been reported. In chapter 3, we have. investigated co-adsorption of N03' and lysozyme to Ag colloid by using the SERS method established in chapter 1. The result demonstrates that. by using different experimental conditions, co-adsorption of lysozyme. 3.
(9) and N03' on Ag colloid and selective elimination of N03- adsorption can. be obtained, respectively. The missing of N03- band on SERS spectrum suggests that competition adsorption between protein and electrolyte maybe exist in the present study. On the basis of the result, possible. adsorption mechanism of protein and electrolyte on Ag colloid are discussed.. In previous studies of proteins, one sample contains only one kind of. protein. iO-22 As SERS is a complex phenomenon including chemistry of. interface adsorption, caution should be taken for inference of spectroscopic behavior of protein mixtures from the result obtained by. use of samples containing single kind of protein. Also, one goal for application of SERS is to detect biological samples such as cells, plasma. and tissues which usually contain protein mixtures.i-7 However, SERS of protein mixtures with a quantitative composition has not been reported. A. large gap exists between the SERS studies of single kind of protein and complex biological samples. For these reasons, we have explored binary. mixtures of proteins such as mixture containing apomyoglobin (apoMb). and lysozyme by use of SERS spectroscopy. For the protein mixtures without chromophores, the SERS signals increase with the increase in the. concentrations of apoMb and insulin. The high-wavenumber region (3235-2825 cm-') shows a similar result to that for fingerprint region (1720-600 cm-i). In the study of the mixtures of the proteins containing. 4.
(10) chromophores, the SERS spectra display only bands due to chromophore. (heme), and the SERS intensities increase with increasing in Mb concentration. As for the samples in which one protein contains chromophore and the other protein does not, only the pattern of chromophore (heme) can be observed in the spectra, and the intensities of. these SERS spectra show a bell shape variation with the increase in the. concentrations of Mb and Cyt c. These studies indicate a complexity in. the detection of proteins by use of SERS spectroscopy. These findings would be usefu1 for SERS application to biological samples containing proteln mlxtures.. 2. Surface-enhancedRamanscattering Surface-enhanced Raman scattering (SERS) was first discovered in 1977 and since then it has been demonstrated as a powerfu1 technique for. selective and sensitive detection of molecules.i SERS phenomenon invQlves in a large enhancement (in the order more than 106) in Raman intensity when a molecule adsorbed on nanostructured surface of coinage. metal.i' 2 There are two mechanisms contributing to the enhancement signal, electromagnetic mechanism and chemical mechanism. Generally. speaking, magnetic mechanism can give 104 Raman enhancement while chemical mechanism is responsible to 102 enhancement.i Electromagnetic mechanism is due to the polarization of metal particles, resulting in the. 5.
(11) enhancement of electromagnetic field to interact with incident light.. Roughed surface in a nano scale is necessary for the enhanced electromagnetic field, and metal colloid is an example of this kind of roughed surface. Junctions between adjacent colloid nanoparticles can cause great enhancement of local magnetic field (in the order of loi4-i5) which is usually called hot-site.i. Chemical (or called charge transfer) mechanism is related to charge transfer of adsorbate on metal surface. The molecular orbitals of the adsorbate can be broadened by interactions with metal. 2 Therefore, only the first layer coverage ofthe adosorbate can obtain chemical mechanism.. Furthermore, it has been found that only some groups can harvest obvious. enhancement due to chemical mechanism. Namely, chemical mechanism is analyte structural dependent. i'2 However, there are still many problems. need to be solved for chemical mechanism, and this mechanism has not. been completely accepted in the SERS community. i'2A scheme of the electromagnetic mechanism ofSERS is displayed in Scheme 1. The peak on the UV-visible spectrum of metal nanoparticles is related. to plasmon resonance of the nanoparticles (Scheme 2). Adsorption of analyte on metal nanoparticles induces aggregation of nanoparticles,. which can be reflected as red shift of plasmon peak on UV-visible spectrum. Therefore, except for SERS spectra, UV-visible spectroscopy is also often used to monitor the aggregation of metal nanoparticle.3'5 We. 6.
(12) will discuss this point in Chapter 1, 2 and 3.. There are a variety of methods to prepare substrate for surface-enhanced Raman spectroscopy.23-29 preparation of metal nanoparticles and roughed electrode surface is the most often used method. Assembling nanoparticles on a structure surface and lithography. techniques have been developed in recently years.24 However, among these methods, metal nanoparticles is the simplest one to prepare. 24' 26. For example, reduction of AgN03 by citrate ion at 1000C results in Ag colloid which can be used directly for SERS study and the particle size. can be monitored by UV-Visible spectroscopy. As one of our research purposes is to develop a simple and rapid protocol for SERS detection, preparation of metal colloid was chosen in the present work. Because of much lower enhanced factor by use ofAu colloid is obtained than that by. use of Ag colloid, 23 we select Ag colloid as the SERS substrate. In Chapter 2, we report preparation of different sizes of Ag colloid by controlling reduction time ofAgN03.. Sodium citrate and NaBH4 are two often used reagents for reduction. of AgN03. Sodium citrate was selected in the present work for two reasons. First, Ag colloid prepared with sodium citrate is very stable, even. for several months after preparation.4 Second, Ag colloid prepared by citrate sodium usually gives stronger enhanced factor for SERS signal, comparing to Ag colloid prepared with NaBH4.i'7• 23• 28. 7.
(13) 3. Surface-enhanced Raman spectroscopy ofproteins. Proteins in organisms play diverse roles such as structural maintenance, transportation, signal transduction and catalysis, and disorder of proteins is related directly to diseases.30 After the success of. Human Genome Project (HGP), a large-scale investigation of proteins. named Human Proteome Project (HPP) has been proposed.3i Most proteins exist in vivo at a very low concentration. Traditional indentification techniques for proteins such as electrophoresis, mass spectrometry (MS) consume a lot of time, work and reagent. Therefore, developing a simple, rapid and ultra-sensitive method to detect proteins. has recently been paid much attention in SERS community.6-i2. Furthermore, low Raman scattering signal and appearance of fluorescence are two problems in application of normal Raman spectroscopy and can be fortunately solved by SERs.i'6. Proteins can be divided into two classes. One class ofproteins contains. chromophore groups (hereafter, we call it Protein Class I) whereas the other class does not (we call it Protein Class II). This classification is also. important for protein detections by SERS. As a chromophore group within a protein usually yields a resonant Raman contribution in the order. of lo2-lo3, 32•33 which is not experienced by a polypeptide part. Namely,. only the signal of chromophore group appears in a SERS spectrum of. 8.
(14) protein Class I. For this reason, it is much more difficult in practice to. obtain high-quality SERS signal from Protein Class II than from Protein Class I.. Except for low Raman cross section, another difficulty for detecting Protein Class II by SERS is that protein structure is much more complex. comparing to other biomolecules. Because a protein molecule has a three-dimensional structure and is composed of20 different amino acids,. the surface characters of proteins vary significantly from protein to protein.20' 2i These surface characters include net charge (isoelectric. point), charge distribution, distribution of hydrophobic/hydrophilic. groups and distribution of active groups binding to a roughed metal surface (Scheme 3). It is known that surface characters are critical for. protein adsorption on a roughed metal surface to give strong SERS signal.33. Label-free and Raman dye-label are two types of SERS-based techniques for protein detections (Scheme 4).34 Label-free SERS of proteins analyzes the SERS spectra due to proteins directly whereas. Raman dye-labeled SERS focus on SERS signal from Raman dye conjugated to proteins. Strictly speaking, SERS spectra obtained by use oflabeled Raman dye are not due to protein, but due to dye. Moreover, to. study adsorption phenomenon ofproteins on Ag surface, it is not easy (if. not impossible) to obtain protein structure information by spectra of. 9.
(15) labeled dye, For these reasons, the study in the present thesis focuses on. label-free SERS methods,.. SERS spectra ofproteins usually share most ofthe bands appearing in corresponding normal Raman spectra ofproteins. In the present work, we. mainly use proteins without chromophores as SERS samples, and SERS spectra ofthese protein bands feature bands from peptide and amino acids. (Scheme 5). Bands of amide I (1640-1680cm") and III (1230-1300 cm-') and v (CC) (980-900 cm-') originate from the main chain ofpeptides.iO' " Aromatic amino acids are also strong including bands of Trp (1579, 1359, 1340, 761 and 538 cm-'), Tyr (853, 829 and 646 cm-'), Phe (1007 cm-i), v. (CS) ( 750-600 cm-') and v (SS) ( soo-sso cm"). 'O• ". However, some of the SERS bands still cannot match to those of normal Raman spectra. For example, amide II is not active on normal. Raman spectra whereas it often appears in the SERS spectra. iO Furthermore, bands due to electrolyte radicals may also appear in the. SERS spectra of proteins, for which we will discuss in detail in the chapter 1 and 2.. SERS spectra of proteins with chromophores are more complex than. those of proteins without chromophores due to appearance of chromophore bands, except for bands from peptides and amino acids.i'2 In the present study, laser with excitation wavelength of785 nm was used. 10.
(16) as a light source, which could give a pre-resonant effect for the chromophore. Therefore, bands from chromophore as well as peptide/. amino acids can both be found in the SERS spectra. The band assignments for SERS spectra of proteins with chromophores can be found in chapter 4.. 4. Protein adsorption phenomenon on a solid-liquid interface. One prerequisite to obtain SERS signal is adsorption of analyte on surface of the substrate. 33 Without adsorption, no SERS signal of the. analyte can be obtained. Therefore, SERS involves in adsorption phenomenon. Usually, protein can adsorb on a solid-liquid interface by. Coulombic interactions, H-bonding, charge-transfer and hydrophobic interactions.35 Opposite charges of Ag colloid surface and proteins can. induce force for adsorption. H-bonding is a donor-accepter effect in which water molecule would participate. Charge-transfer is mainly due to z-z interaction in water. Trp usually give a strong charge-transfer effect.. Hydrophobic interaction involves motion of ordered water around apolar groups in protein, which is related to variation of entropy.35'37 changing. in substrate surface parameters including size, chemistry and curvature could control adsorption characteristics of proteins. Generally speaking,. proteins can interact with the surface efficiently by rearrange its. conformation to obtain an optimized binding manner on a surface or. 11.
(17) interface.37-44. In this thesis, special attention was paid to the Coulombic interactions.. It has been found that the adsorption procedure involves a double-layer of. adsorbates.35-38 Namely, there exists a layer of adsorbed electrolyte. between a layer of adsorbed protein and an interface. Recently, this theory ofprotein adsorption has been discussed in detail in the systems of Au colloid and Au surface.36' 38 In this thesis, both bands due to protein. and electrolyte can be observed in the SERS spectra, suggesting that lysozyme and N03' co-adsorb on Ag colloid. Therefore, it is very likely that the adsorption scenario in the present study follows the double-layer mechanism. 36, 38, 41, 44. Re fe rences. 1 Surface-Enhanced Raman Scattering: Physics and Applications. K. Kneipp, M. Moskovits and H. Kneipp eds, Springer. Berlin, Germany,. 2006 2 R. Aroca Surface-Enhanced Vibrational Spectroscopy, John Wiley & Sons, Ltd. Chichester, UK, 2006 3 T. Itoh, A.Sujith, Y. Ozaki. In Frontiers ofMolecular Spectroscopy, Ed. J. Laane, Elsevier , Amsterdam, 2009 4 S. E. J. Bell, N. M S. Sirimuthu, 1. Am. Chem. Soc. 2006, 128, 15580. 12.
(18) 5 Y. Wang, H. Wei, B. Li, W. Ren, S. Guo, S. Dong, E. Wang, Chem.. Commun. 2007, 5220 6 X. X. Han, G. G. Huang, B. Zhao and Y. Ozaki, Anal. Chem. 2009, 81,. 3329 7 S. Stewart, P. M. Fredericks, Spectrochim Acta, Part A. 1999, 55,. 1615 8 V.P. Drachev, M.D. Thoreson, E.N. Khaliullin, V.J. Davisson , V.M. Shalaev. J. Phys. Chem. B 2004, 108, 18046. 9 D. Gobind, M. Federico, G. Francesco, D. A Francesco, K.H. Mohan,. C. Patrizio, L. Carlo, C. Giovanni, D. F. Enzo. Biosens and Bioelectron 2009, 24, 1693. 10 G.V.P Kumar, R. Selvi, A. H Kishore, T. Kundu, C. Narayana, 1. Phys. Chem. B 2008, 112, 6703. 11 I. Pavel, E. McCarney, A. Elkhaled, A. Moni11, K. Plaxco and M. Moskovits, J. Phys. Chem. C, 2008, 112, 4880 12 E. Podstawka, Y. Ozaki and L.M. Proniewicz, Appl. Speetrosc, 2004,. 58, 1147 13 A. Otto, J. Raman Spectrosc, 2002, 33, 593. 14 G. G. Huang, X. X. Han, M. K. Hossain and Y. Ozaki, Anal.Chem, 2009, 81, 5881 15 C. H. Munro, W. E. Smith, M. Garner, J. Clarkson and P.C. White,. Langmuir 1995, 17, 3712. 13.
(19) 16 M. F. Mrozek and M. Weaver, Anal. Chem, 2002, 74, 4069 17 B Yu, N.; Jo, B.H. Arch. Bioehem. Biophys. 1973,156, 469-474. 18 Chen, M. C., Lord, R. C., Mendelsohn. R. Biochim. Biophys. Acta. 1993, 328, 252 19 C. Haynes, W. J. Norde, Colloid lnterf Sci, 1994, 169, 313. 20 Munro, C. H., Smith, W. E., Garner, M. Clarkson, J White, P.C. Langmuir, 1995, 11, 3712. 21I. T. Shadi,;B. Z. Chowdhry, M. J. Snowden,R. Withnall, Appl. Spectrosc, 2000, 54, 384 22 S. E. J. Bell, N. M. S. Sirimuthu, Chem. Soc. Rev. 2008, 37, 1012. 23 M. J. Banholzer, J. E. Millstone, L.D. Qin, C.A. Mirkin, Chem. Soc.. Rev., 2008, 37, 885. 24 X. M. Lin,Y. Cui Y, Y. H. Xu, B. Ren, Z. Q. Tian, Anal. Bioanal.. Chem., 2009, 394, 1729 25 W. E. Smith, Chem. Soc. Rev., 2008, 37, 955 26 M. D. Porter, R. J. Lipert, L. M. Siperko, Chem. Soc. Rev., 2008, 37,. 1OO1 27 S. J. Bell, N. S Sirimuthu, Chem. Soc. Rev., 2008, 37, 1012. 28 Z. Q. Tian, B. Ren, Li J. F. Z. L. Yang, Chem. Comm. 2008, 34, 3514 29 B. M. Bright, D.G. Walter, M. D. Musick, M. A.Jackson, K. J. Allison,. M. J. Natan, Langmuir, 1996, 12, 810. 30 D. L. Nelson, M. M. Cox, Lehninger Principles ofBiochemistry, 4th. 14.
(20) edt., W.H. Freeman and Company, NewYork, 2005 31 R. M. Twyman, Princi les ofproteomics. BIOS Scientific Publishers,. NewYork, 2004 32 K. Faulds, R. E. Littleford, D. Graham, G. Dent, W. E. Smith. Anal.. Chem. 2004, 76, 592 33 W. E. Smith, Chem. Soc. Rev. 2008, 37, 955 34 X. X. Han, B. Zhao, Y. Ozaki, Anal. Bioanal. Chem., 2009, 394, 1719. 35J. D. Andrade,V. Hlady, Protein Adsorption and Materials Biocompatibility in Advances in Polymer Science Vol 79, Springer,. Berlin, 1986. 36 C. McLaughlin, D. MacMillan, C. McCardle, W. E. Smith, Anal. Chem, 2002, 74, 3160 37 C. A. Haynes, W. Norde, Colloids. Surfaces B.' Biointerfaces 1995, 2,. 517 38 R. G. Wilhelm, J. H. /yvind, D. H. Ann-Mari, V. Sondre, 1. Phys.. Chem. B, 2007, 111, 14329 39W. Norde, A.C. I . Anusiem, Colloids Surf 1992, 66,73 40P. Roach, D. Farrar, C. C. Perry, J.Am Chem.Soc. 2005, 127, 8186 41P. Roach, D. Farrar, C. C. Perry, J.Am. Chem.Soc. 2006, 128,3939. 42P. Billsten P. O. Freskgard, U. Carlsson, B.H. Jonsson, H. Elwing, ]FEBS Lett. 1997, 402,67.. 15.
(21) 43M. F. M. Engel,A. Visser, C.P. M.. VanMierlo, Langmuir,. 2004,. 20,553O 44K. Kuwajima, FASEBI,. 1996, 10,102. 16.
(22) nanoparticle. incident light. nanoparticle with embanced electromagnetic field. (a). --. Aggregated nanoparticles with great enhanced local electromagnetic field. (b). tttttt. ttt. v'. (,)manomati".A. SERS. Scheme 1. Schemes of a SERS emission from an analyte molecule adsorbed on surface of aggregated nanoparticles; (a) Interaction of incident light with nanoparticle induces enhanced eletromagnetic field of the nanoparticle; (b) Adjacent nanopartiCle results in great enhanced local. elctromagnetic field, which is usually called hot-site; (c) Analyte adsorbed in the hot-site gives SERS signal.. 17.
(23) Agletal Nanostructure. []<iilii)))ii[i. Plasmon Resonace e.s. SERS 9•. ! e.4. s-b. a o.,. 2. 2 o.2. e. e. -c. o.t. 040300. 60 mn. 2 4oo soo 6oo 7oo eoo. Wavelength (nm). E t6oe t4oo t2oo tooo soo 6oo 4oo Raman shift (cm"). Scheme 2. Spectra due to plasmon resonance and SERS can be used to. study SERS phenomenon.. 18.
(24) (a). (b). Scheme 3. Molecular graphic images of Lysozyme (a) distribution of residues at the protein surface (b) polypeptide backbone showing ct-helix,. P-sheet and random coil.. 19.
(25) (a) Labe-firee SERS. incident Iaser. a. Ag nanopaniGle. e. e protem. SERS (b) SERS with labelled Raman dye incident laser. Jl" Au nanoparticle . e antigen. e. + Raman dye SERS. v. antibodies. Scheme 4. Examples of(a) Label-free and (b) Raman dye-labeled SERS ofproteins by using Ag or Au colloid as a SERS substrate.. 20.
(26) =o-=. e. ea. g::NANve'. .S!2,,. e6. = o = -= N E. /p. p.. i!. •illib. 9-. -.--. .-. o5Dg. 9'. !'//';thits1-VPNN. Rcoti->Amoeoco. ie-iP. es. coov). :. Y. g m. 6 cv,i). Re. >e. $. nt. 1600 1400 1200 1000 800 600 400 Raman shift (cm"). Scheme 5. A SERS spectrum of lysozyme and assignments ofprominent bands.. 21.
(27) Chapter 1. Label-free Rapid Semi-quantitative Detection of Proteins Down. to Submonolayer Coverage by Using Surface-Enhanced Raman Scattering ofNitrate Ion. 22.
(28) Abstract. In the present study, we have developed a novel heat-induced SERS-sensing method that can selectively enhance the peak at 1049 cm'i originating from N03' for detection of proteins without any additional resonant effect. A bell shape variation in the concentration dependent. study was found, which can be used as a semi-quantitative method for protein detection. The detection limit for lysozyme and insulin is 10-9M and 10-8M, respectively. This method is simple, rapid, reproducible and label-free. The laser power is low (6 mW) and the exposure time is short (20 s), which meets the need for routine analyses. The intensity and the. sharpness of the N03- peak suggest its potential in more extended applications. The bell shape indicates the potential of this method in exploring adsorption phenomenon of a protein on a colloidal interface.. 23.
(29) Introduction. Surface-enhanced Raman scattering (SERS) has recently proved its potential in ultra sensitive detections of biomolecules. i'6 However, despite a great number of studies done in this field, label-free detections. of proteins which do not contain resonant chromophores, still remain a challenge.. By use of electrochemically roughened silver surfaces,7 evaporated silver films 8 and periodic nanostructures using e-beam lithography, 9 label-free non-resonant SERS spectra were obtained for several kinds of. proteins. However, a special equipment is needed to make these SERS substrates, and the preparation of substrates are rather time-consuming. Therefore, their application scope is limited to professional investigations. rather than to routine analyses ofproteins. Another method to obtain high. quality SERS spectra of proteins is to use Raman microscopy with or without an immersion objective.iO' ii However, the microscopic protocol. is also not suitable for ordinary assay of multiple samples. The most. practical SERS method for routine analyses of proteins is using macroscopic Raman with chemically-reduced silver colloid. Podstakawa. et al.i2 used this method to detect a number of proteins. However,. obtained SERS spectra by this method suffer from strong amorphous carbon background centered at 1350 and 1595 cm-i which often occurs. '. 24.
(30) when visible laser light is used as an excitation source.i3 So far, no. accurate quantitative study of proteins by non-resonant SERS has been reported. To our best knowledge, the only one relative quantitative study. was realized by our group.6 Because proteins without resonant chromophores have, in general, low Raman cross sections, the progress in label-free detections of this class of proteins is rather slow. The major. advantages of the method used in the present study exist in its high sensitivity and routine analyses for semi-quantitative study.. We have recently proposed a heat-induced SERS sensing method for rapid detection of a peptide, glutathione.i4 In this method, 30 pL glutathione solution was heated on an aluminum pan plate at 1000C for 3. min to obtain a dry film of glutathione, and then, its SERS signal was. acquired. Comparing to conventional SERS methods, this protocol enables one to obtain much larger SERS enhancement without loss of vibrational information about an analyte. In the present study, the application of this heat-induced SERS method is extended to protein detection. In the present study, NaN03 is used as an electrolyte instead of. the most common used hydrochloride salt since Cl- binds tightly to silver colloid, 5 and it is thus difficult for an analyte to competitively adsorb on. the silver surface to yield strong SERS signal.5'6 First, a citrate buffer. containing 6 mM NaN03 was mixed with a Ag colloid solution. Then, a. protein was added to the mixture followed by drying the mixture at. 25.
(31) 1000C for SERS measurement. Thanks to this highly sensitive method with combination oflarge Raman cross section ofN03-. , semi-quantitative. detection of proteins can be achieved down to 10'9M for lysozyme and 1O-8 M for insulin, respectively.. Material and Methods. Materials Silver nitrate sodium citrate and citrate acid were obtained from Wako. '. Co. Ltd. (Osaka, Japan). Lysozyme from chicken egg white and insulin. from porcine pancreas were from ICN Biomedicals Inc (Aurora, Ohio) and Sigma (St Louis, MO, USA), respectively. All the materials were used without further purification. Eppendorf tubes were purchased from. Eppendorf Company (Hamburg, Germany). Triply distilled water was used throughout the study.. Preparation ofsilver colloid The citrate-reduced silver colloidal solution used in this study was. synthesized according to a modified Lee and Meisel method. i' 2 In brief,. 90 mg ofsilver nitrate was dissolved in 500 ml ofwater and was refluxed to boil under stirring. Ten milliliters of 1O/o (w/v) sodium citrate was. added to the solution right after the boiling started. The solution was kept. 26.
(32) boiling for 15 min. Then, the silver colloidal solution was placed in an ice. bath to stop immediately the reduction. An UV absorption peak ofthe silver colloid was observed at 445 nm. This batch of silver colloid was. aged for 6 months at 4 OC before used. All the study in the present work used this batch ofcolloidal silver, except for the semi-quantitative study. of insulin in Figure 3, where a new batch ofsilver colloid (UV absorption peak is at 431 nm) was used freshly (within 24 h after preparation).. SERS and normal Raman measurements All SERS and normal Raman spectra were measured by a compact macroscopic Raman spectrometer (Xex= 785 nm), HoloProbe VPT system manufactured by Kaiser Optical Systems (Ann Arbor, MI, USA). The spot size oflaser beam at the sample position was 1O pm. The laser power. was 6 mW at the sample position, and the exposure time for each SERS measurement was set to be 20s with 1 accumulation. As for SERS spectra, each datum indicates an average of 15 measurements (in 3 plates, each plate was measured at 5 different points) and each error indicates the standard deviation.. UVabsorption measurements Every absorption spectrum was obtained 5 min after addition of protein solution or pure water (control) into silver colloid with a. 27.
(33) Shimadzu UV-31O1 UV/vis spectrometer at room temperature.. Calculation of lysoayme concentraion for monolayer coverage of colloidal silver. The UV plasmon peak of the prepared silver colloidal particles is at 445 nm, corresponding to the size of60 nm in average. By approximation of the silver colloid to an ideal sphere, the cross section of each silver. particle, E was calculated to be 1.264 Å~10-iO cm2 using Mie theory. According to the equation. absorption == s (cm2) Å~ particle number ( cm-3) Å~ length ofa UV cell. used (cm), the number of silver particle was obtained to be 5.55 Å~10iO cm'3. This silver colloid solution was diluted by two fold using sodium citrate buffer.. Therefore, the particle number becomes 2.78 Å~loiOcm'3 (2.7s Å~loi3L-i), that is, 4.61 Å~10'ii M. As the size of lysozyme is ca. 4.6Å~3Å~3 nm, there are two positions for lysozyme to adsorb to the surface of silver particle,. namely, lying down and standing up. As for the lying down position, each. 60 nm silver particle could coverage 1210 lysozyme molecules while the number is 1760 for the standing up position. Accordingly, the monolayer. coverage concentration of lysozyme is estimated to be 5.6 Å~10'8 M and 8.1 Å~10-8 M, respectively, for the lying down and standing up positions.. The real case should be between these two values. The size of insulin is. 28.
(34) ca. 2Å~2.5Å~3 nm which was approximated to be a 2.5 nm sphere and the concentration ofmonolayer coverage is calculated to be 1.4 Å~10-7 M.. Result and Discussion. Figure 1(a) and (b) compares SERS spectra of lysozyme (10-5M in citrate reduced silver colloid) measured by use of the heat-induced method and without heat treatment (solution sample). As control in Fig. 1(c), a normal Raman spectrum ofa dry film of 1O'5M lysozyme solution is shown. In the SERS spectrum of lysozyme without the heat treatment (its intensity has been magnified by a factor of 3, Figure 1(b)), there. appears several bands due to Trp, Tyr, Phe, disulfide groups (v(C-S),. v(S-S)), amide I and amide III modes (see Table 1 for detailed band assignments). In the heat-induced SERS spectrum, an intense peak at 1049 cm-i and a series of weaker bands are observed. In normal Raman spectra ofsolution lysozyme shown in Figure 1(d), (e), there is no peak at. 1049 cm-i andthis peak also cannot match any bands of citrate anion.i5 The only remaining possibility for the origin of the 1049 cm-i band is. N03'. To confirm this speculation, normal Raman spectra of lysozyme solutions containing O and 40 mM NaN03 are compared (Figure 1(e), (fi), and the band is found at 1049 cm'i, revealing that it arises from the N03-. vibration. This peak has seldom been reported in SERS references,. 29.
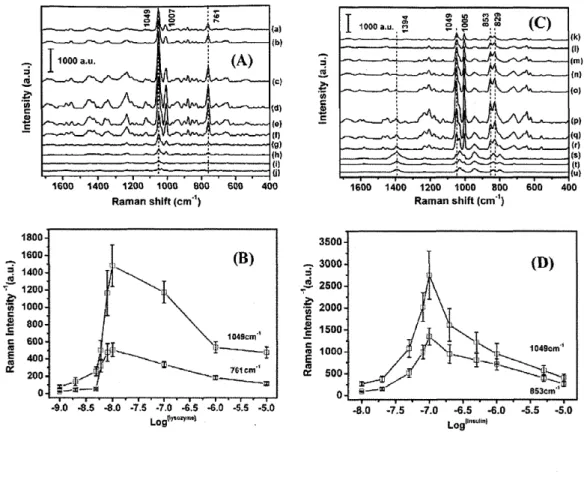
(35) however, Mrozek et al. unambiguously assigned it to the N03- mode in their study of saccharide using electrochemically roughed silver surface. i6. Both their and our work suggest that the dry film methods selectively. enhance peak ofN03- at 1049 cm-i.. SERS spectra of lysozyme and insulin obtained by the heat-induced method as well as their corresponding normal Raman spectra are shown in Figure 2, and these band assignments are summarized in Table 1, on. the basis of ref 7, 12, 17 and 18. Compared to the corresponding intensities in the SERS spectrum of insulin, the band intensities of Tyr. residue (1618, 1207, 1177, 853 and 829 cm-i) in SERS spectrum of lysozyme are stronger while the band intensities of Trp residue (1548,. 1359, 1340, 878 and 761 cm-') and disulfide (v(S-S) and/or v(C-S), 520-p750 cm'i) are weaker. This trend is consistent with the appearance. probabilities of the residues (Table 2), further confirming the band assignments for the SERS spectra.. The intensity and sharpness of the N03- peak at 1049 cm-i lead us to propose that this band may be suitable for quantitative analysis of the. proteins. Figure 3(A) displays concentration"tdependent (10'5-10'9 M) SERS spectra of lysozyme. Comparison to previous studies, the results in Figure 3(A) demonstrate two novelties. First, the detection limit is much. lower; down to a submonolayer coverage of 10'9 M (the coverage calculation is reported in the section of Experimental ), which is more. 30.
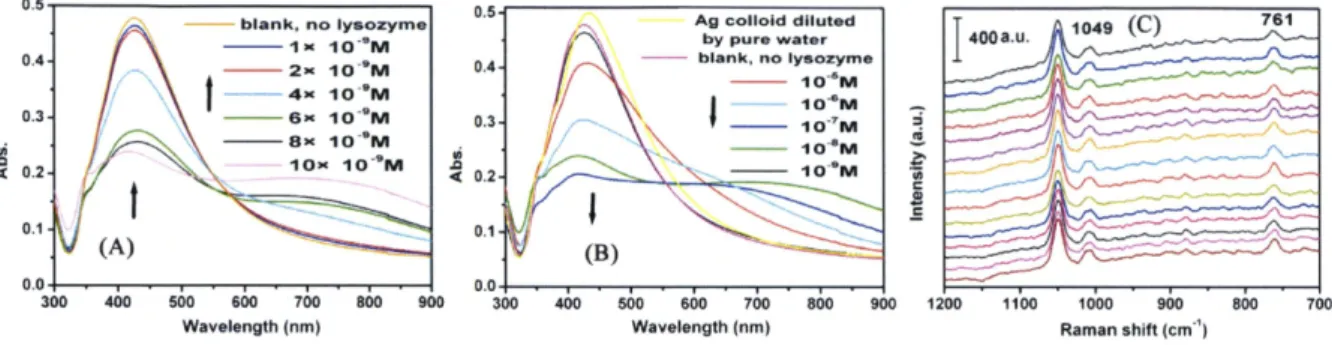
(36) sensitive than the method proposed before by which the detection limit is. 10'6 g/L (equivalent to 7Å~10'8 M). 6 Second, a concentration-dependent curve shows a bell shape rather than a sigmoidal one. i4 Similar results of. insulin are displayed in Figure 3 (C) and (D). The bell shape is supported. by UV-visible spectra (Figure 4). Figure 4 (A) shows that the absorption. decreases with the protein. concentration in the range of 10-8-10-9 M.. Whereas in the range of 10'5-10"9M (Figure 4 (B)), there is a minimum absorption at 10'7 M, indicating that when the protein concentration is. above monolayer coverage, a further increase in protein concentration would cause a negative effect against silver aggregation and decrease the. SERS signal. This phenomenon was not found when gluthionine was used as an analyte. i4 The difference leads to the proposal that the crowding of the silver colloid environment is responsible for the silver. colloid aggregation. As lysozyme is a large and hard molecule i9(129 amino acids) compared to the small and soft gluthionine (3 amino acids),. it is reasonable to observe that concentrated lysozyme inhibits silver colloid aggregation while the small peptide does not. SERS spectrum ofa. dry film of a solution containing 6 mM NaN03. is displayed Figure 5. There was no protein in the sample. Except for the peak at 1049 cm-i due to N03- ion, all other peaks are assignable to citrate ion. 20. Non-linear curves for quantitative or semi-quantitative SERS studies have been found in previous studies. 2i-23 In the present work, it shows a. 31.
(37) bell shape, which means that there are two possible concentrations for a certain SERS intensity. However, dilution ofthe protein sample can solve the problem. [Cma.] represents the protein concentration corresponding to. the maximum SERS intensity. Dilution of the protein sample with concentration higher than [C.,.] can induce an increase in SERS intensity. while dilution of that with concentration lower than [C.,.] leads to a decrease in SERS intensity.. The adsorption mechanism of protein and N03-possibly follows the most common co-adsorption scenario, which has been well established as a double-layer adsorption rule.24 Namely, there is a layer of electrolyte. such as citrate and N03'between an adsorbed layer of proteins and Ag colloid. The results in Figure 3 provide some support to this speculation, suggesting that the intensities ofprotein bands including those at 761 and. 853 cm'i are positively correlated with the intensity of the N03- band,. which may be evidence for the co-adsorption manner of the protein and N03t. A detailed depiction of the adsorption mechanism of protein and electrolyte was published recently. 25. Conclusion. Peaks due. to acid radicals. are usually considered. background in SERS studies, and additional caution should. undesirable. be paid to. 32.
(38) avoid these peaks. Here, however, we have developed a novel method that can selectively enhance the peak at 1049 cm-i originating from N03to make it valuable for semi-quantitative detection of proteins without any additional resonant effect. This method is simple, rapid (drying time is 210s), reproducible (see Figure 4 (C)) and label-free. The laser power. is low (6 mW) and the exposure time is short (20 s), which meets the need for routine analyses. The intensity and the sharpness of the N03peak suggest its potential in more extended applications, especially those. to biomolecules with low Raman cross sections and poor quality spectra by normal SERS protocols. Also, the bell shape indicates the potential of. this method in exploring adsorption phenomenon of a protein on a colloidal interface. These studies are ongoing in our group.. References. 1 Surface-Enhanced Raman Scattering: Physics and Applications. K. Kneipp, M. Moskovits and H. Kneipp eds, Springer. Berlin, Germany,. 2006 2 R. Aroca Surface-Enhanced Vibrational Spectroscopy, John Wiley & Sons, Ltd. Chichester, UIK, 2006. 33.
(39) 3 T. Itoh, A.Sujith, Y. Ozaki. In Frontiers ofMolecular Spectroscopy, Ed.. Jaan Laane, Elsevier , Amsterdam, 2009 4 S. E. J. Bell, N. M. S. Sirimuthu, 1. Am. Chem. Soc. 2006, 128, 15580. 5 Y. Wang, H. Wei, B. Li, W. Ren, S. Guo, S. Dong, E. Wang, Chem.. Commun. 2007, 5220 6 X. X. Han, G. G. Huang, B. Zhao and Y. Ozaki, Anal. Chem. 2009, 81,. 3329 7 S. Stewart, P. M. Fredericks, Spectrochim. Acta, Part A. 1999, 55,. 1615 8 V.P. Drachev, M.D. Thoreson, E.N. Khaliullin, V.J. Davisson , V.M. Shalaev. J. Phys. Chem. B 2004, 108, 18046. 9 D. Gobind, M. Federico, G. Francesco, D. A Francesco, K.H. Mohan,. C. Patrizio, L. Carlo, C. Giovanni, D. F. Enzo. Biosens and Bioelectron 2009, 24, 1693. 10 G.V.P Kumar, R. Selvi, A. H Kishore, T. Kundu, C. Narayana, J. Phys. Chem. B 2008, 712, 6703-6707 11 I. Pavel, E. McCarney, A. Elkhaled, A. Morrill, K. Plaxco and M. Moskovits, 1. Phys. Chem. C, 2008, 112, 4880 12 E. Podstawka, Y. Ozaki and L.M. Proniewicz, Appl. Spectrosc, 2004,. 58, 1147 13 A. Otto, J. Raman Spectrosc, 2002, 33, 593. 34.
(40) 14 G. G. Huang, X. X. Han, M. K. Hossain and Y. Ozaki, Anal. Chem, 2009, 81, 5881 15 C. H. Munro, W. E. Smith, M. Garner, J. Clarkson and P.C. White,. Langmuir 1995, II, 3712 16 M. F. Mrozek and M. Weaver, Anal. Chem, 2002, 74, 4069 17 B Yu, N.; Jo, B.H. Arch. Biochem. Biophys. 1973,156, 469. 18 Chen, M. C., Lord, R. C., Mendelsohn. R. Biochim. Biophys. Acta 1993, 328, 252 19 C. Haynes, W. J. Norde, Colloid lnterf Sci, 1994, 169, 313. 20 Munro, C. H., Smith, W. E., Garner, M. Clarkson, J White, P.C. Langmuir, 1995, 11, 3712. 21 I. T. Shadi,;B. Z. Chowdhry, M. J. Snowden, R. Withnall, Appl. Spectrosc, 2000, 54, 384 22 S. E. J. Bell, N. M. S. Sirimuthu, Chem. Soc. Rev. 2008, 37, 1012. 23 C. McLaughlin, D. MacMillan, C. McCardle, W. E. Smith, Anal. Chem, 2002, 74, 3160 24 C. A. Haynes, W. Norde, Colloids. Surfaces B: Biointerfaces 1995, 2,. 517 25 R. G. Wilhelm, J. H. /yvind, D. H. Ann-Mari, V. Sondre, 1. Phys.. Chem. B, 2007, III, 14329. 35.
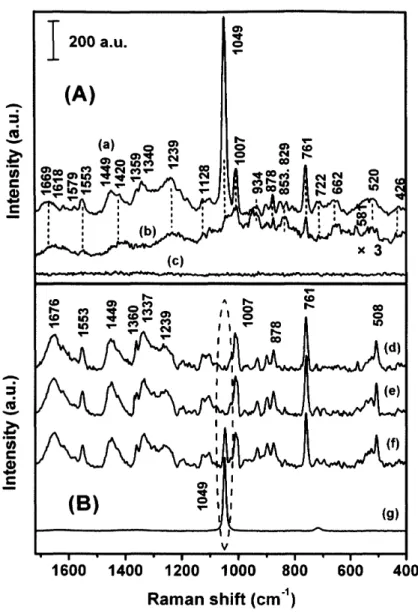
(41) or eo. 200a.u.. 3. '. (A). .ss.. b. $ee$tS' :$-glIet. 6ptNrvNCDptetee mNcoagesimcoco. '5. co. oNmt. N1:,. =. e s. i :l{b)' et. ,,. :,. ,:. le-:l. co:ut. ::. .. x3. ,. (c) sr"'. orza. $ ,ggseg. eF. AF. tl8ltv.. co ee. co pt co. It. {d). t. l. s•. l1. (e). .s!s,. l. 'b 6. 11I. lt. (f). =. e E. (B). (g). 16oo 14eo 12oo loeo soo. 6oe. 400. Raman shift (cm'i). Figure 1. (A)(a) A SERS spectrum ofa dry film of the solution containing 10-5 M lysozyme and 6 mM NaN03; (b) A SERS spectrum of a solution containing 10-5 M lysozyme and 6 mM NaN03, (c) A normal Raman spectrum of a dry film of 10'5 M lysozyme solution. (B)(d) A normal Raman spectrum of 7Å~10-3 M lysozyme in pure water; (e), (b Normal Raman spectra of 7Å~10-3 M lysozyme in a 5 mM citrate buffer. (pH 4.0) containing O mM NaN03 and 40 mM NaN03; (g) A normal Raman spectrum of IM NaN03. The intensity bar is applied only for (A) while band intensities in (B) have been adjusted artificially for display.. 36.
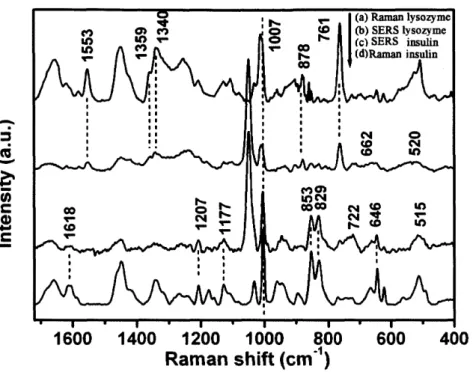
(42) n ut m ' : : : :. -! g b = Åë =. -. l. (a) Raman lysoayme (b) SERS lysozyme (c)SERS insulin (d)Raman insulin. P F e o o re- co F F co. : :l :l ::. : : :. :l. '. : : : :. : : : : ,. ,. i. '6 ie--. :. e m n v ' n M ' :. co N--. e v : :. nor. MN. pt. o.k. co co. "- :. Ne eN ee Ne..:. l tl. l: II,. : :. 1600Raman 1400shift 1200 1000 800 600 400 (cm"). Figure 2. Normal Raman spectra of solid (a) lysozyme and (d) insulin; Heat induced SERS spectra of 1O-5 M (b) lysozyme and (c) insulin.. 37.
(43) pa`" e,e. m"o". 3-,g. I aeoe a.u, , g. e,tsv. <a} ,::<A) (b). :t:mps. (C). 1. Iioeea,u. e• -SEir. .b... 2. e s. t-. t. 16eo 14ee s2ee lo"" Beo Raman shift (cm"}. dsee t6ee T' i4ea si. rr t2ee tis'loeo. E 4ee. E 2ee. o. ;. .E!i.. :. .e. i. {ct). R. e s. l l. {D. (m} tn}. lil. {o) ,. iii. {p). i. :. {q). :. i. i. 6"e 4eo. tr). il. (s). l. (t}. t. {"}. 16oe t4oe 12ao seee soo 6De 4eo Rarnan shift (cm3. 3seo (B). m s. l. .,si 2See. tS2eeo .g-.Is"o. williX ex=,esIi f.. (D}. s• 3eee. Å~. ". see =. 6e". !•. (c> (e) {f} {g) <h) {i) ti}. '. {k) li. t. i paÅ~. 1049cm". lx. 7eseru". vaNre. -g.o B.s ee -7.s •7.e -6.s -6.o -s.s -s.o. LegVVseayra,}. ep. S leeo. lt. l,". ""..7ggg-. E seo. o. nt. ".e -7.5 -7.0 6.5 6.0 ".5 -5.0 LogVstsuti"}. Figure 3. (A) Concentration-dependent (10-5-10-9 M) SERS spectra of lysozyme (a) 1Å~10-5 M (b) 1Å~10'6 M (c) 1Å~10-7 M (d) 1Å~1O-8 M (e) 8Å~lo'9. M (D 6Å~lo-9 M (g) 4Å~lo-9 M (h) 2Å~lo-9 M (i) 1Å~lo-9 M g) 1Å~lo"O M; (B). Raman intensity at 1049 (N03- band) and 761 cm-i (Tyr band) of the SERS spectra in (A); (C) Concentration dependent (10-5-10-8 M) SERS spectra of insulin (k) 1Å~1Oh5 M (1) 5Å~1O-6 M (m) 1Å~1O-6 M (n) 5Å~1O-7 M (o). 2Å~10-7 M (p) 1Å~10-7 M (q) 8Å~10-8 M (r) 5Å~10-8 M (s) 2Å~10-8 M (t) 1Å~10-9. M; (u) O M control; (D) Raman intensity at 1049 and 853 cm-' (Trp band). ofthe SERS spectra in (C). 38.
(44) O.5. - blank, no lysozyme. 1: ::i;:. O.4. -"" ,,f,. O.3. ?/t. ". s. ( O.2. t. e.s. o.o. Xx,.x. 1 :::g[:M. x. IY •h,.. ( O.2. o.o. '""'"'. tOI?.M -.. ,,,, 10 M. 3. s s2 2. z'. !"f"-.A....-.'..vv.' ". -'Nv. as. Vv/-u--nL.. (B). soo 6oo 7oo eoo goo 3oo 4oo Wavelength (nm). ""'. s O.1. 76t. 1O""M. 1 """'N"-"im, ::::. x . ,,,,' J .i9.F iP M. t049 (C). I 4ooa.u.. by pure water - blank, no tysozyme. O.4 O.3. N .e. Ag col}oid dlluted. 1ve-. X"N sx to-eM. (A). 3oo 400. O.5. soe 6oo Too soo goo neo tloo Wavelength {nm). SOOO 900 8oo. 't. Ramen shift {cm ). Figure 4. UV absorption spectra ofsilver colloid measured at 5 min after addition of lysozyme solutions. The final concentrations of lysozyme in. silver colloid solutions were (A) 1O-8-1O'9M (B) 1O'5-1o'9M; (c) A collection of 15 SERS spectra of lysozyme (10'5 M), measured at 15 different points ofthe sample and averaged to obtain the spectrum (c) in Figure 1. The standard deviation ofthe spectra intensities at 1049 cm-i is 7.50/o.. 39. 7oo.
(45) 50. 40. 8. A e, 3,. $ 9. b 2o '2 2•. "e t,h. ..,. 9 10. No protein. .e. S2. g. "- .s ; gX g•. tF :8. 5S. e 1600 1400 1200 1000 800. 600. 400. Raman shift (cm't). Figure 5. A SERS spectrum of a dry film of a solution containing 6 mM NaN03. There was no protein in the sample. Drying temperature was 100. OC. The NaN03 was dissolved in a 5 mM citrate buffer. Except for the peak at 1049 cm-i due to N03- ion, all other peaks are assignable to citrate. ion (ref2). 40.
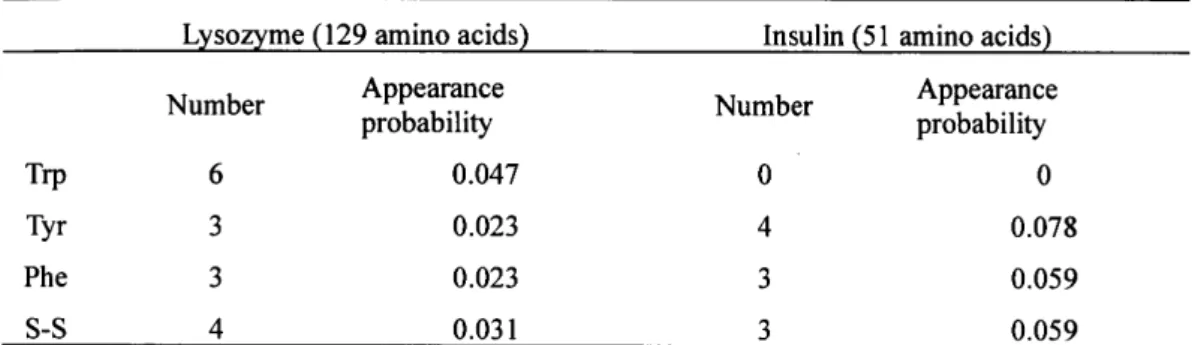
(46) Table 1 Wavenumbers and band assignments for normal Raman spectra ofsolid lysozyme and insulin and SERS spectra of lysozyme and insulin (the assignments were based on ref. 3-8). Assignment. AmideIand or H20 TrpWi,Tyr,andlor Phe(Vsa) TrpW2 andlor Phe(Vsb) TrpW3 andlor Amide II. Normal. SERS. SERS. Normal. SERS. Raman 1 so me. lysozyme. lysoayme. Raman. insulin. 1676 1654 1619. solution. 1000C heatin. l669 1646 1618. NO. His. 1580 1553 1492. 6(CH2). 1458,. Tyr and/or 6(CH)indoie ring. 1449 1422. Trpw7 TrpW7 and/or 6(CH). 1360 1337. 1359 1340. Amide III. 1273 1254 1245 1207 1177 1154 1128 1106 1078. 1273. Tyr and!or Phe(v7a) Tyr andlor Phe(vga). v(CN). N03 1031 1011. Phe(vi2). 1O06 979 960 933 904 876 859 837. Trpw17. Tyr Tyr. 1579 15s3a. 1424. 1449 1420. 1237. 1236 1208 1182. 1121 1101. 1128 1101. 1000C heatin. 1681 1659 l613 1606 1587 1556 1517 1461 1449 1423 1415. 1665. NO. NO. 1342 1319. 1618 1607 1556. 1449. 1281. 1267 1244 1206 1174 1158 1128. 1234 1207 1177 1128. 1111. 1082 1063 1049. Phe(Visa) Trpw16. v(CC). 1545. Solid insulin. 1049 1032. 1O07 951. 93sa 878 846 836. 1O07. 958 934a 904 878 853 829 809. 1O04. 960 946 895. NO. 853 829. 1049 1032 1O05. 989 954 944, 934b. 904. NO. 853 829 809. 768 (?). Trpw18 v(CS) andlor TrpWi9 andlor N03'. v(CS) Tyr Phe(v6b). Trp Trp. 761. 722 695 666 645 623 575 537. 760 716. 659 643 581. 761. 722 680 662 646. NO NO. NO. NO. 744 723. 722. 665 644 622. 662 646 623. 538. 561(?). v(SS). PheorTr. 508 428. 525. 438 ?. 520 426. 512 422. 515 430. a: Red, green and blue represent bands of trp, tyr and v(CS)! v(SS), respectively.. b: Partlyfromv,(C-COO').. 42.
(47) Table 2 The number and appearance probability of the. amino acids whose peaks. dominate in SERS spectra L so me 129 am ino acids. Number Trp Tyr. Phe s-s. 6 3 3 4. Appearance probability. O.047 O.023 O.023 O.03 1. Insulin. Number. o 4 3 3. 51 amino acids. Appearance probability. o O.078 O.059 O.059. 42.
(48) Chapter 2. Experimental Parameters for SERS of Nitrate Ion for LabeR-free Semi-quantitative Detection of Proteins and Mechanism for Proteins. to Form SERS Hot-sites: A SERS Study. 43.
(49) Abstract. We have explored effects of experimental parameters on SERS intensities ofN03' and proteins observed by a heat-induced SERS method developed in our group. The results have shown that strong SERS signal can be obtained at pH 4.0, using Ag colloid prepared with the reduction time of 15 min (the average size of Ag nanoparticle is 56.5 nm), diluting prepared Ag colloid by a factor of2 by use ofa 5 mM citrate buffer, using. 6 mM NaN03 and drying a sample at 100 OC, respectively. Based on the results, two possible mechanisms for proteins to form SERS hot-sites during the sample preparations are proposed. A semi-quantitative SERS. detection of Ribonuclease B has been investigated. Also NaN02, Mg. (N03)2, MgS04 and Na2S04 have been found to be feasible for the. heat-induced SERS method. Importantly, samples prepared by the heat-induced SERS method are so stable that the samples prepared by this method can be used as a standard and transferred to different laboratories. for direct comparison. Namely, it can overcome uncontrollable aggregation of Ag colloid in a solution sample. All these advantages as well as the simplicity of experimental setup have demonstrated that the. heat-induced SERS method using NaN03 as an electrolyte is very promising for label-free routine and quantitative detection ofproteins.. 44.
(50) Introduction. The potential of surface-enhanced Raman scattering (SERS) as an ultra-sensitive analytical teclmique has been studied extensively.i-5 Due to. huge enhancement in Raman scattering, detection of a trace amount of biomolecules by SERS has attracted keen interest from many researchers in biochemistry, biotechnology, medical science, environmental science, archaeology and so on.6-i2 Proteins in organisms play diverse roles such. as structural maintenance, transportation, signal transduction and catalysis, and disorder of proteins is related directly to diseases.i3 Most proteins exist in vivo at a very low concentration. Therefore, developing a. simple, rapid and ultra-sensitive method to detect proteins has recently. been paid much attention in SERs community.i4-i8 Proteins can be divided into two classes. One class ofproteins contains. chromophore groups (hereafter, we call it Protein Class I) whereas the other class does not (we call it Protein Class II). This classification is also. important for protein detections by SERS. As a chromophore group within a protein usually yields a resonant Raman contribution in the order. of lo2-lo3, 6' i9 which is not experienced by a polypeptide part. Namely,. only the signal of chromophore group appears in a SERS spectrum of protein Class I. For this reason, it is much more diffircult in practice to. 45.
(51) obtain high-quality SERS signal from Protein Class II than from Protein Class I.. Except for low Raman cross section, another difficulty for detecting Protein Class II by SERS is that protein structure is much more complex. comparing to other biomolecules. Because a protein molecule has a three-dimensional structure and is composed of20 different amino acids,. the surface characters of proteins vary significantly from protein to protein.20' 2i These surface characters include net charge (isoelectric. point), charge distribution, distribution of hydrophobic/hydrophilic. groups and distribution of active groups binding to a roughed metal surface. It is known that surface characters are critical for protein adsorption on a roughed metal surface to give strong SERS signal.6. SERS spectra of various kinds of Protein Class II have been reported.i5nyi8,22-27 However, to our best knowledge, a quantitative SERS. study of Protein Class II in a broad concentration range has not been reported except for our recent study.i4For the quantitative SERS studies ofProtein Class II, an experimental protocol for routine analyses as well as professional investigation is needed.. We have recently proposed a heat-induced SERS sensing method for rapid detection of a peptide, glutathione.28 In this method, a portion of 30. pL sample solution (containing an analyte and Ag colloid) is heated on an aluminal pan plate at 1000C for three min. to obtain a dry film, and then. 46.
(52) SERS signal is acquired. Compared to conventional SERS protocols, this. method enables one to obtain much larger SERS enhancement without loss ofvibrational information about an analyte. The heat-induced SERS method for semi-quantitative detections of proteins is simple, rapid (dry time is 210 s), reproducible and label-free. In addition, the laser power at. the sample point is low (-6 mW) and the exposure time is short (20 s).. When we extended the application of this method to the detections of lysozyme and insulin (Protein Class II) using N03'as an electrolyte 29, a. sharp band at 1049 cm-i due to a N03- vibration was observed in these SERS spectra, and the SERS intensity of this N03' band was found to be positively correlated to protein concentrations in the range of lo-9 or lo-8. M to 10-5 M. Thus, the method was suitable for semi-quantitative detection of proteins down to a concentration of submonolayer coverage of Ag colloid. Moreover, as a function ofprotein concentration (10-9 or 10-8 M to 10-5 M), the SERS intensity showed a bell shape of variation,. with the maximum occuring at a concentration around the monolayer. 29 . coverage The present work has dual purposes: one is to explore the effects of experimental factors on SERS intensities of N03- and protein by use of. the heat-induced SERS method. Another purpose is to investigate possible mechanisms for proteins to form SERS hot-sites during the sample preparation. For the former study, six experimental factors. 47.
(53) including (a) pH, (b) reduction time ofAg colloid, (c) drying temperature, (d) buffer (citrate) concentration, (e) concentration of colloid silver, and. (fi concentration of electrolyte (NaN03) were studied. Subsequently, a semi-quantitative study of Ribonuclease B and the effects of other four. electrolytes including NaN02, Mg (N03)2, MgS04 and Na2S04 were investigated. After six days' stocking ofthe sample, relative intensities of. SERS bands were found to be very stable. Base on the above results, we. have proposed two possible mechanisms for the hot-site formation by protems.. Material and Methods. Materials. Lysozyme from chicken egg white and Ribonuclease B from bovine. pancreas were from ICN Biomedicals Inc (Aurora, Ohio, USA) and Sigma (St Louis, Missouri, USA), respectively. Silver nitrate (99.90/o) and. analytical grade reagents were obtained from Wako Co. Ltd. (Osaka,. Japan). All the materials were used without further purification.. Eppendorf tubes were purchased from Eppendorf Company (Hamburg, Germany). Aluminal pan plates used for containing a sample solution were from Perkin Elmer (0219-O062, 0219-O041).. 48.
(54) Preparation ofsilver colloid. The preparation of citrate-reduced Ag colloid followed a modified Lee. and Meisel method.30'3i In brief, 500 ml of water containing 90 mg of silver nitrate was heated to boil. Then, 10 ml 10/o (w/v) sodium citrate aqueous solution was added to the solution. The solution was kept boiling for some time. Then, the reduced Ag colloid solution was placed in an ice. bath immediately to stop the reaction. An UV-Vis absorption peak ofthe. Ag colloid was observed at 445 nm. This batch of Ag colloid was aged for six months at 4 OC, and was used for the studies shown in Figure 1, 2,. 3 and 4 while another batch of Ag colloid with an UV-Vis absorption peak at 431 nm was used freshly (within 15 days after preparation) for the studies for Figure 5 and 6.. Sample preparationfor SERS study. Typically, a portion of 500 pL of 5 MM citrate buffer solution containing 12 mM NaN03 was added to 500 pL of Ag colloid solution contained in a 2 mL EP tube (no obvious aggregation was observed in this mixture). Then, a 10 pL protein solution (prepared by dissolving the. protein in pure water) was added to the above lmL mixture (the pH ofthe final protein-colloid solution was 4.0. The aggregation of the colloidal. silver was observed upon the addition of protein). Then, the protein-colloid solution was shaken bottom to up by hand for 40 s during. 49.
(55) which one cycle ofbottom to up and up to botom took ls. Subsequently,. 30 ptL or 60 pL of the mixture was removed and placed on an aluminal pan plate followed by heating at 1000C for 210 s to completely dry the sample solution.. SERS and normal Raman measurements All SERS and normal Raman spectra were measured by a macroscopic. Raman spectrometer, HoloProbe VPT system (Ann Arbor, MI, USA) using X=785 nm as an excitation light source. The spot size and power of laser beam at the sample position was 10 pm and 6 mW, respectively. The. exposure time for each SERS measurement was set to be 20 s with one accumulation. As for SERS spectra, each datum indicates an average of. 15 measurements (for three plates, a SERS spectrum was measured at five different points in each plate) and each error indicates the standard deviation.. UVabsorption measurements Each absorption spectrum was obtained 5 min after addition of a protein solution or pure water (control) into Ag colloid with a Shimadzu. UV-3 1O1 UV/Vis spectrometer at room temperature.. SEM measurements. 50.
(56) The acceralate voltage of the equipment (Hitachi S-5000, FE-SEM) was 10 kV. The software (Nano Measurer 1.2) was used to analyze the diameter ofthe Ag colloid.. Calculation of the concentraion of Ribonuclease B for monolayer coverage ofcolloidal silver. The peak UV absorption ofthe prepared Ag colloidal particles is at 431. nm, corresponding to a size of 50 nm particle in average (from SEM image). The cross section ofeach Ag particle, 6 was obtained to be 1.068. Å~lo-iOcm2 using Mie theory, by approximation of the Ag colloid to an ideal sphere. Ag particle number was calculated to be 6.49 Å~10iO cm-3. Using the equation, absorption = Åí (cm2) Å~ particle number ( cm"3) Å~ length ofa UV cell. used (cm),. As this Ag colloid solution was diluted by two fold in SERS sample, the particle number becomes 3.25 Å~10iOcm'3 (3.25 Å~10i3L-i), that is, s.3g. Å~10'iiM. The size ofRibonuclease B is ca. 3.8Å~2.8Å~2.2 nm, which was approximated to be 3 nm. Accordingly, each 50 nm silver particle could. coverage 1250 Ribonuclease B molecules. As a result, the monolayer coverage concentration ofRibonuclease B is estimated to be 6.7 Å~10-8 M.. This estimation is rough as the conformation and size of protein would. change under different experimental conditions such as pH and buffer. 51.
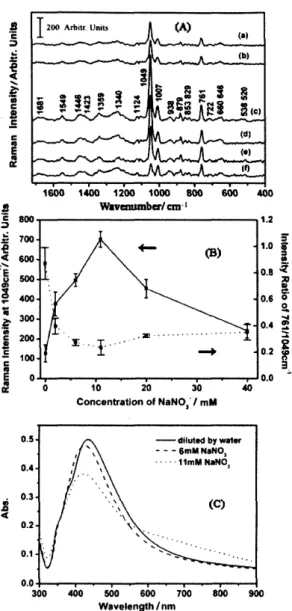
(57) concentratlon.. Result and Discussion ELffects ofthe NaN03 concentration. The study sequence of the six experimental factors is as follows: pH,. reduction time, heat temperature, buffer (citrate) concentration, concentration ofAg colloid, and concentration ofNaN03. As the study of. NaN03 concentration suggests binding mechanisms of proteins to colloidal silver, we describe this part in the beginning. Figure 1 (A) (a),. (b), (c), (d), (e) and (b illustrate SERS spectra of lysozyme (10'5 M). obtained using 40, 20, 11, 6, 2, O mM NaN03, respectively. Although peak intensities change with the NaN03 concentration, peak positions vary little. The spectra show many protein bands, such as bands due to. amideI(1681 cm-'), II (1550 cm-i), III (1273 and 1239 cm-'),Trp (1579, 1359, 1340, 761 and 538 cm-i), Tyr (853, 829 and 646 cm-'), Phe. (1007 cm-i), v (CS) (722 and 662 cm-') and v (SS) (520 cm-i). The. strongest peak at 1049 cm-i comes from N03'. On the basis of references,23-26' 32 band assignments for Figure 1(A) is shown in Table 1.. As can be seen in Figure 1(B), the NaN03 concentration-dependent. variation of N03' intensities shows a bell shape. When the sample solution contained a small amount (O, 2 and 6 mh in final protein-Ag. colloid mixtures) of NaN03, no obvious aggregation or very slow. 52.
(58) aggregation of Ag colloid could be observed; however, a subsequent addition of lysozyme (dissolved in pure water) immediately induced fast aggregation of Ag colloid. Whereas addition of solutions with the higher. NaN03 concentrations (11, 20 and 40 mM in final protein-Ag colloid mixtures) resulted in immediate fast Ag colloid aggregation, and a subsequent addition of lysozyme also induced further aggregation of Ag. colloid. These observations with naked eye were confirmed by UV-Vis absorption measurements (Figure 1(C)).. Hot-site formation (or aggregation ofAg colloid) and adsorption of an analyte to Ag colloid are two prerequisites for strong SERS signal. In a. protein-Ag colloid mixture solution, there may be two possible mechanisms for a protein molecule to adsorb on a hot-site. In one. mechanism (we call it Mechanism I), a protein moluclue induces a hot-site directly; namely, an individual protein bridges two neighboring Ag nanoparticles through multiple-point interactions. It should be noted. that as there was at least O.5 mM N03' in the system which was introduced by AgN03, the Ag surface is probably covered by N03- before the addition ofprotein (Chart 1 (a)). In the other mechanism (Mechanism II), electrolytes induce a hot-site in the beginning, and then, a protein either adsorbs in the hot-site by substitution of the electrolyte ions, or. co-adsorption with the electrolyte ions (Chart 1 (b)). Accordingly, it is. very likely that in the case ofa low concentration (O, 2 and 6 mM) of. 53.
(59) NaN03, hot-sites are formed mainly through Mechanism I. On the other. hand, when the NaN03 concentration increases (11, 20 and 40 mM), Mechanism II gradually dominates. The co-adsorption binding manner of N03-/protein on an Ag surface as shown in Chart 1(b) gets some support. from a concentration dependent SERS study of Ribonuclease B (as discussion below).. In terms of enhancement of SERS signal, Mechanism II could be better. or worse than Mechanism I, depending on experimental conditions. On one hand, more concentrated electrolyte ions can induce more hot-sites and thus yield stronger SERS signal in Mechanism II. On the other hand, Mechanism II could be worse for two reasons. First, a protein arrives late. on an Ag surface and would find that many N03- ions have already adsorbed on it. It is probably impossible for proteins to substitute all the. N03' adsorbing on the Ag colloid within short time for sample preparation. Second, due to a steric hindrance effect, in Mechanism II it is more difficult for a protein to access the interior hot-sites within large Ag. colloidal clusters. Therefore, Mechanism II could be worse than Mechanism I, which was supported by the results in Figure 1(A), showing that the intensities ofprotein SERS signals in Figure 1(d) (6 mM. NaN03), (e) (2 mM NaN03) and (D (O mh NaN03) are stronger than those in Figure 1(a) (40 mM NaN03) and (b) (20 mM NaN03). However,. the maximum signal is not at 6 mM N03'. 54. , but at 11 mM N03' where.
(60) Mechanism II is obvious, which should be a result of the balance of the factors (Figure 1(c)).. The trends of the N03- band and the ratio between the peak intensities at 761 and 1049 cm-i (I76iAio4g) are shown in Figure 1(B). It is noted that. the former shows a bell shape with the maximum at 11 mM NaN03. In Figure 1(B), the intensity ratio of protein/ N03- (I76iAio4g) reflects the. ratio of the analytes undergoing Mechanism I and those undergoing Mechanism II. From O to 11 mM NaN03, there is a trend that I76iAio4g decreases with the increase in the NaN03concentration, being consistent. with the trend ofthe ratio ofMechanism I/Mechanism II. However in the. ,. range of 11-40 mM I76iAio4g grows with the increase in the NaN03. concentration (Figure 1(B)); we do not know the reason for this unconsistency, it is possible that higher concentration of electrolyte affect. the structure of lysozyme or its binding manner.. Although the maximum of the SERS signal at 1049 cm-i of N03- is observed at 11 mM NaN03, the rapid aggregation of Ag colloid before addition of lysozyme is hard to be controlled (Figure 1(C)), increasing the. irreproducibility in sample to sample. Therefore, the 6 mM NaN03 solution was used in the following studies.. pH effect 55.
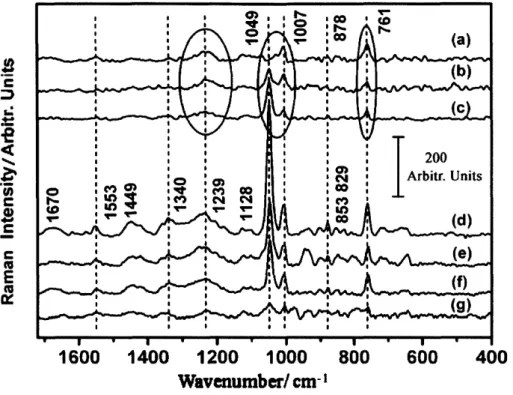
(61) Solutions with pH 4.0, 6.0 and 8.0 were prepared by using a citrate buffer (pH range of 10 mM citrate buffer is 2.7-8.2). To reach pH 2.0 and. 10.0, additional HN03 and NaOH were used, respectively, except for the. citrate buffer. Figure 2 shows SERS spectra of lysozyme (10-5 M) measured under different pHs (pH was measured for protein-Ag colloid mixtures). It is noted that the intensities ofthe SERS signals are strongly. dependent on pH, showing the maximum at pH 4.0. As lysozyme (pl = 11.1) carries positive charge at pH 4.0, it can easily adsorb on negatively. charged Ag colloid, resulting in intense aggregation of Ag colloid and. strong SERS signal. However, the increase in pH makes lysozyme to carry less positive charge and thus inhibits its adsorption on Ag colloid.. Therefore, the spectra intensities decrease when pH increases from pH 4.0 to 10.0. Moreover, when pH increases from 6.0 to 10.0, some regular trend ofpeak intensities is observed (as marked by circle frames); namely,. the N03'band at 1049 cm'i decreases whereas the protein bands at 761 (Trp), 1007 (Phe) and 1239 cm-i(amide III) increase, leading a proposal that the increased OH' groups compete with N03" to adsorb on Ag colloid and this thinner OH- layer is more favorable for proteins to yield strong. SERS signal. On the contrary, the SERS signal obtained at pH 2.0 (using HN03 to adjust the pH) is weaker than that obtained at pH 4.0 (Figure 2). To confirm whether the result at pH 2.0 is related to electrolyte anions or. not, HCI and H2S04 were used to adjust the pH to 2.0 and the results. 56.
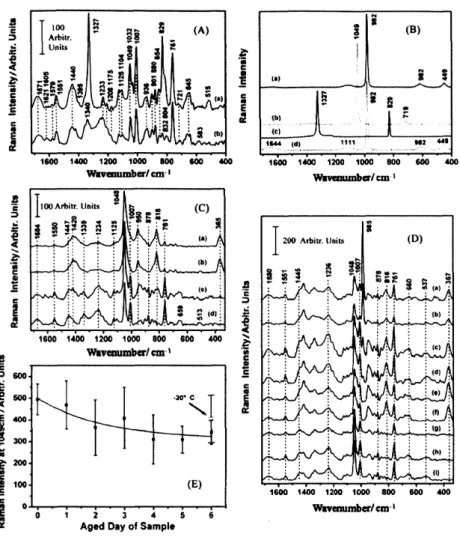
(62) show that the intensities of both cases are also lower than that at pH 4.0. (Figure 2 (fi and (g)). A possible explanation is that excess H' surrounding the surface of Ag colloid inhibits the positively charged protein to adsorb on the Ag surface. Similarly, the most intense SERS. signals were also acquired at pH 4.0 when insulin (pl 5.2) and Ribonuclease B (pl 8.9) were used (data not shown).. Effect ofAgparticle size. We prepared Ag nanoparticles with different sizes by controlling the. reduction time of AgN03. UV-Visible absorption spectra and SEM images are displayed to monitor the size ofthe Ag nanoparticles (Figure 7. (A) and Figure 8). There is a trend that the average diameter of Ag nanoparticles increases from 37.1 to 62.2 nm with the reduction time from 2 to 90 min (Figure 8), and the SERS spectra of samples with the Ag nanoparticles are presented in Figure 3 (A). These SERS spectra can be divided into three groups in terms of spectra pattern. The first type is. the spectrum obtained using the Ag colloid with the reduction time of 2. min, and the peaks (1411, 1026, 947, 839 and 800 cm-i) can be safely assigned to citrate ion.30 The second and the third type of spectra obtained. by using Ag colloid with the reduction time of 15 and 90 min, respectively, are abundant ofprotein bands, such as Trp (1582, 876, 761. and 645 cm-i), Tyr (856, 830 cm-'), Phe (1035, 1007 and 632 cm"),. 57.
(63) amide I, II, III (1666, 1582, 1279 and 1239 cm-'), COO' (1397 cm-'), v(C-S) (715 cm-') and v(S-S) (524 cm-i). Other spectra can be attributed. to one of the three types (reduction time of 10 or 30 min) or a combination oftwo types (reduction time of5 or 60 min). The differences in the spectra patterns may be due to the surface character ofAg colloidal. particle including surface charge (ratio between Ag' and AgO) and sorbent on Ag colloid such as citrate ion and reduced products of citrate ion.3i. The adsorption direction of protein on the Ag surface also possibly affects the spectrum pattern.. Figure 7(B) depicts UV-Vis absorption spectra ofthe Ag colloid-protein solutions. Comparison with the spectra of Ag colloid solutions (Figure 7(A)), there is an increase in the absorption around 785 nm (the excitation. wavelength for SERS), indicating aggregation of Ag colloid. Moreover, in all the samples, no obvious aggregation appeared after the addition of. citrate buffer containing NaN03 into Ag colloid (data not shown); on the contrary, large aggregation of Ag colloid was observed upon the addition of lysozyme (Figure 7 (B)). Therefore, Mechanism I dominates during the. aggregation of Ag colloid. As the Ag colloid with the reduction time of 90 min has the most intense absorption around 785 nm (Figure 3(B)), this batch colloid yields the strongest SERS signal of protein (Figure 3 (A)).. Nevertheless, the most intense N03- band at 1049 cm-i was obtained for the Ag colloid with the reduction time of 15 min.. 58.
(64) Effect ofd7 ying temperature. As drying a 30 pl sample solution at room temperature takes 240 min, which is too long for routine analyses, more accelerated drying process is. needed. Figure 3 (C) displays SERS spectra of lysozyme measured at different drying temperatures from 25 to 180 OC. The drying time at 25, 40, 60, 80, 100, 120, 140, 160 and 180 OC are 240, 40, 15, 7, 3.5, 2, 1, O.7. and O.6 min, respectively. These spectra can be divided into two types in. terms of spectra pattern. One is represented in the spectrum obtained by drying at 100 OC. Another one is that measured by drying at 25 OC.. As a rule, a protein adsorbed on a solid-liquid interface will optimize its. conformation with time to form a more stable and tighter binding manner.20'2i The dependences of peak positions and peak intensities on drying temperatures may reflect this rule (Figure 3(C)). It is noted that the. spectrum obtained by drying at 25 OC is similar to that reported in ref24.. The data taken by drying at 40 and 60 OC are not shown here because at. each temperature, one sample gives two spectra patterns, dependent on. the measured point in one alluminal plate. Whereas spectra measured with other drying temperatures have only one pattern. Figure 3(D) plots. the corresponding SERS intensity of the N03- band at 1049 cm-i versus. drying temperature, which shows that drying at 100 OC yields the maximum intensity ofthe N03- band.. 59.
(65) Effects ofcitrate concentration andAg colloid concentration. Figure 9(A) depicts SERS spectra of lysozyme measured using different concentrations of citrate buffer. Figure 4 (A) shows the corresponding SERS intensity of the N03" band at 1049 cm-i versus the citrate concentration. There is a trend that the SERS intensity decreases with more concentrated citrate buffer, which should be due to competitive adsorption ofcitrate ion with lysozyme on Ag colloid.. Figure 9(B) displays SERS spectra of 10-5M lysozyme with different concentrations of Ag colloid and Figure 4(B) plots the SERS intensity of the N03-band at 1049 cm'i versus the Ag colloid concentration. Although there is little variation in the SERS spectra pattern (Figure 9(B)), the overall intensities changes. The peak intensities obtained by using the 10. and 300/o Ag colloid are weaker than that by using the 50 O/o Ag colloid.. However, more concentrated Ag colloid (70 and 900/o) does not increase the SERS signal. Consistently, it was observed that the samples having 10, 30 and 500/o Ag colloids were relative stable after the addition of citrate. buffer containing NaN03 whereas those having 700/o and 900/o Ag colloids were aggregated upon the addition of the buffer. Therefore, the result suggests that excessive aggregation ofAg colloid (such as 70 and 900/o concentrations) is negative to SERS intensity of an analyte.. 60.
(66) In conclusion, the effects ofthe citrate concentration and the Ag colloid concentration are not so critical as those of pH, the reduction time of Ag. colloid, the drying temperature and the NaN03 concentration. The latter four factors affect not only SERS intensities, but also the binding manner. (adsorption direction, conformation) of lysozyme.. Semi-quantitative detection ofRibonuclease B by SERS. Figure 5(A)(a) and (b) shows a SERS spectrum ofa dry film ofa solution containing 6Å~10-8 M Ribonuclease B and a normal Raman spectrum ofsolid Ribonuclease B, respectively. The band assignments for these spectra are listed in Table 2. Figure 5(B) displays SERS spectra of. Ribonuclease B with different concentrations (3Å~10'8, 6Å~loe8, 1Å~lo-7,. 1Å~10"6 and 1Å~10'5 M). Being consistent with our previous study of lysozyme and insulin, 29 the concentration dependent variation of SERS. intensity shows a bell shape with the maximum intensity at 6Å~10-8 M. (Figure 10). As the monolayer coverage of Riboncuclease B on Ag colloid is estimated to be 6.7Å~10-8 M, the result suggests that the excess of. proteins (more than the monolayer coverage of Ag colloid) inhibits the aggregation of Ag colloid. When the protein concentration is lower than. 3Å~10'8M (less than the monolayer coverage), there appears a series of strong SERS bands due to citrate ion.30. Figure 10 illustrates SERS intensities at 1442 (6 (CH2)), 1239 (Amide III), 1049 (N03-), 1004 (Phe), 832 cm" (Tyr), 661(Tyr) and 645 cm-' (v. 61.
(67) (CS)) versus the concentration of Ribonuclease B. The result shows that. the N03- band is positively correlated with protein bands, strongly suggesting that N03- and protein co-adsorb on the surface of Ag colloid (a possible binding manner was given in Chart 1(b)).. Feasibilityfor other electrolytes. We explored the feasibility of other four electrolytes including NaN02,. Mg (N03)2, Na2S04 and MgS04. Figure 6(A) (a) and (b) show SERS. spectra of lysozyme (10-5 M) containing 30 mM NaN02 and 6 mM Na2S04, respectively. Normal Raman spectra of the electrolytes are shown in Figure 6(B) (c) and (a). In the SERS spectrum obtained by using NaN02, peaks at 1327 and 829 cm-i due to NOivibrations are very. strong, with the compensation of the weakening of N03- peak at 1049 cmnyi ,. which suggests that NOi substitutes some N03- to form hot-sites. and supports the proposed mechanism in Chart 1(b). Other peaks in Figure 6(A) (a) similar to those in Figure 1(A) (c) stem from lysozyme. vibrations. The spectrum obtained using Na2S04 is also featured of lysozyme bands (Figure 6(A) (b)). However, the strongest peak (982 cm-'). of Na2S04 (Figure 6(B) (c)) is too weak to be observed in the SERS. spectrum. On the other hand, although the concentration of N03(introduced by AglNI03 during preparation ofAg colloid) is low (O.5 mM),. the N03- peak at 1049 cm'i is still strong. Therefore, S04' is not able to. 62.
(68) substitute N03' to adsorb on Ag colloid, which is in agreement with previous works. iO' i4 In addition, using N03- is better than using S04- in. terms of reproducibility ofthe SERS spectra (data not shown).. Figure 6(C) shows SERS spectra of lysozyme (10-5 M) obtained using different concentrations of Mg(N03)2 (O-6 mM). The spectra measured. using 1 and O mM Mg(N03)2 (Figure 6(C) (c) and (d)) are rich in lysozyme bands. However, when the Mg(N03)2 concentration is 3 mM or higher, citrate bands30 appear, instead of the protein bands. There is another new peak appearing at 365 cm-i, which is within the vibrational. range of Ag-X (X represents adsorbing group). This peak also appears. when MgS04 was used (vide infra), but not in the cases of NaN03,. NaN02 and Na2S04. Figure 6(D) exhibits SERS spectra of lysozyme mearsured using different concentrations of MgS04 (O-30 mM). The bands of lyzozyme dominate in all the spectra. With the increase of MgS04 concentration, the intensity of S04- peak at 985 cm-i (Figure 6(B). (d)) increases and the submerged band of Phe at 1033 cm'i becomes clearer. As Mg2' takes more charges, it is much easier for Mg (N03)2 and. MgS04 to cause aggregation of Ag colloid.7' iO In the present study,. immediate aggregation ofAg colloid need 1 1 mM NaN03 whereas only 1. miV[ Mg(N03)2 or 2 mM MgS04 is needed.. Sample stability. 63.
図
+7


関連したドキュメント
Inside this class, we identify a new subclass of Liouvillian integrable systems, under suitable conditions such Liouvillian integrable systems can have at most one limit cycle, and
Our result im- proves the upper bound on the number of BSDR’s with minimal weight stated by Grabner and Heuberger in On the number of optimal base 2 representations,
In the special case of a Boolean algebra, the resulting SJB is orthogonal with respect to the standard inner product and, moreover, we can write down an explicit formula for the
The structure of a Hopf operad is defined on the vector spaces spanned by forests of leaf-labeled, rooted, binary trees.. An explicit formula for the coproduct and its dual product
In this work, our main purpose is to establish, via minimax methods, new versions of Rolle's Theorem, providing further sufficient conditions to ensure global
It is evident from the results that all the measures of association considered in this study and their test procedures provide almost similar results, but the generalized linear
It is easy to prove that B X (D) is a semigroup with respect to the operation of multiplication of binary relations, which is called a complete semigroup of
We see that simple ordered graphs without isolated vertices, with the ordered subgraph relation and with size being measured by the number of edges, form a binary class of
