’ Formats in Choice Experiment Studies:
Consumer Preferences for Genetically Modified
Content and Production Information in Food
journal or
publication title
Journal of Agricultural Policy Research
number
5
page range
1-43
year
2003-12-25
NOTE
Assessing the Impacts of Alternative ‘Opt-out’ Formats in Choice
Experiment Studies: Consumer Preferences for Genetically
Modified Content and Production Information in Food
ANDREAS KONTOLEON
*
MITSUYASU YABE
SUMMARY An important aspect of the design of stated preference choice experiments concerns the inclusion and format of an opt-out option in the hypothetical choice set(s) presented to the respondent. This paper assessed the implications from using alternative ‘opt-out’ formats in choice experiment studies. Two alternative opt-out formats have been widely used, the ‘do not buy’ format and the ‘buy/choose my current brand’ format. The decision of which format to use in di#erent cases may have a substantial impact on the estimated parameters and welfare measures derived from choice experiment data. These impacts are examined in a data set from a choice experiment study on consumer resistance to genetically modified content in foods. A split sample design was used in which the first treatment was provided with the option of ‘not buying’ the good at all while the second with an option of ‘buying their usual brand’. Information over the actual purchasing habits of this latter group was collected and was incorporated into the estimation processes.
The results from each treatment were separately analyzed and the impact of alternative opt-out formats on response patterns and on the significance and stability of coe$cients across treatment groups was examined. In addition, using findings from the experimental psychology literature the possible behavioral and psychological forces that are at work under each treatment were assessed. Finally, certain methodo-logical implications for the design of choice experiment studies are drawn.
+. Introduction
A key methodological issue in the design of choice experiment studies concerns the decision of whether and in what format should an ‘opt-out’ alternative be included in the experimental design (Adamowicz and Boxall,,**+; Carson, et al. +33.). The opt-out alternative is in essence an option that competes with the other alternatives in the choice set. In demand choice experiment (CE) applications, it is usually framed either as a ‘no purchase’ option or in terms of choosing an ‘alternative option’ or one’s ‘customary or favourite brand’ (Tversky and Shafir, +33,; Dhar, +331).+ The use of an opt-out alternative
has been recommended by recent state-of-the-art
CE design guidelines (e.g. Bateman et al., ,**-; Adamowicz and Boxall, ,**+; Bennett and Blamey, ,**+; Louviere et al., ,***). The arguments behind this recommendation include increasing the realism of the exercise (Batsell and Louviere, +33+; Carson et al., +33.), enhancing the theoretical validity of the welfare estimates (Bateman et al., forthcoming ,**-; Adamowicz and Boxall, ,**+) and improving the statistical e$ciency of the estimated choice parameters (Louviere et al., ,***; Anderson and Wiley, +33,). As a result, an increasing number of marketing and non-market valuation CE studies are incorporating an opt-out alternative in their ex-perimental design. However, little attention has been given to the e#ects on choice experiment responses
Accepted+- October ,**-.
from the use ofalternative opt-out formats. Yet, it is likely that the format of the opt-out alternative presented to respondents may impact on how they perceive the choice task. This in turn may have a considerable impact on the resulting choice shares as well as on attribute weights of the estimated multi-nomial choice model. It has been acknowledged, however, that the decision overwhich opt-out format to use under di#erent situations is not an easy task (Adamowicz and Boxall,,**+; Carson et al., +33.). The aim of this paper, therefore, is to contribute to this discussion by assessing the impacts of alternative ‘opt-out’ formats in choice experiment studies.,
This issue is examined in a choice experiment study that sought to ascertain the preferences of the UK public over alternative brands of one commonly consumed food, namely eggs. The aim was to inves-tigate whether decision-making processes over alter-native egg brands are invariant with respect to the format of the opt-out alternative provided to the respondent. A split sample design was used in which two groups of respondents were provided with a choice experiment questionnaire that di#ered only with respect to the opt-out alternative used in the choice sets. The first treatment received a question-naire that included a ‘no-purchase’ opt-out tive while the second a ‘buy-my own brand’ alterna-tive. In the latter case revealed preference informa-tion of one’s customary brand was also collected and incorporated into the estimation process. The results from each treatment were separately analysed and the impact of alternative opt-out formats on response patterns and on the significance and stability of co-e$cients across treatment groups was examined. In addition the possible behavioural and psychological forces that are at work under each treatment were assessed. Finally, certain methodological implica-tions for the design of CE studies are drawn.
,. Opt-out alternatives and choice experiment
studies: Advantages and complications
The main argument for the inclusion of an opt-out alternative in CE studies has been that of realism enhancement and avoidance of a forced choice (e.g. Batsell and Louviere, +33+). Refusing, avoiding or
delaying choice as well as choosing an alternative option or brand to those o#ered is an integral parts of almost all every day market transactions.- Normative theories of rational choice have incorporated the deci-sion ‘not to choose’ as simply another option in the individual’s choice set (e.g. Huber and Pinnell, +33.a). For example, in the random utility framework the probability of observing an opt-out response would be inversely related to the quality of the choice set.. That is, an individual would opt-out if the quality level of the options in the choice set did not surpass a subjective threshold (reservation) utility level.
The immediate implication of disallowing the possibility of choice deferral is that this may induce individuals to make forced and biased choices. Sever-al studies from the experimentSever-al psychology and mar-keting literatures have shown that respondents faced with a forced choice tend to choose certain options in the choice set on the basis of simplifying and com-promising heuristics that mask ‘true’ individual pref-erence revelation (e.g. Dhar and Simonson, ,**+; Dhar,+331; Huber and Pinnell, +33.a; +33.b; Olsen and Swait, +332; Tversky and Shafir, +33,). These biases could lead to an overstatement of the likeli-hood that the individual would actually choose one of the hypothetical alternatives if choosing to purchase nothing or an alternative brand is preferred over the hypothetical alternatives as well as to biased estimates of the importance of the relevant weights of the choice attributes (Banzhafet al., ,**+)./
In cases where the analyst is examining demand behaviour (such as recreational site choice, market purchases of alternative product brands etc.) the inclusion of some ‘opt-out’ option in the choice set is necessary if the estimated welfare measures results are to be consistent with demand theory. This is so because demand e#ects (non-purchase options) can only be identified if the possibility of opting out is provided (Bateman et al., ,**-; Adamowicz and Boxall,,**+; Bennett and Blamey, ,**+; Batsell and Louviere,+33+). Hence, not incorporating a default or no choice alternative in a CE renders the resulting estimated models inconsistent with demand theory and makes di$cult the interpretation of welfare measures such as willingness to pay (WTP).0, 1
Finally, there are other practical advantages of including an opt-out alternative in the choice sets of CE studies such as aggregating date sets that use the same opt-out alternative (e.g. Haab and McConnell, ,**,; Louviere and Woodworth, +32-) as well as enhancing the e$ciency of the experimental choice set design (e.g. Haaijer et al., ,**+; Louviere et al., ,***; Anderson and Wiley, +33,).2
The introduction of an opt-out alternative, how-ever, may also generate complications in the analysis of CE data sets. These concern both various behav-ioural implications as well various econometric chal-lenges that emerge from the inclusion of such an alternative.
Regarding the former, the opt-out option may distort the incentives for ‘true’ preference revelation as predicted by rational choice theory (Carson, Groves and Machina, +333). The main source of distortion is that it provides an ‘easy way out’ to respondents faced with a ‘di$cult’ choice situation (Huber and Pinnell, +33.a; Dhar and Simonson, ,**+; Luce, +332). Numerous experimental psychol-ogy studies have questioned the conviction of many normative choice theories (such as random utility theory) that the decision to opt-out is a reaction to poor choice-set quality or attractiveness. Instead they have interpreted opting out as means of coping with decision di$culty. The implication from this body of work is that when faced with a di$cult choice, indi-viduals may be induced to employ decision-making processes that may invalidate or bias the predictions of normative choice models.3
Early psychological work has analysed choice di$culty and conflict as the result of lack of respond-ent ‘experience’ or ‘confidence’ as well as ‘trade-o# di$culty’ (e.g. Berlyne, +30*; Tyebjee, +313; Janis and Mann,+311; Shepard, +30.; Kiesler, +300). Other stud-ies have argued that individuals prefer consequences that arise of inaction over those arising from action since the decision to stay within a status quo has certain psychological advantages (e.g. Haaijen,+333; Baron and Ritov,+33.; Ritov and Baron, +33*). More-over, other theories have viewed choice di$culty and conflict as stemming from low ‘a#ective di#er-ences’ within the choice set. These theories predict that the individual will choose to opt-out if a threshold
level of within set ‘heterogeneity’ is not available (e.g. Bockenholtet al., +33+; Busemeyer and Rapoport, +322). In fact, the majority of the experimen-tal psychology literature works on this premise, namely that individuals tend to choose the opt-out alternative when faced with a choice set that contains relatively homogeneous options (e.g. Huber and Pinnell, +33.a; Tversky, Sattath and Slovic, +322; Dhar and Glazer,+330; Shafir,+33-). Choice set homogeneity would increases decision di$culty and conflict leading to a higher tendency to defer choice.+* The motives for opting out under decision di$culty have been explained in terms a ‘cost’ that the individ-ual is willing to accept in return for the ability of continuing the search for more (and better) alterna-tives or for more information as well as a means for reducing the risk of making a ‘wrong’ decision (Huber and Pinnell, +33.a).
Along these lines, Dhar (+331) has shown that adding an attractive alternative to an already attrac-tive choice set increases the preference of the no-choice option. This finding has been generalised to more complex choice sets involving more dimensions and more choice alternatives in field studies (e.g. Huber and Pinnell, +33.a) controlled laboratory studies (e.g. Tversky and Sha$r, +33,) as well in studies involving real decisions and pay-o#s (e.g. Dahr,+331).
Regarding the types of options that individuals select when encountered with a di$cult choice and are forced to choose (i.e. when opt-out is not avail-able) these have been found to be (a) base-line options that represent ‘average’, generic or ‘com-promise’ options (e.g. Simonson,+323), (b) asymmet-rically dominating alternatives (i.e. alternatives that have one dominating dimension) (e.g. Montgomery, +323; Tversky, Sattath and Slovic, +322; Slovic, +31/) and (c) high quality high price alternatives (e.g. Simonson, +33,; Simonson and Tversky, +33,). In all cases, experimental psychologists contend that the individual selects such alternatives since they are easier to justify, less susceptible to criticism and are associated with a lower likelihood of error and regret. Recently Dhar and Simonson (,**+) have con-firmed these findings using a series of laboratory experiments involving real pay-o#s. The authors
present empirical evidence that question the implicit assumption made in the choice experiment litera-ture that the inclusion of a no-choice option only draws proportionately from the various available alternatives, such that the qualitative conclusions are una#ected. They show that the no-choice option directly competes with alternatives that individuals tend to select when they are faced with a di$cult choice and forced to choose. The implication of these findings is that compromise, asymmetrically domi-nating and high quality/price options are most vul-nerable to competition from the no-choice option. Conversely, they show that options that appear to be selected because of the decision maker’s underlying preferences are a#ected to a much lesser degree by the introduction of the no-choice option.++
In addition to these behavioural implications, the use of opt-out alternative also bears certain econometric challenges. First, in many cases the no-choice alternative provides no information about the individual’s relative preferences for attributes of the hypothetical alternatives - one of the main aims for undertaking a choice experiment in the first place. Secondly, the opt-out alternative may perplex the analysis of CE data since in many cases it is not apparent what attribute levels are associated with the opt-out option. For example, in many recreation studies it is not clear what respondents are selecting when they do not choose any of the o#ered recreation packages (choose another package, choose a substi-tute good etc.). One way around this di$culty is to construct and include a fixed alternative with non-zero attribute levels that serves as a baseline option. Though, the inclusion of such an option may enhance the e$ciency of the experimental design (Louviere et al., ,***) it does not avoid the issue of inducing a forced choice since the individual may still prefer his/ her current brand over the alternatives o#ered in the choice set (Banzhafet al., ,**+).
Thirdly, an implicit assumption in the choice experiment studies is that the opt-out choice would take share proportionately from the various available alternatives, consistent with the assumption of in-dependence of irrelevant alternatives (IIA). This im-plies that the qualitative conclusions in understanding the tradeo#s consumers make among options should
be (according to the IIA property) una#ected from the inclusion or not of the opt-out alternative. How-ever, the IIA assumption tends to be violated when the opt-out alternative is introduced since it tends to take away greater share from certain options rather than others that individuals tend to select under forced choice (Dhar and Simonson,,**+). This is so because the reasons to choose the no-choice option may di#er from those governing the choice of any of the other profiles in a choice experiment and hence the ‘no-choice’ option cannot be seen as just another choice alternative, leading to potential violations of IIA (Haaijen, +333). The violation of the IIA as-sumption implies that any experimental findings may be systematically biased and lead to incorrect predic-tions about relative shares and attribute weights when consumers have the option not to choose. This poses added econometric challenges to the researcher of detecting and solving possible IIA violations.
Finally, some have pointed out that the opt-out alternative may not be desirable and should not be used in certain cases. Dhar and Simonson (,**+) point out under certain conditions if consumers be-lieve that choice must be made sooner or later or that procrastination is damaging, they might prefer not to have the no-choice option.+, In practice, CE practi-tioners have justified the decision not to include an opt-out alternative along these lines. For example, Blamey and Bennett (,**+) in a study on en-vironmental friendly toilet paper claim that the exclu-sion of the no-choice option would introduce only a small bias in market share estimates. They argue that this bias is worth accepting in order to avoid the potentially greater ‘easy way out’ bias that may arise if the opt-out alternative is o#ered. Implicit in the reasoning utilised by such studies is that the opt-out alternative is framed in terms of ‘no-purchase’. How-ever, the opt-out option can be framed in terms of ‘choose an alternative brand’ and this would retain the theoretical validity of the study as well as the realism of the exercise. The realities of choice are such that the individual has the discretionary ability to avoid or delay choice or purchase a substitute good. Hence, allowing respondents that participate in CE studies the possibility of opting out appears to be warranted in virtually all cases. The following
section argues that whilst the decision to include the opt-out alternative seems relatively unambiguous, the decision overwhich opt-out format to employ is neither innocuous nor easy to determine.
-. Choosing between alternative opt-out formats
The general conclusion from the preceding dis-cussion is that despite the potential distortions and complications from using the opt-out alternative it should be routinely included in CE designs (under some format) since it enhances both the realism of the experiment and the statistical robustness of the estimated results (Olsen and Swait, +332).+- The most commonly used opt-out formats are “I would not choose any of theses alternatives” and “I would choose my favourite /customary brand”. However, leading CE practitioners have come to acknowledge that ‘the form of the opt-out alternative is not easy to identify’ (Adamowicz and Boxall,,**+).
Severala priori recommendations as to which of these formats to use have been proposed. For exam-ple, Batsell and Louviere (+33+) suggest that we use the format that most “closely approximates the choice setting experienced by individuals in real market conditions”. Further, Carson et al. (+33.) have suggested that the no-purchase option may be more useful in cases that seek to investigate market share, market penetration and participation. Alterna-tively the ‘own brand’ format may be more suitable for situations that seek to investigate which attributes or what levels of attributes a new product or good must have in order to attract new consumers. (Carsonet al., +33.). Finally, others have suggested (Dhar and Simonson,,**+; Blamey and Bennett, ,**+) that the ‘no-choice’ format should not be used when the individual cannot realistically avoid making some choice. Prolonged holding out from choosing basic goods with no close substitutes, such as basic foods, may seem unrealistic.
Yet, such recommendations are quite vague and inconclusive while they have yet to be empirically examined. Determining which opt-out format closest approximates real market transaction is not always evident by virtue of the complexity of many everyday decisions. Further, research studies often involve
overlapping goals and objectives (e.g. studies may be interested in both determining market participation as well as the a#ective level of new attributes). Final-ly, choosing ‘not to choose’ is an integral part of almost all decisions, including decision over basic (inelastic) goods. For example, decisions over basic foods often include considerations over food safety levels that may induce individuals to hold-out for prolonged periods of time.+.
The di$culty in choosing the format of the opt-out alternative is evident in the marketing literature where both the no purchase and the own brand format have been used but no evident and consistent pattern of which format is more suitable under di#er-ent situations is discernable.+/ The situation is even less clear in the non-market valuation literature where CE practitioners have almost exclusively used the ‘no-choice’ opt-out option even in cases where the ‘choose an alternative brand’ would seemed more reasonable.+0 A tacit assumption made in these stud-ies is that the individual’s decision-making process is invariant with respect to the opt-out format o#ered to the respondent. A corollary of this assumption is that the probability of choosing a particular option (or its choice share) is probabilistically independent of the opt-out format faced by the decision maker. Although this is an empirical issue, CE analysis have come to acknowledged that it is reasonable to expect that di#erent opt-out alternatives would imply di#erent behavioural implications and would be associated with di#erent choice shares and attribute weights (e.g. Olsen and Swait, +332; Adamowicz and Boxall,,**+).
Despite reaching this realisation, the CE litera-ture is almost entirely void of any comparative studies examining the e#ects from the use of alternative opt-out formats as well no attempts to corroborate thea priori recommendations mentioned above. The only exception can be found in the work by Banzhaf et al. (,**+).+1 The authors use the choice modelling
approach to investigate the e#ects of alternative opt-out options on the preferences of anglers over alterna-tive fishing sites. The authors do in fact find that the choice of the opt-out format has serious implications for choice model parameter salience. Yet, contrary to their a priori expectations they find that the ‘choose
my usual fishing site’ format outperformed (on both behavioural and statistical grounds) the ‘choose nei-ther site’ option. This highlights the claim made about the vagueness ofa priori recommendations over which opt-out format to use and the need for further research in this field. This is so, because the objec-tives of CE studies and the nature of the ‘goods’ being investigated are often multifaceted and thus it is by no means apparent which option is most appropriate to use. Hence, further empirical investigation on the impacts of alternative opt-out formats is warranted.+2 The next section describes the issues and hypotheses that will be explored while Section / presents the details of the experiment used to examine these hy-potheses.
.. Assessing the impacts of alternative opt-out
formats
As explained above it is likely that alternative opt-out formats may have di#erential impacts on both relative choice shares as well as the estimated param-eter results. This was attributed to the possibility that di#erent opt-out formats may induce respondents to evaluate the choice sets in di#erent ways (Banzhaf et al., ,**+). The possible di#erential impacts from alternative opt-out formats were explored in a CE case study. The overall purpose of the study was to explore the impact on individual purchasing decisions from introducing various levels of genetically mod-ified content in one commonly consumed food, namely eggs. Most of the food studies from the marking literature (e.g. Olsen and Swait, +332 on orange juice consumption) andall of the food-safety studies from the non-market valuation literature (e.g. Kuperiset al., +333 on chemicals in milk) have used the ‘no purchase’ opt-out format. Yet, intuition suggests that such an opt-out format may bias the results of the study in that it may be interpreted by some respondents as an unrealistic forced choice. Confronted with such a choice situation the individu-al may be compelled to choose one of the hypotheticindividu-al brands o#ered instead of going without the good. Yet, the individual may, in fact, have preferred another alternative brand (such as their customary brand) and hence the forced choices would lead to an
overstating of the likelihood of selecting a particular brand with the hypothesised characteristics. Con-versely, if individuals that choose not to purchase any of the hypothetical alternatives when in fact they preferred their customary brand, then the resulting CE data would underestimate the likelihood of con-suming the good. An alternative format that has not been explored by the valuation literature and may avoid this bias is the ‘choose my own brand option’. Since the determination of the most appropriate opt-out format has not been fully explored by the CE literature, both formats were examined in a split sample design. The study examined the possible impacts from alternative opt-out formats on choice shares as well as attribute weights. The study also tried to understand the nature of the di#erential impacts as well to try to assess which format would be most suitable for the specific case study. Finally, the study aimed at drawing some more general methodol-ogical conclusions for the use of the opt-out alterna-tive in CE studies. More specifically, five four possi-ble di#erences that may emerge as the result of using one of these two opt-out formats will be explored. The first hypothesis that is explored states that:
H+: The relative share of the opt-out
alterna-tive is higher when this is framed in terms of choosing one’s ‘own brand’ as opposed to the case where it is framed in terms of a ‘no purchase’ alternative.
Various possible explanations lie behind this prop-osition. As mentioned above, the frequently used ‘no purchase’ option may induce some respondents to respond as if faced with a forced choice. This may be the case when prolonged holding out is perceived as unattainable, pointless or undesirable. This may lead individuals to select choices that they would not have chosen had they been provided with the option to select an alternative brand. Hence, the no pur-chase option may be systematically avoided and this may possibly overstate the likelihood of certain of the other choices. Moreover, as mentioned in Section,, introducing an inferior option into the choice set usually induces respondents to favour not to opt-out (e.g. Dhar and Simonson,,**+). To the degree that
the no purchase alternative is seen as an undesirable alternative, its inclusion in the choice set would yield less opt-out decisions. Further, it was also stated in Section, that the inclusion of the opt-out alternative may provide an avenue for resolving di$cult choices and induce people to opt-out (e.g. Huber and Pinnell, +33.a). One could reasonable expect that this e#ect may be more prevalent in cases where individuals are o#ered the option to choose. Following the discussion of Section ,, this could be argued on the basis of regret, risk aversion, ‘default bias’ as well as compla-cency to retain the status quo. Adamowicz and Boxall (,**+) point out that to the degree that such e#ects are observed in the real world then there is little to be concerned. What is important to keep in mind, is that CE studies should include the opt-out format that best approximates real market transactions even if that induces relatively more choice deferral than an alternative opt-out format.+3
Turning to the second hypothesis to be tested, it is important to examine whether the di#erent shares of the opt-out alternative generated under the two alternative formats would disproportionately take from the shares of specific options in the choice set. Many CE studies imply that the use of any opt-out format would draw proportionately from all the other alternatives in the choice set. Yet, it may be the case that some opt-out formats induce respondents to sys-tematically favour some alternatives over others. This implies that di#erent opt-out formats may com-pete with some options more than they do with others. More specifically, the ‘no purchase’ format used in most CE studies may be perceived by some respondents as a form of forced choice. Section , described how decision making processes under forced choice has been found to be influenced by simplifying heuristics that tend to select options that are perceived as having the lowest likelihood of error or regret, are easy to justify (to themselves and others) or appear to be the best possible compromise. Such options include generic brand, asymmetrically dominating and high price and quality alternatives. Systemic favouring of these options may overstate their choice share as well as the salience of the attributes that characterise these options.
In contrast, the ‘own brand’ format may dampen
the e#ects of such simplifying heuristics since individ-uals may feel free to select their usual brand if none of the alternatives in the choice set yield utility beyond their reservation level. Further, extending the rea-soning of Dhar and Simonson (,**+) the choice share of the opt-out option under the ‘own brand’ format would take from the share of that alternative that may be associated with a lower level of criticism and regret but not with strong preference. In other words, the opt-out alternative under the ‘own brand’ format would compete more directly with options that are selected when individuals feel that they are forced to choose, as may be the case in the ‘no purchase’ format. These alternatives have been found to be high-price quality options, generic brand options as well as asymmetrically dominating options. The study presented in the next section included in the choice sets certain fixed (baseline) options that processed these characteristics. The inclusion of such alternatives allowed the examination of the following hypothesis:
H,: The relative share of a generic,
asymmet-rically dominating or high price-high quality option that is included as a fixed alternative in the choice set will be higher when the set includes a ‘no purchase’ opt-out alternative compared to when it includes the option of choosing one’s ‘own brand’.
The third hypothesis involves the e#ects of alter-native opt-out formats on respondent fatigue. Typi-cally, choice experiment studies present respondents with multiple choice sets and request that the individ-ual provide a response in each case. This is necessary so that enough choice variability is attained which is required for estimating multinomial discrete choice models. The optimal number of choice sets presented to each individual varies depending on the complexity of the choice task, the conditions under which the experiment is conducted and the incentives provided to respondents. Any number between four and six-teen choice sets are usually used (Louviere et al., ,***). The phenomenon of respondent fatigue refers to cases where the individual’s mental capacity (or simply patience!) may be exhausted after the first few
rounds of choice sets. The phenomenon of fatigue is one of the main design issues that is still under great scrutiny (e.g. Alpizar and Carlsson, ,**+; Louviere et al., ,***; Adamowicz and Boxall, ,**+; Bradley and Daly,+33.). Respondent fatigue could result in various ‘atypical’ response patterns. For example, fatigue may be manifested as an enhanced occurrence of the default or the opt-out option after a few rounds. It is plausible that the degree of respondent fatigue may di#er across alternative opt-out formats. The direction of this di#erence is not clear a priori and hence we will investigate the two-way hypoth-esis that:
H-: Respondent fatigue rates di#er across
choice settings that use alternative opt-out formats.
The fourth hypothesis concerns di#erences in choice model parameter salience as the result from using alternative opt-out formats. As mentioned above, it is likely that the two opt-out formats may induce individuals to evaluate the chose sets di#erently (Banzhafet al., ,**+). For example, the no-purchase format may be perceived as entailing a forced choice. It is, thus, reasonable to expect that under forced choice the individual may utilise a di#erent decision making rule than would be used under free choice or when they could choose their ‘own brand’.,* Regardless of the exact decision mech-anisms followed under each condition, changes in decision rules should induce di#erent weights for one or more attributes (Olsen and Swait,+332). Hence, we should expect a change in the estimated attribute weights between conditions in which the opt-out alternative is framed as a no-purchase option and cases in which it is posed in terms of an ‘own brand’ choice.,+ The hypothesis to be tested is thus:
H.: Attribute weights will di#er across choice
settings that use alternative opt-out formats.
Olsen and Swait (+332, pp. -ῌ.) provide some guidance as to the nature of the di#erences in attri-bute weights. Research from consumer behaviour and experimental psychology literatures has been
providing increasing evidence that individuals resort to cost or e#ort minimising decision making processes as a means of overcoming their limited information processing capabilities (Bettmanet al., +33+; Bettman et al., +332). Individuals seem to be trading o# be-tween the costs (in terms of mental e#ort) of reaching a decision and the accuracy of the decision reached. A ‘good’ decisions is reached without expending inordinate amounts of mental and other resources in the process (Shugan, +32*; Karni and Schwarz, +311; Stigler, +30+). Based on this reasoning it can be argued that individuals that are faced with the more restrictive choice setting that includes a no-purchase alternative will tend to adopt simpler heuris-tics than they would under a ‘choose their own brand’ setting. For example, individuals faced with a forced choice may choose a decision protocol that minimizes the likelihood of error or regret. It is reasonable to expect that individuals will more easily avoid expend-ing greater e#ort if their goal changes from selectexpend-ing the ‘best’ alternative (when the option to choose their own brand is available), to minimizing the conse-quences of having to choose among alternatives that might all be inferior (when faced with the restrictive no-purchase opt-out format). To the extent that this is true (i.e. decision makers try to reduce the ‘costs’ of having to choose unacceptable options and therefore appeal to simplified secondary choice rules when faced with a forced choice), it is likely that preference models will indicate the existence offewer non-linear relationships compared to when the ‘own brand’ option is available (Olsen and Swait, +332).,, Such non-linear relationships or conjunctive decision mak-ing processes will be captured by significant attribute interactions terms. Hence, the final hypothesis that we will be testing is:
H/: A choice setting using the ‘no purchase’
opt-out format would identify less interaction e#ects than one using the ‘buy my own brand’ format.
/. Experimental design and survey development
These hypotheses were examined in a CE case study investigated the preferences of UK consumers
over alternative egg brands or profiles. Although the particular good is frequently consumed by most UK households, the specificities of the study suggested that including an opt-out alternative is warranted. More specifically, the overall objective of the study aimed at examining the impact on individual food purchasing decisions from the introduction of per-centages of genetically modified content into food products. Individuals may, thus, decide to stop or delay consuming a particular good if informed that it was genetically modified or that genetically modified ‘inputs’ were used for its production. For example, if informed that the chicken feed used for egg production contained a specific amount of GM con-tent (that exceeded his/her subjective reservation level of ‘GM-acceptance’), the individual may stop purchasing the specific good. Alternatively, some individuals may have strict a priori egg brand require-ments (e.g. they only buy free range and organic) while others may overwhelmingly prefer their usual brand of eggs irrespective of the characteristics of the hypothetical brands o#ered. For these reasons the use of an opt-out alternative was deemed reasonable yet it was by no means clear which opt-out format to use. Would it be more suitable to use a no-purchase opt-put format (as used in all of the food-safety CE studies undertaken to date) or should we allow indi-viduals the possibility to choose their usual brand? Therefore, the study was viewed as a suitable oppor-tunity to examine the impacts on choice shares and attribute weights from the use of these two alternative opt-out formats. This was achieved by using of a split sample experimental design described in the subsec-tions below. Note that, it was decided from the outset to administer the survey via post. Hence, the design e#orts summarised below were undertaken with the specificities of such a survey mode in mind.
/. + Consultations, focus groups, and pilot studies The survey design processes began in February ,**+ with a series of consultations with scientists from the genetic food industry (Dr. Pablo Eyzaguirre from the International Plant Genetic Resources Insti-tute (Rome, Italy) and Dr. Tim Soellick from the Max-Planck-Institute (Cologne, Germany),- as well
as with managers from two leading food retailers in the UK (Tescos and Sainsubury’s) as well as the sales manager from a food retailer specialising in health and organic foods (Planet Earth). Additional meet-ings were held in other stages of the survey design process. The aim of these consultations were to determine (i) an appropriate good for examining trade-o#s between GM content and other attributes (such as prices), (ii) the attributes and levels that should be used to design the choice profiles and (iii) the level of information that should be provided to respondents.
At the same time an extensive review of the literature on the economics of GM foods and food safety was conducted. This consisted of reviewing mostly applied work examining issues of market segregation, labelling and certification. One of the most prominent aspects of these issues that has con-cerned both the academic and policy journals has to do with the determination of the maximum GM content that would be allowed for a specific crop or food product to be granting GM-free certification. This percentage varies across the di#erent countries with a range between +ῌ and +*ῌ. The current threshold for all foods circulating in the EU is +ῌ. Yet, the importance of setting such unilateral thresh-olds is undermined by the influx of imported foods that originate from counties that follow considerably di#erent GM food polices. In light of these problems, the EU is currently reviewing its own GM policy including ongoing discussions for raising the GM-free content level to /ῌ. Further, the majority of work on the issue of changing GM content threshold levels has been mainly preoccupied with the cost side of this change (e.g. Bullock et al., ,***; European Commission,,***; Mooney and Klein, +333; Franks, +333; Nelson et al., +333). Moreover, considerable work has been undertaken on consumer attitudes and perceptions for alternative levels of GM content in foods.,. Yet, very little work has been undertaken on the benefit side of the issue of a#ective GM content threshold levels. Hence, the CE experiment presented here aimed at providing a contribution to this ne-glected area of the GM policy debate. Finally, the literature review also extended into the valuation literature examining food safety issues. Valuation
studies on GM foods are just starting to emerge and were virtually absent at the time the study was being developed.,/ In contrast there are quite a few contin-gent valuation (CV) and CE studies on various other food safety issues which provided useful insights on various design and administration procedures.,0
On the basis of these consultations and the review of the literature on the economics of GM food and food safety a focus group protocol was designed. The protocol aimed at identifying the quality and quantity of knowledge that individuals had over bio-technology in general and genetically modified foods in particular. In addition perceptions and attitudes towards GM foods were also ascertained as well as a first indication of how decisions over food products would be altered as the result of introducing various levels of GM content into foods. Finally, the good to be used as well as its scope was investigated. In total, three focus groups session were conducted in April and May ,**+. Twelve individuals participated in these sessions. The sessions lasted approximately,./ hours each and monetary compensation was provided to participants. Recruitment was undertaken in the central London area with most focus group partici-pants originating from the University of London sta# body. Both gender groups were included in the sessions while the mean age was thirty-eight years.
These initial design e#orts confirmed the finding encountered in attitudinal studies (e.g. Verdurme and Viaene, ,**,; Veeman, ,**+; Heiman et al., ,***) that the public has a varied and often erroneous understanding of biotechnology and GM foods. Hence, it was decided to present a common (bench-mark) information level to each respondent. Further, it was decided that it would be considerably less complex to design and administer a study that exam-ined decisions with respect to one food product as opposed to decisions over food consumption in gen-eral.,1 The specific food product that was chosen was a box of six eggs. The CE study would examine the impacts on egg consumption decisions resulting from the use of chicken feed that contained various levels of genetically modified content.,2 This partic-ular good was chosen mainly on the basis of its wide-spread familiarity and consumption across UK consumers. Also, the good has several well known
and understood attributes compared say to a partic-ular vegetable or fruit. Further, the selection of this particular good permitted investigation of consumer decisions over goods that have been produced with GM ‘inputs’ (e.g. live stock products) as op-posed to examining decisions concerning GM crops themselves (e.g. soya, rice, and corn). This makes the study particularly policy relevant since the desig-nation of food products that contain GM inputs still remains an open issue.,3, -*
The survey design process concluded with a series of pilot studies that addressed issues of word-ing, framword-ing, attribute level determination, informa-tion level and quality assessment, survey length, administration method and sampling procedures. A first pilot was undertaken in June,**+ consisting of a convenience sample of-/ respondents recruited from the congregation of a central London church. Will-ingness to pay for particular egg brands was ascer-tained using a CV payment-card while the drop o# method was used to administer the pilot survey. A second pilot was conducted in July,**+ consisting of +,- university students. The pilot o#ered the chance to test a draft version of the CE survey. The pilot was administered in groups of students (with no between subject interaction) that received a common presen-tation. A final pilot was conducted in August-September,**+ in which we tested the questionnaire that was to be used for the final survey. Finally, since the final survey was to be administration via mail the last pilot also provided a test of the administration and sampling strategy that would be used. In total +*** survey packets were sent out. The response rate was a modest +-ῌ that may be explained by the unfortunate timing of the pilot (many respondents were away on holiday) as well as the absence any of incentives commonly used in mail surveys.-+ The overall results of the pilot, however, suggested that the questionnaire performed well in the field and that the variability in the choice sets permitted satisfacto-ry estimation of the e#ects of egg attributes on indi-vidual utility.
/. , Choice set and experimental design
deter-mined from the consultations, focus groups, and pilot studies mentioned above. The number of levels chosen aimed at achieving a balance between choice set e$ciency, correspondence to market realism and enhancement of the variability of each attribute.-, In total five attributes were selected, three of which were binary while the remaining two took on four values. The set of attributes and levels is listed directly below:
+) Living condition of hens: free range Vs cage ,) Use of agricultural chemicals and fertilizers in the production of chicken feed: no use (organic) Vs use (non-organic)
-) Certification of health standards and quality of eggs (e.g. the ‘Lion Quality’ mark on egg shells and egg boxes): included Vs not in-cluded
.) GM content in chicken feed: *ῌ, /ῌ, +ῌ, and-*ῌ
/) Price: ῍*.-2, ῍*.02, ῍*.32, and ῍+.,2 The characteristics of ‘box size’ and ‘egg size’ were held constant. Hence each profile consisting of a box of six medium-sized eggs. A fractional factorial design prescribed in Louviere et al. (,***, pp. +++ῌ +,* and +-+ῌ+-1) and Louviere (+332) was used to create-, choice sets that contrasted two di#erent egg profiles. One of the characteristics of this particular design is that it allows for the independent estimation of all main-e#ects and two-way interactions. In order to reduce task complexity it was decided to present each individual with only eight choice sets or occasions. Hence, the set of -, choice sets were randomly blocked into four versions (i.e. of eight choice sets each). The sample was then randomly divided into four groups with each sub-sample receiv-ing one version. To increase the e$ciency of the resulting choice model a third fixed option was added to each chose set (Louviereet al., ,***, ch. /). This option was held constant within each version but varied across versions. In total three such fixed options were used. The first represented a high price-quality alternative that dominated all other al-ternatives. It consisted of the characteristics of ‘free range’, organic,*ῌ GM content, certification mark included on box and a price of+-0 pence. The second
represented a ‘generic’ brand of eggs that was con-structed on the basis of the initial market research e#orts mentioned in the previous section. It consisted of the characteristics of ‘free range’, non-organic,/ῌ GM content, certification mark included on box and a price of 12 pence. The third also represented a generic brand but consisted of eggs from hens that are kept in battery cages (instead of coming from free range hens). The introduction of these particular fixed options would allow for the testing of the second hypothesis presented in Section..
Finally, the choice set included a forth option, D, which allowed individuals to opt-out. A split sample design was used such that each treatment would receive a di#erent opt-out alternative. The first treat-ment (TA) would receive a ‘no purchase’ alternative while the second (TB) a ‘buy my regular brand’ alternative. The choice sets across treatments were identical apart from the format of the opt-out alterna-tive. The respondents in the former treatment were informed that the options included in each choice occasion were the only ones available and that choos-ing D implied that they would not purchase any eggs when faced with these alternatives. Respondents in TB were informed that choosing option D amounted to selecting their own brand. Moreover, revealed preference information on the characteristics of respondent’s own brand of eggs was collected. The in-formation on egg characteristics provided in the re-vealed preference section corresponded to the attrib-utes included in the hypothetical choice sets. Note that the choosing the ‘my own brand’ option requires modelling of the characteristics of the favourite brand as well as developing a link between the stated preference model and a revealed preference model (Adamowicz and Boxall,,**+).
0. Questionnaire material and survey
adminis-tration
The final questionnaire consisted of four sec-tions: (a) a section that obtained revealed preference egg consumption data; (b) a section explaining the choice experiment exercise in terms of an imaginary shopping trip. This included explanation of the attrib-utes and levels of the egg profiles as well as a
diagrammatic ‘simulation’ of how to complete the choice sets; (c) the section with the eight choice set questions. This was the only section that di#ered across the four questionnaire versions; and (d) a section with questions on individual attitudinal and demographic characteristics. A copy of the survey can be provided by the authors. The ‘Total Design Method’ of Dillman (,***) and the prescriptions of Mangione (+333) for administrating a postal survey were closely adhered to in order to maximise response rates, minimise item non-response and enhance sample representativeness.
--First, a pre-notification letter was sent out ex-plaining the aims of the study, the institution under-taking the exercise, the means by which their house-hold was sampled, and the importance of completing and returning the questionnaire.-.Approximately two weeks after the pre-notification letter had been dispatched the ‘questionnaire packet’ was sent out. This consisted of (i) a cover letter that re-iterated the points made in the pre-notification letter but also explained the procedure for completing and retuning the survey; (ii) an information booklet that provided a brief, balanced and non-emotive exposition of the possible benefits and risks to humans and the environ-ment from cultivating and consuming genetically modified foods; (iii) a copy of one of the four ques-tionnaire versions together with self addressed enve-lope with prepaid postage; (iv) two ‘incentives’
pre-scribed by Dillman (,***) and Mangione (+333) to enhance response rates. These consisted of a comple-mentary pen with university logo and a lottery post card that allowed those that completed the survey to enter a draw for a gift voucher worthῐ/*.-/ Finally, two reminder packets were sent out at two-week intervals after the first round had been dispatched. These packets only included a reminder cover letter and one of the four questionnaire versions (together with self addressed return envelope with prepaid post-age).
1. Sampling strategy
The sampling strategy that was followed was based on the multi-stage procedure suggested by Lynn and Lievesley (+33+). This approach is tailor made for drawing samples in Great Britain. The first step of the sampling strategy involved selection of seven sampling locations. Four of these were urban and three rural areas (see Table +). Secondly, these locations were divided into primary sampling units (PSUs) on the basis the number of post-code areas they included. In total, these seven locations contained .+2 PSUs. This corresponds to the sam-pling universe. Thirdly, a total of 2* PSUs were randomly sampled. The number of PSUs selected from each sampling location was determined on the basis of its relative weight (determined by its relative
Table +. Sampling strategy
Location Total number of PSUs in locationa Related weight from PSUs Populationb Relative weight from population Total relative
weight Randomlyselected number of PSUs
Number of households selected A B῏A/Total A C D῏C/Total C E῏(B῍D)/, C D῏C῎,/ Aberystwyth Birmingham Cardi# Dorset Aberdeen Inverness Nottingham .-1/ /0 ,--2 0* +,-*4+* *4+2 *4+-*4*0 *4*3 *4+. *4,3 0+5+*3 +5*+-5.** ,0253-. 03,5/.* ,+,50/* ,*251** 0-5*** *4*, *4.* *4++ *4,1 *4*2 *4*2 *4*, *4*0. *4,3+ *4+,* *4+0/ *4*22 *4++-*4+0* . ,, +* +. 0 +* +. +** //* ,/* -/* +/* ,/* -/* Total .+2 + ,5/,*5--- + + 2* ,5***
Notes:aSource: UK-Info Disk ,**+. */ Pro CD ROM and http://freepages.education.rootsweb.com/ wakefield/postcodes/b.html
(access at,*. *1. ,**+).
PSU and relative population weights).-0 Finally, ,/ households were randomly selected from each of these 2* PSUs. The final list of addresses was ex-tracted from the UK Info-Disk Professional (,*** edition). This process generated a sample of ,*** households (+*** for each opt-out treatment). The four questionnaire versions were randomly assigned to each household such that ,/* households from each treatment received one survey version.
2. Response rates, sample composition and
rep-resentativeness
The response rates from the two treatments were -- and -+ῌ respectively. These rates are more than double than that obtained in the pilot (i.e. +-ῌ), which suggests that the inducements and reminder letters used for the final survey did in fact increase the response rate. Still, the overall final response rates remain relatively low compared to other CE studies. Yet, the only other known CE postal study on GM foods also had a modest response rate of+2ῌ (James and Burton,,**+). Hence, provided that there is no methodological shortcoming in the design of the study or some other sampling or administrative flaw, then the modest response rates may be attributed to limited interest in the issue of GM foods.
Moreover, the sample composition in terms of socio-demographic and attitudinal characteristics was virtually identical across samples (see Table,). Hence, we can reasonably conclude that the two samples are identical in terms of their socio-economic and attitudinal make up.
In addition the overall representativeness of the two treatment groups (i.e. compared to the overall population) seemed very satisfactory. The data re-ceived for age, education, family size, number of children, and income are quite representative (see Table,). Yet, some deviations from national figures must be highlighted. Notice first that the sample is over-represented (compared to national census figures) by females as well as individuals between.* and 1* years of age. This is expected since we had asked for the main grocery ‘shopper’ to complete the survey. Also, notice that the sample mean and educa-tion levels are somewhat higher than naeduca-tional figures.
Also, the data on revealed egg consumption patterns is highly representative as compared from the data published by the British Egg Information Service (see Table-). Finally, there is a credible indication that the attitudes towards GM foods held by these two treatment groups are closely aligned with those of the general population. The CE survey included five attitudinal questions that were taken from a recent Euro-Barometer questionnaire that sought to exam-ine European perceptions and attitudes towards GM foods (EuroBarometer,,***). By incorporated these questions in the CE survey it was able to externally validate, to some degree, the attitudes towards GM foods held by the individuals in the sample (see Table ,).-1 We can conclude that overall the sample is quite
representative with respect to demographic, attitudi-nal and egg consumption characteristics. The sample, however, somewhat is over-representative of higher income/education individuals, which should be taken under account when using the study results for draw-ing policy implications.
With respect to item non-response we see that around0./ῌ of the sample did not complete the CE questions while the missing data on socio-economic variables was quite low (between+ῌ and 0ῌ on key variables; see Table , and Table -). Observations with missing data were excluded from the sample. The final number of usable questionnaires in each treatment (after accounting for missing data) was -+, for TA and ,1* for TB.
3. Response patterns and choice shares
We now turn to examine the first three proposi-tions set out in Section. (H+to H-), on the possible
di#erences in choice shares across opt-out treatments. Looking first at the last column of Table. we can see that the second treatment returned nearly double the proportion of opt-out responses compared to the first treatment (.1ῌ compared to ,1ῌ respectively).-2
Further, looking at Table / we can see that the pro-portion of respondents that chose the opt-out alterna-tive ineach of the eight choice set questions is more than three times higher in TB than in TA (,-ῌ and 0ῌ respectively).-3 Such a pattern across treatments
Table,. Socio-economic characteristics across treatments
No purchase
treatment Own brandtreatment census data,**+ UK barometer
Euro-Sex ῎ Non-response (ῌ) Female Male ,4,. .+4*- /041-,4,, -14*. 0*41. ῎ /+ .3 Age ῎ Non-response (ῌ) +2ῌ,. ,/ῌ-. -/ῌ.. ./ῌ/. //ῌ0. 0/ῌ1. 1/ῌ2. 2/ῌ3. 3/῍ +40* -4,+ 14*/ ,.4-0 +04-/ +34// +-412 ++4,, ,4,. *40. +4.2 /4+3 +*4** +340-+04-* ,+4++ +14*. 14*. +42/ *4-1 ῎ +/4--+1412 +2400 +04/. +-4,-+*4/* 0432 +40* *413 Household members ῎ Mean St. Deviation ,4/-+4.+ ,4/2+4.2 ,4/*῎ Number of children ῎ Mean St. Deviation *40+ +4+0 *4/2*43, ῎ Education ῎ Non-response (ῌ)
Primary school (up to+* years) Secondary school (up to+0 years) Upper secondary school (up to+2 years) Professional qualification University degree /4./ +43, ,342+ +.4+* ,34.3 +34,-,430 -4--,24/, +0401 ,0401 ,+42/ ῎ +4,--04,* ,1423 +34,/
+/4.-Household income (in῏) ῎
Mean St. Deviation Median Non-response (ῌ) -*00 --1-,*** 14,0 ,020 ,3+, +1/* 24.2 ,-1, 3.. +/2. ῎
Attitudes towards GM foodsa ῎ ῎
How willing would your household be to buy
GM foods? -4/+ -40+ ῎ ῎
If they were cheaper than Non-GM foods -4,, -4,- ῎ If they were sold at the same price as regular
foods but were much more nutritious or contained more vitamins
,432 -4*0 ῎ ῎
If they were sold at the same price as regular foods but were produced with less pesticides and artificial fertilizers
-4+. -4,- ῎ ῎
If they were sold at the same price as regular
foods but tasted better -4/+ -40* ῎ ῎ Of all the risks we have to face at the moment,
that of food safety is rather insignificant -4/1 -4-3 ῎ -4/* If a majority of people were in favour of GM
food, it should be permitted -4.. -4/* ῎ -4.* Even if GM food has advantages, it is basically
against nature -4-- -4,/ ῎ ,4/*
Whatever the risks involved in GM food, we
can avoid them if we really want to -4++ -4** ῎ -4** If something went wrong with GM food, it
would be a global disaster -4,2 -4,+ ῎ ,42* Notes:aAnswered on a+ῌ/ Likert scale. Average values reported.
Table-. Comparison of revealed egg consumption data obtained from sample with UK egg consumption figures
No purchase
treatment Own brandtreatment UK data
a
Box size usually purchased (ῌ) Box of 0 Box of+* Box of+, Box of+/ Box of+2 Box of,. /04*3 /4+-,+4+/ /4+- -4/-/4+, /.4.. 14.+ +340-14*. -41* -41+ ῍ ῍ ῍ ῍ ῍ ῍ Type of eggs usually purchased (ῌ)
Battery cage Free range Organic /,4+3 ,141/ ,*4++ /24*-,-43* +24+/ 1, ,-/ Egg size usually consumed (ῌ)
Small Medium Large Very large -4*, .*40* .34--14*/ ,41--34./ /-4/, .4-* ῍ ῍ ῍ ῍ Number of eggs consumption
(weekly per household) Mean St. Deviation Median 14+-.402 04** 14/* /4/. 04** 14+/ ῍ ῍ Price (box of0 medium eggs in Pence)
Battery cage eggs Free rang Organic ./ 13 +,3 ., 10 ++3 -3 2. +,/ Eggs usually purchased at (ῌ):
Major supermarket chains Other
(farmers, butcher, milkmen etc.)
0241/
-+4,/ 1-422,04+, 1.42*,/4,* Note:a
Sources: DEFRA and TNS from British Egg Information Service at http://www.britegg.co.uk/ (access at++. +*. ,**,).
Table.. Choice shares and response patterns across treatments
(Unit:ῌ)
Responses to eight choice set question Responses for
no purchase treatment Q+ Q, Q- Q. Q/ Q0 Q1 Q2 TOTAL Non-response
Option A Option B Option C
Option D (No purchase) 241/ 34,3 -+41---4/0 +0401 /4-1 ,.4-0 +04*--.403 +34// 3402 +0433 +,4/* --4/3 ,14,. +0401 24--24*+ ,342+ -14+2 +0432 343. ++4/. ,24,+ --4-- +140- 24--+/4*0 ,24/--*4./ +14,/ +,4+2 +*43* ,0432 -,403 +.4*, 14-1 +-4+. -,412 -,403 +-4/2 +,4+* +.420 -,402 ,0412 +** +** +** +** +** +** +** +** +** Responses for
own brand treatment Q+ Q, Q- Q. Q/ Q0 Q1 Q2 TOTAL Non-response
Option A Option B Option C
Option D(Own brand) ++4+2 14*. ,24/, +04/3 -0401 +04+/ +/40-+-41* +14++ -14.+ ++4-, +.4.. +*4,- +04,-.1412 +-4-. /4/0 .42+ ,+42/ /.4.. +14*. 04-* 04-* +34,/ /+4++ +*4/2 24+/ +240- +/4,-.14.+ +,431 +*4,0 +*41-+14,0 .2403 +/4/+ 14+, 24+,/ +34/3 .3432 +,4./ +*4*3 +,4/0 +14.3 .14.+ +** +** +** +** +** +** +** +** +**
results provide initial indication that the ‘no-purchase’ format may have been perceived as a forced choice and thus may have induced respondents to choose one of the other hypothetical alternatives A, B, or C. Hence, it appears that there is support for the first proposition stated in Section..
We now turn to examine whether the use of alternative opt-out formats induces a systematic fa-vouring of some options at the expense of others. That is, we examine from which options does the opt-out alternative in TB draw its relatively high share and to what other option(s) does the opt-out alternative in TA loose its relatively low share. An implicit assump-tion made in most applied choice experiment work is that alternative opt-out formats will draw pro-portionately from all options. Yet, if this is not the case (and some alternatives are systematically fa-voured over others when a particular opt-out format is used), it is vital to understand why this may be so as well as the direction of the bias. Going back to the last column of Table. we see there is a ,+ῌ di#er-ence across treatments in the share of the Opt-out alternative ( ‘No purchase’, ‘Own Brand’). We see, however, that the respondents in TA have allocated +/ῌ of this percentage di#erence to option C (the fixed alternative option) and merely the remaining0 ῌ proportionately to the (variable) options A and B. Moreover, Table/ shows that the proportion of indi-viduals that chose option C ineach of the eight CE questions was substantially higher in TA compared to TB (+/ῌ Vs 2ῌ respectively). There is, thus clear evidence that there is a systematic gravitation to-wards the fixed choice alternative when individual’s are provided with the ‘no-purchase’ option compared to those o#ered the ‘own-brand’ opt out alternative.
The experimental psychology literature briefly reviewed in Section , provides some insights as to why this may be the case. As explained, when indi-viduals perceive the choice setting as involving a forced choice, they tend to adopt simplifying heuris-tics (e.g. compromising behaviour) that aim at min-imizing adverse and unpleasant psychological e#ects such as ‘regret’. The results from this particular decision making processes is that options that are perceived as being ‘generic’, or high-price high quali-ty or asymmetrically dominating in one dimension are systematically favoured at the expense of other alternatives. In the current study we used three types of fixed alternatives: a generic brand of free range eggs, a generic brand of battery cage eggs, and a high quality and price brand. The aim of using three dif-ferent fixed choice alternatives was to be able to ex-amine the extent the findings from the psychology lit-erature mentioned above are relevant for the compar-ison between opt-out alternatives. Table 0 presents the choice shares across treatments broken down with respect to the type of fixed alternative included in the choice set. Starting with the first column we see that the high price high quality option draws the highest share in both treatments (compared to the other fixed alternatives). Though this share is consid-erably higher in TA than TB (./ῌ Vs ,3ῌ), we see that the choice share of C in TB is significantly higher than the corresponding share in the overall sample (+1ῌ). This signifies that the e#ect of introducing a high price/high quality alternative may provide re-spondents with an attractive outlet for both treat-ments. Further it is clear that the high share of C mainly draws from option D (i.e. the opt-out alterna-tive) in both treatments. Yet, this e#ect is
consider-Table /. Response patterns in each of the eight choice questions
(Unit:ῌ)
No purchase
treatment Own brandtreatment Individual responded with A’s in all eight CE questions
Individual responded with B’s in all eight CE questions Individual responded with C’s in all eight CE questions Individual responded with D’s in all eight CE questions Individual responded with all non-responses (blanks)
*4** *40. +.412 04.+ 04.+ *4** *4** 24+/ ,,4/3 0401 Note: Excluding those with all A’s, B’s, C’s.
ably smaller in TB than in TA suggesting that the psychological inducements that are responsible for this bias are weaker in the second treatment.
Moving on to columns two and three in Table0 we can examine the e#ect of introducing a generic fixed brand alternative. Interestingly, we see that the patterns of systematic bias in favour of the fixed alternative are only present when this contains the ‘free range’ characteristic. That is, when the fixed alternative is generic but includes the battery cage characteristic, the share of the opt-out alternative in TA drops by ,- percentage points compared to the total sample figure (-+ῌ Vs +*ῌ). Similar patterns are witnessed in TB. The ‘loss’ in the share of C is spread mainly to option A and to no-response. When the generic fixed alternative, however, includes the free-range characteristic the overall pattern of sys-tematic preference for option C in TA remerges (i.e. the choice shares when C contains the free range characteristics are equivalent to those observed in the entire sample). It appears, therefore, that individuals faced with a forced choice (i.e. under TA) tend to anchor on the ‘free range’ characteristic. This is compatible with the finding from experimental psy-chology literature that asymmetrically dominating alternatives are chosen when the individuals are un-certain about their preferences and are forced to
choose. Such a bias does not appear to be present in the ‘own-brand’ treatment..+ We can, thus, conclude that the second proposition of Section . cannot be rejected.
Lastly, the patterns in the percentages of opt-out responses as we move from the first to the eighth choice set question suggests that respondent fatigue is present in both treatments.., However, we can see that the presence of fatigue e#ects (defined as an increasing share of the opt-out alternative as individ-uals answer repeated chose set questions) is consider-ably weaker in the TB compared to TA. The percent-age of D responses in TA for the first two CE questions is on average +2ῌ while that for the re-maining six CE questions is -,ῌ (a 11ῌ increase). Conversely, the percentage of D responses in TB for the first two CE questions is on average -1ῌ while that for the remaining six CE questions is.3ῌ (a -, ῌ increase). This confirms the third proposition of Section . that respondent fatigue may di#er across samples presented with alternative opt-out formats. Moreover, the results suggest that respondents in the ‘own brand’ treatment exhibit higher response consis-tency and respondent endurance than those faced with the no-choice option. This may be due to the more realistic and less restrictive choice setting pro-vided by the ‘own brand’ option.
Table 0. Choice shares across version with di#erent specification for the fixed alternative C
(Unit:ῌ)
Responses for no
purchase treatment C is high quality/pricebrand C is genericbrand C is generic brand andcontains “Free range” C is generic brand andcontains “Cage” Non-response
Option A Option B Option C
Option D (No purchase)
+-412 240/ +1433 ./4+0 +.4., +14-/ +*42, 14.0 -.423 ,34.2 +.4-1 +*41-,,4.+ -+4,-,+4,0 ,*42-,,41. +/4+* 34// -+411 +** +** +** +**
Responses for own
brand treatment C is high quality/pricebrand C is genericbrand C is generic brand andcontains “Free range” C is generic brand andcontains “Cage” Non-response
Option A Option B Option C
Option D (Own brand)
+,4+. 04,/ +/4.1 ,34,--043+ +.4/1 +*4./ 14,+ +24/. .34,-+-41/ 34/* +14,/ ,-4,/ -04,/ +/4/, +243/ +,4-* 2401 ..4/0 +** +** +** +**
+*. Estimation of multinomial models
We now turn to examining the last two proposi-tions stated in Section. on the e#ects of using alter-native opt-out formats on the estimated parameters of the multinomial choice model derived from the CE data. The first subsection below presents the estima-tion procedure that was followed while the second discusses the obtained results.
+*. + Estimation procedure
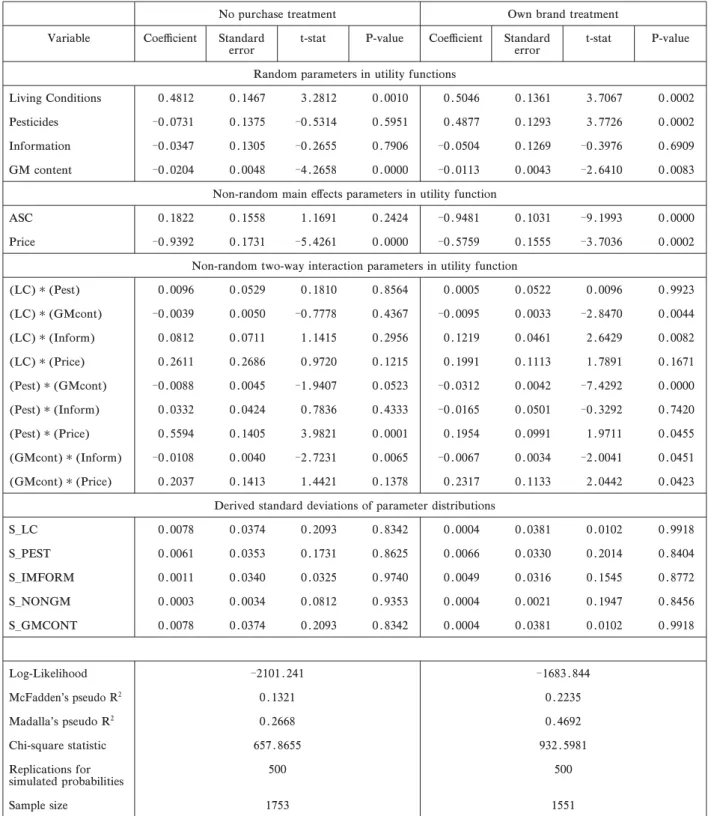
Two separate multinomial models were esti-mated for each treatment group. In order to avoid the danger of the IIA violations cuased by the introduc-tion of the opt-out alternative a random parameter logit model was employed (Revelt and Train, +332)..- The random utility function with random
parameters is give by: Un
jῐVj῏enjῒXj῍b῏hn῎῏enj ῌ
Where individualn (nῐ+...N) obtains utility U from choosing alternativej (jῐA, B, C or D) in each of the eight choice occasions. The utility is decom-posed into a non-random component (V) and a stochastic term (e). In its most simplest form the non-random component is assumed to be a function of the choice attributes X with parameters b which due to preference heterogeneity may vary across respondents in accordance to some random component h. By specifying the distributions of e and b (or h) the probability of choosing the option j in each of the eight choice occasions can be derived (Revelt and Train, +332). The estimation procedure was programmed in LIMDEP. The programme code is
available from the authors. In order to identify the parameters the scale parameter,mn, was normalised to equal one. Moreover, theb random parameters were assumed to be independently normally distributed and distribution simulations to derive the moments of the distribution were based on/** draws.
A simple specification was used that models the probability of selecting a particular alternative as a function of choice-specific attributes (which may be random) and a non-random alternative specific con-stant (ASC). Since the choice experiment involves ‘no name brand’ options the ASC is not choice spe-cific but equals ‘+’ when either A, B, or C are chosen and ‘*’ when D (i.e. the opt-out alternative) is selec-ted. This constant would account for the proportion of choices A, B, or C relative to D not otherwise explained by the data. Also note that a relatively more negative and significant ASC across treatments would indicate a higher propensity to choose the opt-out option in that treatment.
Turning to the issue of coding the data, the attributes that had two levels entered the utility func-tion as binary variables but were e#ects coded, that is: ‘Living conditions’ (free rangeῐ+, cageῐῌ+), ‘Use of agricultural chemicals and fertilizers’ (non useῐ+, useῐῌ+), and ‘Certification’ (yesῐ+, noῐῌ+)... The levels used for the ‘price’ and ‘GM content’ attributes were entered in a cardinal-linear form. The price attribute took the values (in pence) -2, 02, 32, +,2, and +-0 while the GM attribute the values (in per-centages) *, +, /, and -* (see Table 1)../ Further, whilst the attributes for the opt-out option in TA were simply coded with zero values, the attributes for opt-out option in TB were coded with the actual product characteristics specified by each individual in there responses to the revealed preference questions..0
Table 1. Description of attributes and levels
Living Conditions Living condition of hens: free range (+) Vs cage (ῌ+) Pesticides Use of pesticides in chicken feed: no use (+) Vs use (ῌ+)
Information Quality information/Certification on box: included (+) Vs not included (ῌ+) GM content GM content in chicken feed: *ῌ, /ῌ, +ῌ, and -*ῌ
Price Price of box of six medium eggs: ῑ*.-2, ῑ*.02, ῑ*.32, and ῑ+.,2
ASC Alternative specific constant such that ASCῐ+ if individual chose A, B, or C and ASCῐ* if individual chose D