Discovery of Dying Active Galactic Nucleus in
Arp 187: Experience of Drastic Luminosity
Decline within 104 yr
著者
Kohei Ichikawa, Junko Ueda, Hyun-Jin Bae,
Taiki Kawamuro, Kenta Matsuoka, Yoshiki Toba,
Megumi Shidatsu
journal or
publication title
The Astrophysical Journal
volume
870
number
65
page range
1-12
year
2019-01-09
URL
http://hdl.handle.net/10097/00126935
doi: 10.3847/1538-4357/aaf233Discovery of Dying Active Galactic Nucleus in Arp 187: Experience of Drastic
Luminosity Decline within 10
4yr
Kohei Ichikawa1,2,3 , Junko Ueda4,5, Hyun-Jin Bae6 , Taiki Kawamuro4,13 , Kenta Matsuoka7,8,9,13 , Yoshiki Toba9,10,11,13 , and Megumi Shidatsu12
1
Frontier Research Institute for Interdisciplinary Sciences, Tohoku University, Sendai 980-8578, Japan;[email protected]
2
Department of Astronomy, Columbia University, 550 West 120th Street, New York, NY 10027, USA
3
Department of Physics and Astronomy, University of Texas at San Antonio, One UTSA Circle, San Antonio, TX 78249, USA
4
National Astronomical Observatory of Japan, 2-21-1 Osawa, Mitaka, Tokyo 181-8588, Japan
5
Harvard-Smithsonian Center for Astrophysics, 60 Garden Street, Cambridge, MA 02138, USA
6
Department of Medicine, University of Ulsan College of Medicine, Seoul 05505, Republic Of Korea
7
Dipartimento di Fisica e Astronomia, Universitá degli Studi di Firenze, Via G. Sansone 1, I-50019 Sesto Fiorentino, Italy
8
INAF—Osservatorio Astrofisico di Arcetri, Largo Enrico Fermi 5, I-50125 Firenze, Italy
9
Research Center for Space and Cosmic Evolution, Ehime University, 2-5 Bunkyo-cho, Matsuyama, Ehime 790-8577, Japan
10
Academia Sinica Institute of Astronomy & Astrophysics(ASIAA), 11F of Astronomy-Mathematics Building, AS/NTU, No.1, Section 4, Roosevelt Road, Taipei 10617, Taiwan
11
Department of Astronomy, Kyoto University, Kitashirakawa-Oiwake-cho, Sakyo-ku, Kyoto 606-8502, Japan
12
Department of Physics, Faculty of Science, Ehime University, Matsuyama 790-8577, Japan Received 2018 August 15; revised 2018 November 2; accepted 2018 November 18; published 2019 January 9
Abstract
Arp187 is one of the fading active galactic nuclei (AGNs), whose AGN activity is currently decreasing in luminosity. We investigate the observational signatures of AGN in Arp187, which trace various physical scales from less than 0.1pc to the nearly 10kpc, to estimate the long-term luminosity change over 104yr. The Very Large Array 5GHz and 8GHz images and the ALMA 133GHz images reveal bimodal jet lobes with ∼5kpc size and the absence of the central radio core. The 6dF optical spectrum shows that Arp187 hosts a narrow line region with the estimated size of ∼1kpc, and the line strengths give the AGN luminosity of Lbol=1.5×1046ergs−1. On the other hand, the current
AGN activity estimated from the AGN torus emission gives the upper bound of Lbol<2.2×1043ergs−1. The absence
of the radio core gives the more strict upper bound of the current AGN luminosity of Lbol<8.0×1040 ergs−1,
suggesting that the central engine is already quenched. These multiwavelength signatures indicate that Arp187 hosts a “dying” AGN: the central engine is already dead, but the large-scale AGN indicators are still observable as the remnant of the past AGN activity. The central engine has experienced the drastic luminosity decline by a factor of∼103–5fainter within∼104yr, which is roughly consistent with the viscous timescale of the inner part of the accretion disk within ∼500yr.
Key words: galaxies: active– galaxies: nuclei
1. Introduction
One of the key questions in modern astronomy is how supermassive black holes (SMBHs) and their host galaxies coevolve(e.g., Alexander & Hickox2012), leading to the tight
correlation between the masses of SMBHs and their bulges in the present universe (e.g., Kormendy & Ho 2013). Active
galactic nuclei (AGNs) are the best laboratories to understand this coevolution process, because they are in the stage where the mass accretion onto SMBHs occurs, releasing large amounts of gravitational energy as radiation (e.g., Soltan 1982; Yu & Tremaine 2002), until the SMBHs reach their achievable
maximum mass limit of MBH;1010.5Me (Netzer 2003;
McLure & Dunlop2004; McConnell et al.2011; Kormendy & Ho 2013; Trakhtenbrot2014; Jun et al.2015; Wu et al. 2015; Inayoshi & Haiman 2016; Ichikawa & Inayoshi2017).
One of the biggest unknowns for this accretion process is how long such an AGN phase can last. Several authors indicate that the total AGN phase has a duration of 107–9 yr(Marconi et al.2004) and that one cycle of AGN should be at least over
105yr, as suggested from the observations (Schawinski et al.
2015) and simulations (e.g., Novak et al. 2011). This is also
consistent with the results that there are various AGN
indicators with different physical scales and that each AGN indicator has tight luminosity correlations with each other: AGN nucleus (X-ray) and the 10pc scale AGN dusty torus (mid-infrared, hereafter MIR; Gandhi et al. 2009; Ichikawa et al. 2012; Asmus et al.2015; Mateos et al. 2015; Ichikawa et al. 2017) and 1kpc scale ionized gas region (so-called
narrow line region or NLR; e.g., Netzer et al. 2006; Panessa et al.2006; Berney et al. 2015; Ueda et al. 2015). This long
lifetime of AGNs, however, makes it difficult for us to observe the scene where an AGN is now being quenched, or“dying,” which gives us the information on how rapidly the physics of accretion disk in an AGN is changing within the certain amount of time.
Recent observations, however, have discovered a key population of AGNs to resolve the issue above. Although they show the AGN signatures at large physical scale with 1 kpc (e.g., NLR and/or radio jets), they lack the signatures at small physical scale with<10 pc (e.g., X-ray emission, the dust torus emission, and/or the radio core emission) or their luminosities are very faint even if they exist. They are thought to be in the transient stage where their central engine has been already fading, but the large-scale AGN indicators are still active because of the long light-crossing time (e.g., >103yr). They are called fading AGNs, and ∼20 such sources have been
© 2019. The American Astronomical Society. All rights reserved.
13
reported (Schawinski et al.2010; Schirmer et al. 2013,2016; Schweizer et al. 2013; Ichikawa et al. 2016; Kawamuro et al.
2017; Keel et al.2017; Sartori et al.2018a; Villar-Martín et al.
2018; Wylezalek et al.2018).
Among them, Arp187 located at z=0.040 (DL=178Mpc,
1″=798pc) is one of the most promising dying AGN candidates. Dying is the final phase of a fading AGN whose current central engine is already quenched but whose large-scale AGN indicators are still alive because of the photon time delay. Ichikawa et al. (2016) used a jet lobe size discovered by the
Atacama Large Millimeter/submillimeter Array (ALMA) cycle-0 observation(Ueda et al.2014) for estimating the upper limit of the
quenching time of the fading AGN. Assuming a jet angle to the line of sight of 90°and a typical expansion, the kinematic age of the radio jets is estimated to be 8×10⁴yr. Ichikawa et al.(2016)
also revealed that AGN nucleus activity is already quenched with the bolometric luminosity of Lbol<1041 ergs−1. However,
Ichikawa et al. (2016) could not estimate the past AGN
luminosity, and we, therefore, could not evaluate how rapidly this AGN has experienced the luminosity decline.
In this paper, we report the more multiwavelength support that Arp187 hosts a bona fide dying AGN and that the central engine has experienced drastic luminosity decline over 103–5 times within 104yr, using the multiwavelength data including the newly obtained radio data with ALMA, the Karl G. Jansky Very Large Array(VLA), Spitzer, andNEOWISEas well as the updated analysis method to the archival 6dF optical spectrum, which has not been explored in our previous paper (Ichikawa et al. 2016). Throughout the paper, we adopt H0=70.0
kms−1Mpc−1,ΩM=0.3, and ΩΛ=0.7.
2. Analysis and Results
2.1. Radio Continuum Emission: Existence of Radio Jet Lobe The Band4 continuum observation of Arp187 was performed using the ALMA 12 m array on 2016 July 25 (Cycle 3; ID=2015.1.01005.S). We used four SPectral Windows (SPWs) with Time Domain Mode. The center frequency of the four SPWs is 133GHz, and the total bandwidth is 8GHz. The number of 12 m antennas was 36. The baseline lengths range from 15m to 1124m. Data calibration and imaging were performed using the Common Astronomy Software Applications package(CASA, ver. 4.5.3). We used the delivered calibrated uv data and made the continuum map by clipping the visibility (uv distance 10kλ). The synthesized beam size is 0 46×0 39 (position angle (PA)=−82°.7) by adopting Briggs weighting of the visibility (robust=0.5), and the rms noise level is 0.013mJybeam−1. We
regard the accuracy of the absolute flux calibration as 5% throughout this article according to the ALMA Cycle3 Technical Handbook.14
In addition, we used archival calibrated uv data obtained with VLA C- and X-bands, and made the continuum maps using CASA. We clipped the visibilities before imaging so that all the VLA and ALMA data have the same shortest UV range. The synthesized beam size of the 4.86GHz map is 0 43× 0 34 (PA=−4°.9) by adopting uniform weighting of the visibility, and the rms noise level is 0.28mJy beam−1. The synthesized beam size of the 8.44GHz map is 0 36×0 22
(PA=34°.1) by adopting Briggs weighting of the visibility (robust=0.5), and the rms noise level is 0.20mJybeam−1.
The radio continuum maps are shown in Figure 1. They clearly show the structure of the jet lobes, which are located at both sides of the nucleus. The projected distance between the lobe cores is ∼5kpc. We estimate the kinematic age of the lobes, assuming the jet angle to the line of sight of 90°and a typical expansion speed of radio lobes(0.1c; e.g., Murgia et al.
1999; Nagai et al. 2006). This gives the kinematic age of
∼8×10⁴yr.
We also confirm no additional radio lobes in the field of view (FOV) of the VLA and ALMA observations. The FOV of the VLA observation at 4.86GHz is 9.3arcmin, which is the largest among the three observations. This corresponds to the physical size of 221kpc in radius. If there are radio lobes outside the FOV, the lower limit of their kinematic age is 6.6×10⁶ yr. Thus, Arp187 has not launched the jet over 6.6×10⁶yr before the current 5kpc size one, or the larger radio lobes, if any, already become undetectable because of rapid energy loss(e.g., Godfrey et al. 2017).
We also convolved these maps to 0 47 angular resolution to make spectral energy distributions(SEDs) of the jet lobes. The peak and totalflux densities of the eastern and western lobes are summarized in Table1. Each peakflux density is measured at the emission peak at 4.86GHz, using the beam-matched maps. The radio SEDs of the lobes are shown in Figure2. The spectral indexα was estimated from two points at 4.86GHz and 8.44GHz by using a fitting function of fν∝να. The SED shows a steep spectral index ofα≈−0.84 for the eastern lobe (the red dashed line), and the flux point at 133GHz is nearly on the extrapolated line from the VLA bands. This is consistent with optically thin synchrotron radiation that is expected for the jet emission. On the other hand, theflux density of the western lobes at 113GHz is smaller than what is expected from the flux densities at 4.86GHz and 8.44GHz, assuming that the SED can befitted by fν∝να(the black dashed line). This suggests the spectral aging for the western jet(e.g., Jamrozy et al.2008; Saikia & Jamrozy 2009), but the exact age cannot be
determined on the basis of the current SED sampling. There is no clear emission in the nucleus (jet core) at 4.86GHz and 8.44GHz, although the faint emission is seen at 133GHz. This is not due to the dynamical range limit of VLA. The 3σ upper limits of the flux densities measured in the non-beam-matched images are 0.84mJy at 4.86GHz and 0.60mJy at 8.44GHz. Assuming the spectral index of the jet core of α=−0.5, the 133GHz flux density is expected to be 0.16mJy according to the upper limit of the 8.44GHz flux density. However, the observed 133GHz flux density is 0.052 mJy, which is three times lower than that extrapolated from the 8.44GHz flux density. The non-detection of the continuum emission at 4.86GHz and 8.44GHz cannot be explained by free–free absorption, which causes the flux excess at high frequency. Thus, the non-detection at several GHz and strong constraint on the 133GHz flux density lead to the conclusion of the presence of a significantly faint core in Arp187.
2.2. 6dF Optical Spectra
We perform the spectral measurements to investigate the properties of the NLR. We first obtained the archival optical spectrum of Arp187 from the 6dF galaxy survey (Jones et al.
2009). The spectrum covers a range from 3900 Åto
14A. Remijan et al., 2015, ALMA Cycle 3 Technical Handbook Version
7500Åwith a fiber aperture of 6.7arcsec (equivalent to 5.3 kpc). Because the 6dF spectra are not flux calibrated on a nightly basis, we have normalized the spectrum according to the 6dF optical photometry at the R band of R=14.33 mag.
Figure3 shows the optical spectrum of Arp187 in the left panel(solid black line). The observed spectrum does not show
any features of the big blue bump originating from the AGN accretion disk or the broad emission lines (e.g., Malkan & Sargent 1982; Vanden Berk et al. 2001). Thus, we conclude
that Arp187 is at least not a type-1 AGN.
We then perform the spectralfitting to obtain the properties of the NLR. For the spectralfitting, we follow the routine in Bae et al.(2017) and later Toba et al. (2017), where they have
performed the spectral fitting to the SDSS spectra. We first subtract the stellar continuum from the spectrum using a best-fit stellar template based on the wide range of the stellar population models (MILES; Sánchez-Blázquez et al. 2006)
with solar metallicity and the age spanning from 60Mys to 12.6Gyr. To obtain the qualified stellar continuum, we mask the strong emission lines of Hβ, [OI], [NII], Hα, and [SII]
with the masking width of 1300kms−1, which corresponds to FWHM∼1000 kms−1. We also mask the [OIII]
doublet with the masking width of 3000kms−1 to avoid the possible contamination from the strong outflow originated from the [OIII] emission lines. In addition, because some
of the telluric absorptions are not well removed, we also masked those wavelength bands from the stellar spectral fitting.
From the starlight-subtracted spectrum as shown in gray line at the zeroflux level in Figure 3, we then fit the Hα, Hβ, [NII]-doublet, [OI]λ6300 using a single Gaussian function and
[OIII] doublet ([OIII]λ4959, 5007) with double-Gaussian
func-tion using the IDL/MPFIT code, which is a χ2-minimization routine(Markwardt2009). We assume that the [OIII] doublet and
the other narrow lines have independent kinematics, whereas the [OIII] doublet has the same velocity and velocity dispersion as
each other. The observed spectrum (black line) and the fitting results are compiled for the entire spectral range (Figure3, left panel) and for each line (Figure3, right panel).
2.2.1. Existence of NLR
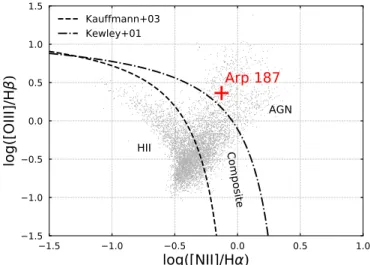
Wefirst apply the emission-line diagnostics, which give a separation between the NLR ionized by AGN and the HII
region in the starburst galaxies(Veilleux & Osterbrock 1987; Kewley et al.2006). Figure4shows that Arp187 is classified Figure 1.Radio continuum maps of Arp187 at VLA 4.86GHz (left), VLA 8.44GHz (middle), and ALMA 133GHz (right). The ellipse in the bottom-left corner shows the beam size measured in each map. The center of each panel corresponds to the peak in the K-band image(Rothberg & Joseph2004). The length of each
panel is 10″, which corresponds to ∼8kpc. The scale in the left panel shows the separation of the two lobe cores (∼5 kpc). The contour levels are 0.28mJybeam−1×(5, 6, 9, 12, 15, 18, 21, 24, 27, 30) for the 4.86GHz map, 0.20mJybeam−1×(3, 4, 5, 7, 9, 11, 13, 15, 20) for the 8.44GHz map, and 0.013mJybeam−1×(3, 6, 9, 15, 21, 27, 33, 39, 45, 51) for the 133GHz map.
Table 1
Flux Density of the Jet Lobes
Frequency Eastern Lobe Western Lobe
Peak Total Peak Total
4.86GHz 12.0 190 13.2 160
8.44GHz 7.53 92 9.54 100
133GHz 0.662 5.3 0.704 7.2
Note.The unit of theflux density is mJy. These values are measured in the beam-matched images(θ=0 47).
Figure 2.SEDs of the jet lobes. The spectral indexes estimated from two points at 4.86GHz and 8.44GHz arelogfn =9.2 0.84 log n– for the eastern lobe (red) andlogfn =6.8 0.59 log n– for the western lobe(black). The errors of the flux densities are smaller than the size of symbols.
as an AGN. Thus, it shows that Arp187 hosts the NLR, one of the large-scale AGN indicators.
Because the diagnostic shows that [OIII]λ5007 (hereafter,
[OIII]) emission is dominated from the NLR, we then measure
the[OIII] luminosity (L[OIII]), and [OI]λ6300 (hereafter, [OI]) luminosity (L[OI]) to estimate the AGN bolometric luminosity because L[OIII] alone (e.g., Heckman et al. 2004, 2005; LaMassa et al.2013; Ueda et al.2015) or the combination of
L[OIII]and L[OI](e.g., Netzer2009) is often used as a proxy for AGN power. The observed [OIII] and [OI] luminosities are L[OIII]=6.2´1040 ergs−1 and L[OI]=3.8´1040 ergs−1. We also calculate an extinction-corrected, intrinsic luminosity of[OIII] (L[OintIII]) and [OI] (L[intOI]) luminosities from the Balmer
decrement of Hα/Hβ (e.g,. Calzetti et al. 1994; Domínguez et al. 2013). The values are LO 3.2 10
int 42 III = ´ [ ] ergs−1and LO 2.0 10 int 42 I = ´
[ ] ergs−1. We calculate the AGN bolometric luminosity Lbolusing the both lines(Netzer2009; Matsuoka & Woo2015) by
L L L
log bol 3.8 0.25 log O 0.75 . 1
int
O int
III I
= + [ ] + [ ] ( )
The estimated value is log(Lbol erg s-1)=46.2, which reaches to the typical luminosity of the SDSS quasars at z∼1–2 (e.g., Shen et al.2011).
2.2.2. NLR Size
The size of the NLR is also an important indicator to estimate the fading timescale of AGN for Arp187. Because the integralfield unit (IFU) observations are still not available, we estimate the NLR size from the empirical relationship between the[OIII] emission size and the [OIII] luminosity.
The [OIII] emission sizes have been measured from either
narrowband imaging(Bennert et al.2002; Schmitt et al.2003),
long-slit spectroscopy (Fraquelli et al. 2003; Bennert et al.
2006; Greene et al. 2011; Hainline et al. 2013), or the IFU
observations (Humphrey et al. 2010; Husemann et al. 2013;
Liu et al. 2013; Karouzos et al. 2016; Bae et al. 2017). The
narrowband imaging is more often used for studying the NLR morphology, whereas the long-slit spectroscopy and IFU have an advantage to reach shallower sensitivity limits.
We first estimate the NLR sizes (RNLR) using the size–
luminosity relations of Bae et al.(2017) obtained from the IFU
observations of nearby type-2 Seyferts and quasars. This relation has two advantages;(1) their study uses the extinction-uncorrected[OIII] luminosity for the size–luminosity relation
to reduce the uncertainty of the extinction correction to estimate the intrinsic[OIII] luminosity, and (2) they estimate
the NLR size on the basis of the line diagnostic diagrams discussed in Section2.2, which pick up the region where the [OIII] emission is dominated from AGN. The size–luminosity
Figure 3.Left: the optical spectrum of Arp187 (solid black line) obtained from 6dF galaxy survey. X-axis shows the rest-frame wavelength with the unit of Å. Y-axis shows theflux density with the unit of 10−15ergs−1cm−2Å−1. The best-fit stellar spectrum is also shown in the red solid line. The starlight-subtracted spectrum is shown in gray line at the zeroflux level. The emission line and the telluric masked region are shown in the orange and green, respectively. Right: the spectra and the best-fit models for the Balmer lines, the [OIII]-doublet (λ4959, λ5007), the [OI]λ6300, and the [NII]-doublet lines. (upper-left: Hβ, upper-right: [OIII]λ4959, λ5007
doublet, bottom-left:[OI]λ6300, bottom right: Hα and [NII]-doublet). The total model spectrum is shown as pink solid line. The single Gaussian line component is
shown with cyan solid line(for Hβ, Hα, and the [NII]-doublet), whereas the double-Gaussian line component is shown with two cyan lines (for the [OIII] doublet) as
discussed in Section2.2.
Figure 4.Classification of the galaxies into AGN, composite galaxies, and HII
regions using line diagnostics diagrams (Kewley et al. 2001, 2006). The
dotted–dashed/dashed line represents the relation of Kewley et al. (2001)/
Kauffmann et al.(2003), respectively. Arp187 is located in the locus of AGN
(red cross). Gray dots represent the data points of SDSS DR7 galaxies (Abazajian et al.2009).
relation of Bae et al. (2017) is given by R L log pc 0.41 log erg s 14.00. 2 NLR O 1 III = ´ - -⎛ ⎝ ⎜ ⎞⎠⎟ ⎛⎝⎜ [ ] ⎞⎠⎟ ( )
The estimated NLR size is RNLR;530 pc.
We also estimate the [OIII] emitting sizes (R[OIII]) using the size–luminosity relations from the literature. Note that the relation is based on the[OIII] emission size; therefore, the
estimated size should be the upper bound of the NLR size because the NLR should fulfill the certain emission-line ratios as shown in Figure3. We apply the relation according to the narrowband imaging observations of the quasar population (Schmitt et al.2003) by R L log pc 0.42 log erg s 14.72. 3 O intO 1 III = ´ III -⎛ ⎝ ⎜ ⎞ ⎠ ⎟ ⎛ ⎝ ⎜⎜ ⎞⎠⎟⎟ ( ) [ ] [ ]
This gives RNLR <R[OIII]1.4 kpc, which is ∼2.5 times larger than RNLR obtained above. This result is in good
agreement with the previous IFU studies(Karouzos et al.2016; Bae et al.2017), who reported that R[OIII] is on average a few times larger than RNLR. In this study, we assume RNLR=
530–1400pc as the possible NLR size range. 2.3. Spitzer/IRS Spectra
Because the detailed spectral analysis of Arp 187 obtained from the Spitzer/InfraRed Spectrograph (IRS) is compiled in Ichikawa et al. (2016), here we provide a brief summary of
thefindings. We have found that the thermal emission from the AGN is already weak in Arp187, with an upper bound of the 12μm luminosity of L12 mm <1.5´1042 ergs−1. This is equivalent to Lbol<2.2×1043 ergs−1 using the relation of
L12 mm and 14–195keV luminosities (Ichikawa et al.2017) and the bolometric correction of Lbol L14 195– =8.47 (Ricci et al.
2017b; Ichikawa et al.2019). The spectrum of Arp187 shows
a marginal detection of the [OIV]25.89μm line at S/N∼3,
which is also a widely used AGN indicator. The [OIV]
luminosity is obtained with L[OIV]=6.7´1040 ergs−1, which is equivalent to L2 10– =3.0´1043 ergs−1 according to the luminosity relations obtained by LaMassa et al. (2010).
Because the ionization potential of[OIV] is higher (Ep=54.9 eV) than other typical NLR indicators, including [OIII] line
(e.g., Rigby et al. 2009), the emission size is expected to be
smaller than that of [OIII] (Komossa et al.2008; Toba et al.
2017), which is 0.5–1.4kpc in this study. Thus, we take the
emission size of<1.4 kpc as a fiducial value. 2.4. WISE Colors
IR color–color selection is useful to identify AGN candidates using the feature of the MIR bump originated from the AGN torus. Figure5shows the location of Arp187 on the WISE color–color plane. It is known that increasing levels of AGN contribution to the MIR emission moves sources upward in the color–color plane with the color cut of W1 -W2>0.8(orange area; Stern et al.2012)
and also within the AGN wedge(blue area; Mateos et al.2012).
Thefigure clearly shows that Arp187 does not fulfill either of the criteria above, indicating either(1) Arp187 does not host AGN or (2) the AGN activity is quite weak even if it exists (on average L14 195– <1043ergs−1, as suggested by Ichikawa et al.2017).
2.5. WISE IR Time Variability
It is worthwhile to trace the IR luminosity drop from the AGN torus after the AGN quenching. Because Arp187 is bright enough to be detected in the single exposure with the WISE mission, we have collected both cryogenic(WISE All sky database) and postcryogenic multiepoch photometry (WISE 3 band and Post-Cryo database) from the ALLWISE (Wright
et al. 2010; Mainzer et al. 2011) covering the observation
between 2010 January and 2011 February (MJD−55000= 200–600), and the most recentNEOWISE(Mainzer et al.2014)
data release 2018 covering the observation between 2013 December 13 and 2017 December 13, UTC (MJD−55000= 1600–3100). WISE has a 90 minute orbit and conducts ≈12 observations of a source over a ≈1 day period, and a given location is observed every 6 months.
In this study, we used standard aperture magnitude(w1/2mag). We applied a cross-matching radius of 2 arcsec, according to the positional accuracy with the 2MASS catalog (see also Ichikawa et al.2012,2017). After this matching, 26 and 122 data points were
obtained from the ALLWISE and NEOWISE epoch, respectively. Then we select good quality single-epoch data points according to the good quality frame score(qual_frame>0 and qi_fact>0), locating them with enough distance from the South Atlantic Anomalies(saa_sep>0), and avoiding the possible contamina-tion from the moon(moon_masked=0). This reduces the sample into 24(ALLWISE) and 109 (NEOWISE), respectively. Finally, we
applied the aperture measurement quality flag (w1/2flg=0) in order to avoid the contamination in the aperture. The final data points are 10(W1) and 8 (W2) forALLWISE43(W1) and 21 (W2) for NEOWISE. All the data points fulfill the flux quality ph_qual=A, with a signal-to-noise ratio larger than 10.0. We also checked sources of contamination and/or biased flux due to proximity to an image artifact (e.g., diffraction spikes, scattered-light halos, and/or optical ghosts), using the contamination flag cc_flags. All the data points are cc_flags=0, that are unaffected by known artifacts.
Figure 6 shows the light curve of W1 (3.4 μm) and W2 (4.6 μm). The light curves in the W1 and W2 span a baseline of roughly 2800 days;7.7 yr. Each observation is shown in blue, and binned observations within 1 day are also shown in orange. Figure 5. WISEW1(3.4 μm)–W2 (4.6 μm) vs. W2 (4.6 μm)–W3 (12 μm) two color diagram in the unit of Vega magnitude. The gray cross represents the Swift/BAT AGN sample in the local universe. The orange and purple area represents the AGN region proposed by Stern et al.(2012) and Mateos et al.
As shown in Figure 6, no clear variability is detected in the
ALLWISE and NEOWISE epoch, and also between the two
epochs. Actually, the ALLWISE catalog provides a variability flag (var_flag) and its value is var_flag=0, suggesting that the significant variability between different exposures are not detected during the ALLWISE survey, which shows the consistent result.
2.6. Relationship between 12mm and [OIII] Luminosities
It is widely known that both 12μm and the [OIII]
luminosities are good proxies for AGN power, and it is a natural consequence that there is a luminosity correlations between 12μm and the [OIII] luminosities (e.g., Toba et al.
2014).
Figure7 shows the relationship between 12μm and [OIII]
λ5007 luminosities using the SDSS DR12 type-2 AGN sample with the cross-matching by the WISEW3 (12 μm) band. As expected, the two AGN indicators have a nice luminosity correlation. However, Arp187 does not follow the luminosity relation and is located at the right bottom in the plane, suggesting that Arp187 is in the locus of a dying AGN. Ichikawa & Tazaki (2017) estimated the typical cooling
timescale of the dusty torus once the AGN is suddenly quenched. The thermal MIR dust emission from AGN should decay times of 10–100yr, mainly depending on the time-lag caused by the light-travel time from the nucleus to the dust sublimation radius, whereas the L[OIII] remains the same luminosity for over >103 yr because of its larger physical size. Ichikawa & Tazaki (2017) also calculated how those
dying AGNs move in the luminosity–luminosity plane of the two AGN indicators, and showed that those dying AGNs should locate at the bottom right of the luminosity relation. The location of Arp187 in Figure7is consistent with the idea, and below the relationship of the line after 30yr of AGN quenching(the orange dashed line).
2.7. X-Ray Observations
Although the X-ray observations give us the current AGN activity without the concern of the obscuration up to
N
log H24 (e.g., Ricci et al. 2015, 2017a), we have not
found any previous X-ray observations for Arp187, and therefore only the upper bounds obtained from the available all sky X-ray surveys.
Arp187 is not in the catalog of Swift/BAT 105 month all sky survey with the limitingflux at the 14–195keV band of f14 195(lim–) = 8.0´10-12 erg s−1 cm−2(Oh et al. 2018). This gives a very shallow upper bound of L14 195– <2.8´1043 ergs−1, which is equivalent to Lbol<2.4´1044ergs−1under the assumption of Lbol L14 195– =8.47(Ricci et al.2017b).
The ROSAT All Sky Survey also shows non-detection at the energy range of 0.5–2.0keV ( flim=2.5´10-12erg s−1cm−2; Voges et al.1999). This also gives a shallow upper bound of
L0.5 2– <8.8´1042 ergs−1, which is equivalent to Lbol<2.8´1044 ergs−1 using L2 10– L0.5 2– =1.57 under the assumption of the photon indexΓ=1.8 (Ricci et al.2017a)
and Lbol L2 10– =20 (Ricci et al.2017b).
Figure 6.Infrared light curves of Arp187 in the W1 and W2 band. The single exposures with the error are shown in blue, and the median value in each epoch is shown in orange circle with the error bars showing the interpercentage range with 68% of the sample. The orange circles are shifted to 50 days after the real values for clarity. The dashed line with green shade is theflux obtained fromALLWISEwith the 1σ (dark green) and 2σ (light green) scatter, representing the average magnitude in theALLWISEepoch.
Figure 7.Correlation between the[OIII]λ5007 and 12μm luminosities. The
black solid line represents the regression line obtained from the bisectorfitting of the type-2 AGN sample from SDSS DR12 galaxies(gray dots). The dashed lines represent the time evolution of the AGN luminosity relation the[OIII]
λ5007 and 12μm after AGN quenching (Ichikawa & Tazaki2017); 10yr
(black), 20yr (dark-orange), and 30yr (orange). The location of Arp187 is shown with a red cross.
Other X-ray catalogs, such as the third XMM-Newton serendipitous source catalog (3XMM-DR7; Rosen et al.
2016) and the Chandra Source Catalog (CSC Release 2.0;
Evans et al.2010), do not contain the observations of Arp187.
2.8. Black Hole Fundamental Plane
The fundamental plane of the black hole gives a relationship among three physical quantities of L2 10– , core L5GHz, and the
black hole mass MBH (e.g., Merloni et al.2003; Falcke et al.
2004; Yuan & Narayan2014). Ichikawa et al. (2016) discussed
that once the upper bound of L5GHzis given, we can estimate
the upper bound of L2–10, because the black hole mass in Arp187 is estimated to be MBH=6.7´108Me. The upper bound of L5GHz3.7´1037 ergs−1 obtained by the VLA observation gives L2 10– 4.0´1039 ergs−1 using the relation of Yuan & Cui (2005). This is equivalent to
Lbol8.0×1040 ergs−1, indicating that the central engine
is already quenched.
3. Discussion
3.1. AGN Indicators and Scenarios of Current AGN Activity Our multiwavelength measurements of the AGN indicators show that we have successfully found the large-scale(>100 pc) AGN indicators but not the indicators for the small-scale ones with 10 pc. Table 2 summarizes the AGN indicators for Arp187.
There are two possible scenarios that can account for these seemingly contradictory results between the larger (>100 pc) and smaller(10 pc) scales. One is that the AGN activity still exists but the emission is highly obscured along the line of sight, while being unobscured toward the jet and/or the NLR direction(e.g., Sartori et al.2018a). The other is that the AGN
activity in Arp187 has already been quenched, whereas the NLRs still remain bright because of the light-travel time from the central engine. Thefirst scenario is unlikely for Arp187 for two reasons. One is the absence of the AGN torus emission in the Spitzer/IRS spectra, as well as the other torus indicators obtained from WISE. If the central engine is highly obscured, then most of the emission is absorbed by the dust, and then it re-emits and produces the bump in the MIR (e.g., Ichikawa et al. 2014), which we could not find. Another point is the
absence of the jet core, which is irrelevant to the concern of absorption and its existence is the ubiquitous trend for AGN (Blandford & Königl 1979; Hada et al. 2011), although there
are some rare exceptions (Cordey 1987; Dwarakanath & Kale 2009). Thus, our results prefer the scenario of a
dying AGN.
One might argue that the absence of the big blue bump and the broad emission-line region(BLR) is due to the absorption by the dusty torus(e.g., Antonucci1993; Nagar et al.2002). It
is true in general, but because the torus emission is already weak for Arp187, as discussed in Section 2.3, the most plausible explanation is that the central engine including the accretion disk and the BLR becomes already very faint or might be diminished.
The disappearing timescale of the BLR is poorly known at present. One possible implication of this comes from the observations of changing-look AGNs, which show the AGN type change in a human timescale(e.g., Tohline & Osterbrock
1976; Antonucci & Cohen1983; Alloin et al.1985; LaMassa et al.2015; MacLeod et al.2016; Ruan et al.2016; Yang et al.
2018). One of the findings of the ∼10yr long monitoring of
changing-look AGNs is that the BLR can disappear within a few years, whereas the physical mechanism of the disappear-ance is still under debate(Lawrence2018). Thus, in this paper
we compile the timescale of BLR as 1–10yr in Table2. Table 2
AGN Indicators and Their Estimated Luminosities Large-scale AGN Indicators(>100 pc)
Type of AGN Indicators AGN Sign log(LAGN erg s-1) log(Lbol erg s-1) loglEdd Size(radius) tretroa References
jet lobe ✓ L L L 2.5kpc 8.1×10⁴yr Section2.1
NLR([OIII]λ5007) ✓ logL[OintIII]=42.51 46.15 −0.77 0.5–1.4kpc (1.7–4.6)×103yr Section2.2 NLR([OIV]25.89 μm) ✓ logL[intOIV]=40.83 44.78 −2.15 1.4 kpc 4.6×10
3
yr Section2.3
Small-scale AGN Indicators( 10< pc)
Dust torus(Spitzer/IRS Spec) X logL12mm<42.18 <43.34a <−3.59 ;10 pc 10–100yr Section2.3
Dust torus(WISEIR colors) X L L L L 10–100yr Section2.4
Dust torus(WISEIR light curve) X L L L L 10–100yr Section2.5
Dust torus(L O([ III]) versus L12mm) X logL12mm<42.18 <43.34a <−3.59 ;10 pc >30 yr Section2.6
jet core X logL5GHz<37.57 L L 1 pc Current Section2.1
BLR(optical Spec) X L L L <0.1 pc Current(1–10 yr) Section2.2
Electron corona(X-ray) X logL2 10– <43.44 <44.38a <−2.55 =0.1 pc Current Section2.7 Other Relations
BH fundamental plane(FP) L logL2 10– <39.60 <40.90a <−6.03 L Current Section2.8 Note.The list of AGN indicators and the retrospective time(tretro) of the AGN indicator. Except for the jet lobe, the all time is the light-crossing time with the
definition of tlc=size c.
a
From the X-ray luminosities, we use the bolometric correction of Lbol L2 10– =20(Ricci et al.2017b). Then, under the assumption of the photon index ofG =1.8 (Ricci et al.2017a), we use the conversion among the X-ray luminosities of L2 10– L14 195– =0.42and L2 10– L0.5 2– =1.57. We also use the luminosity relations
between L12 mm and L14 195– oflog(L12 mm 1043erg s-1)= -0.21+1.05 log(L14 195– 1043erg s-1)to estimate the bolometric luminosity from L12 mm (Ichikawa et al.
2017). For the estimates of the Eddington luminosity ratio lEdd=Lbol LEdd, we apply the black hole mass of MBH=6.7´108 Me, which leads to
3.2. Luminosity Decline and Corresponding Timescales One of our goals is to constrain how rapidly the AGN has faded in Arp187. We summarize the long-term luminosity decline of Arp187 in Figure8. Thisfigure shows that the AGN has experienced the drastic luminosity decline by the factor of 103−5times within;104yr.
One question arises as to how to describe the sudden quenching of AGN within ;104yr and how this timescale is connected to the physical properties of the accretion disk of AGN. We here consider three possible timescales: the orbital, thermal, and the viscous(inflow) timescales, by following the discussions of Czerny (2006) and Stern et al. (2018). If the
accretionflow is roughly Keplerian, the dynamical timescale of the accretion disk is given by tdyn∼1/ΩK, whereΩK is the
Keplerian orbital angular frequency. The thermal timescale, which is corresponding to the disk cooling, is given by tth∼1/α ΩK, whereα is the viscosity parameter (Shakura &
Sunyaev1973; Kato et al.2008). The viscous timescale is also
given by tvis~(h R)-2tth, where h/R is the disk aspect ratio. The numerical simulations derive the estimation of α∼0.03 (Hirose et al. 2009; Davis et al. 2010); therefore, we use
α0.03=α/0.03 as the fiducial value. The disk aspect ratio is
typically very small, and we assume h/R∼0.05 by following Stern et al.(2018).
We first determine the boundary accretion disk radius R, within which it emits the UV radiation, where UV represents the wavelength of λ<3500 Å, and the typical wavelength range of the big blue bump (e.g., Malkan & Sargent 1982; Vanden Berk et al. 2001). Using the obtained parameter for
Arp187, the BH is estimated to be MBH=6.7×10⁸Meand
the maximum Eddington ratio in this study is λEdd=0.17
obtained from the NLR. The gravitational radius is given by
Rg=2GMBH c2~13 au. The AGN bolometric luminosity is governed by Lbol=hMc˙ 2, whereη is the radiation efficiency. The typical value is estimated as η∼0.1 (Soltan1982). The
mass accretion rate M˙ is therefore given by
M 2.8M yr 1 M . 4 0.1 1 BH,0 Edd,0.17 h l » - ˙ ( )
Here,h0.1=h 0.1, MBH,0=MBH 6.7´108M, andlEdd,0.17= 0.17
Edd
l .
Assuming a standard thin-disk AGN model, the disk radius R is linked to the disk temperature T in Equation of(3.57) of Kato et al.(2008) written by
R GMM
T 3
8ps 4, 5
= ˙ ( )
where σ is a is a Stefan–Boltzmann constant. Combining Equation(5) and (4) with Wien’s law ((l Å)=2.9´107 T), the typical radius R can be given by
R Rg 100 0.1 M , 6 1 3 BH,0 1 3 Edd,0.17 1 3 3500 4 3 h l l = - -( ) wherel3500=l 3500Å. Thus we apply R100=R 100Rgas a fiducial value for the UV-emitting disk size.
We can then parameterize the disk timescales as
tdyn~100 day´MBH,0 100R3 2, ( )7 tth 10 yr 0.03M R , 8 1 BH,0 1003 2 a ~ ´ - ( ) t 1.6 10 yr h R M R 0.05 . 9 vis 4 2 0.031 BH,0 1003 2 a ~ ´ ´⎜⎛ ⎟- -⎝ ⎞ ⎠ ( )
Because Arp187 has not shown the big blue bump and the torus emission(whose source of nutrition is the UV photons) Figure 8.Long-term light curve of Arp187 based on the AGN indicators with multiple physical scales. See Table2for the details of the each AGN indicator.
for at least the last 10yr (see also Figure8), the dynamical and
thermal timescales are unlikely and too short to be happening. On the other hand, the viscous timescale seems to be a little longer compared to the quenching timescale of <104 yr. However, because the NLR traces higher energy UV photons with >10 eV, the corresponding disk region becomes more inner with R10 Rg, whose viscous timescale is 500 yr.
This is consistent with our strongest upper bound of∼3000yr (see Table 2). Thus, our rough estimation suggests that the
viscous timescale most closely matches the observed quench-ing timescale.
3.3. Comparison between Dying AGN and Fading AGN The absence of small-scale AGN signatures and the timescale discussed in Section 3.2 support that Arp187 has been in a later fading phase, or dying phase, compared to other fading AGNs because the UV-emitting region in Arp187 likely disappeared, and the large-scale AGN indicators are observable as remnant signs of an AGN. On the other hand, the previously reported fading AGNs are considered to be earlier fading stage because they still host clear UV, MIR, or X-ray emission in the core, suggesting that the UV-emitting region is still alive(e.g., Keel et al.2015,2017; Sartori et al.2018a). We
have summarized the comparison of properties of our dying AGN and fading AGN in Table3.
One important question is how many such dying AGNs have been already reported in the population of fading AGNs from
the literature. Although most fading AGNs still show MIR or X-ray emission in the core, one fading AGN in NGC7252 might fulfill dying the AGN criterion. Schweizer et al. (2013)
showed that NGC7252 hosts large [OIII]λ5007 bright nebulae
that belong to a stream of tidal-tail gas falling back to the host galaxy. The bright[OIII] nebulae require the AGN luminosity
larger than Lbol>5×1042ergs−1, whereas the current X-ray
upper bound gives Lbol<5×1040 ergs−1. Considering the
nebulae distance, NGC7252 might have experienced a luminosity decline by two orders of magnitude over the past 104–5 yr, and the current AGN activity is well below Lbol<10
42
ergs−1, suggesting that the central engine is already dead.
Note that the past inferred AGN luminosity is completely different between Arp187 and NGC7252. Arp187 reached a quasar-like luminosity with Lbol >1046 ergs−1, whereas that of NGC7252 is well below the quasar level or, more likely, Seyfert level luminosity with Lbol>5×1042ergs−1. Schweizer et al.
(2013) also reported that the central gas disk of NGC7252
contains the large amount of molecular gas with >109 Me, suggesting that the AGN feedback activity has failed to remove the gas in the host galaxy. Therefore, the gas content difference between NGC7252 and Arp187 would be a good testbed to investigate the effect of AGN feedback because these two galaxies have already experienced the one cycle of AGN activity for at least 105yr (Schawinski et al. 2015) but with different
AGN luminosity. Table 3
Observational Properties of Dying AGN, Fading AGN, and Changing-look Quasars
Dying AGN(Arp 187) Fading AGN Changing-look Quasar
Definition AGN whose current(small-scale) AGN signature is dead, but past
AGN signature is still alive
AGN with weaker current LAGNcompared to
that of past AGN signatures
Quasars with broad Balmer line(dis)appearance associated with continuum change by a factor
of∼10 Small-scale( 10< pc)
AGN signs
Dead Alive(but weak) Alive
Large-scale( 100> pc) AGN signs
Alive Alive Alive
Jet core features No Yes(?)(B1) L
Jet lobe features Yes L L
LAGNa
D ( ) 103–5 101–4 ∼10
tb
D( ) 10 yr4 104–5yr(using EELR(+1)) ∼1–10yr(C1,C3,C4,C6)
LAGN(current) <1042ergs−1 1043–45ergs−1 >1043ergs−1
LAGN(before fading) ~1046ergs−1 1044–46ergs−1 >1044ergs−1
Redshift(z) 0.04 0.01–0.3(B5, B10) 0.01–1.0(C1,C3,C4,C6)
Origin of variability Viscous Viscous Unknown(thermal?(C8-C10)or
Magnetically elevated disk?(C7))
Host galaxies Merger remnant Merger system/remnants (?)(B5) L
Number of sources found
L ∼20 sources(B1-B13) >40sources(C1-C6)
Most known object names
Arp187(A1) IC2497 (Hanny’s Voorwep)(B1-B8) SDSSJ0159+0033(C1)
(NGC 7252?(A2)) Teacup galaxy(B5,B6,B12), etc. SDSSJ1011+5442(C2), etc.
Note.(1) EELR stands for extended AGN photoionized emission-line region with the physical scale of ∼10kpc. (a) Observed or inferred AGN luminosity decline. (b) The timescale of the AGN luminosity decline of LD AGN.“L” in the column represents that there are no clear observations or consensus from the literature.
References.dying AGN:(A1) Ichikawa et al. (2016), (A2) Schweizer et al. (2013); fading AGN: (B1) Józsa et al. (2009), (B2) Lintott et al. (2009), (B3) Schawinski et al.
(2010), (B4–B6) Keel et al. (2012,2015,2017), (B7, B8) Sartori et al. (2018a,2018b), (B9, B10) Schirmer et al. (2013,2016), (B11) Kawamuro et al. (2017), (B12)
Villar-Martín et al.(2018), (B13) Wylezalek et al. (2018); changing-look quasar: (C1) LaMassa et al. (2015), (C2) Runnoe et al. (2016), (C3) Ruan et al. (2016),
(C4) MacLeod et al. (2016), (C5) Gezari et al. (2017), (C6) Yang et al. (2018), (C7) Dexter & Begelman (2019), (C8) Noda & Done (2018), (C9) Ross et al. (2018),
3.4. Comparison of the Causes of Luminosity Changes between Dying AGNs and Changing-look Quasars
It is worthwhile to note the difference of the accretion mechanism between our dying AGN in Arp187 and a recently discovered class of “changing-look quasars,” in which the strong UV bump and broad emission lines associated with optically bright quasars either appear or disappear on time-scales of years(e.g., LaMassa et al.2015; MacLeod et al.2016; Gezari et al. 2017; Yang et al.2018). The physical processes
causing these changing-look phenomena are hotly debated, but the physical changes in the accretion disk is the likely cause rather than changes in obscuration(e.g., LaMassa et al.2017; Lawrence 2018; Dexter & Begelman2019).
Stern et al. (2018) recently discovered one changing-look
quasar, WISE J1052+1519, and carefully discussed the possible disk timescales matching the year timescale. They found that the dynamical timescale is several weeks, which is therefore too short, whereas the viscous timescale, which would be responsible for the luminosity change of dying AGN, is far too long. Instead, a few-years-long thermal timescale would be a plausible one, matching the observed year scale variability. The similar origin is also proposed for a different changing-look AGN Mrk1018 (Noda & Done 2018).
There-fore, both dying and changing-look AGNs show the luminosity change, but their luminosity changes are likely based on the different physical mechanisms of the accretion disk. Those property differences between dying AGNs and changing-look quasars are also summarized in Table 3.
3.5. Comparison between Dying AGN and Remnant Radio Sources
Our study suggests that the absence of radio core at the center of galaxies would be a good indicator for searching for a dying AGNs. Although they are very rare, some authors have already found candidates of radio galaxies without clear radio core signs, or so-called remnant radio sources. Cordey(1987)
showed that IC2476 has double radio lobes with a separation of 560kpc, but without a clear radio core at the location of the host galaxy. In addition, Dwarakanath & Kale (2009) have
conducted a search for remnant radio sources using VLA 74MHz survey (VLSS; 80 arcsec spatial resolution) and NRAO VLA Sky Survey(NVSS; 45 arcsec spatial resolution) through the search of very steep radio sources whose spectral index is α<−1.8 (where fν∝να) between 74MHz and 1.4GHz. Of the ∼104 parent sample, they found 10 such candidates and the spectral age estimation of jet lobes gives the fading age of>10 Myr.
The timescale found in remnant radio sources is at least two orders of magnitude longer than the fading phase traced for Arp187. This discrepancy is natural because their steep spectral selection method is sensitive to longer jet age with >107yr at the frequency of ∼100MHz (e.g., Jamrozy et al.
2008) and their moderate spectral resolution of 80arcsec is
equivalent to the physical angular size of ∼260kpc, or the corresponding kinematic age of tdyn∼8×10⁶yr at z∼0.2,
where most of the samples are found. Thus, previous radio studies are sensitive to trace much longer AGN activities with >10 Myr. Considering the typical quasar lifetime of ∼30Myr (e.g., Hopkins et al.2006; Inayoshi et al.2018), remnant radio
sources are more suitable to trace a comparable timescale of the
AGN lifetime rather than the AGN fading timescale traced in this study.
Recently, higher spatial resolution surveys are ongoing using Low-Frequency Array (LOFAR; van Haarlem et al. 2013).
LOFAR covers the largely unexplored low-frequency range between 10–240MHz, and has the resolution of ∼6arcsec at 150MHz. This would give an opportunity to search for smaller, which is equivalent to younger, dying radio sources at the age of ∼1Myr. The initial-stage surveys have already found new remnant radio source candidates (e.g., Mahatma et al.2018), and future LOFAR surveys would give us a more
statistically significant number of such younger remnant radio sources and would help to create a more complete picture of both of AGN lifetime and dying phase(also see a recent review by Morganti2017).
3.6. Future Observations
There is some room for the further constraints of the AGN activities of Arp187. JWST/MIRI will give us the nuclear MIR spectra with the least host galaxy contamination with great sensitivity. The X-ray satellite NuSTAR is going to constrain the current AGN activity. Recently, thanks to the great sensitivity at E>10 keV, NuSTAR revealed that a fading AGN candidate in IC2497 is actually a Compton-thick AGN (Sartori et al.2018a),
whose nuclear X-ray emission could not be discovered in the previous X-ray satellites such as Chandra, XMM/Newton, and even with Suzaku(Schawinski et al.2010). Although the same
discovery is unlikely for Arp187, because the MIR emission is known to be considerably weak, NuSTAR will constrain the nuclear activity down tolog(L2 10– erg s-1)42even with the Compton-thick absorption oflogNH24.3. Finally, the optical or near-IR IFU will also give us the detailed NLR size which is poorly constrained with the current study.
4. Conclusion
We have compiled the multiwavelength AGN signatures of dying AGN candidate Arp187, on the basis of the combina-tions of the newly conducted ALMA observacombina-tions and the archival VLA 5–10GHz data, 6dF optical spectrum,NEOWISE, and ALLWISE IR data. Our results show that the AGN in Arp187 is a bona fide dying AGN, whose central engine is already dead, but the large-scale AGN indicators are still observable as the remnant of the past AGN activity. The central engine of Arp187 has experienced the drastic luminosity decline by a factor of 103–5within the last 104yr. Our rough estimation suggests that the viscous timescale most closely matches the obtained timescale in this study. This supports that Arp187 has been in a later fading phase whose UV-emitting region in the accretion disk is likely to be almost disappeared, whereas other fading AGNs show clear signs that the UV-emitting region is still alive.
We thank the anonymous referee who offered a positive and helpful report. We thank Kazunori Akiyama, Luca Comisso, Kohei Inayoshi, Masatoshi Imanishi, Mitsuru Kokubo, Hiroshi Nagai, and Hirofumi Noda for fruitful discussions. We also would like to thank Jaejin Shin for giving us the spectralfitting result of the optical spectrum.
This paper makes use of the following ALMA data: ADS/ JAO.ALMA#2015.1.01005.S. ALMA is a partnership of ESO (representing its member states), NSF (USA) and NINS
(Japan), together with NRC (Canada) and NSC and ASIAA (Taiwan) and KASI (Republic of Korea), in cooperation with the Republic of Chile. The Joint ALMA Observatory is operated by ESO, AUI/NRAO and NAOJ. In addition, this paper includes observational material taken with VLA, which is one of the NRAO instruments. The National Radio Astronomy Observatory is a facility of the National Science Foundation operated under cooperative agreement by Associated Univer-sities, Inc. This paper also makes use of data products from the WISE, which is a joint project of the University of California, Los Angeles, and the Jet Propulsion Laboratory/California Institute of Technology, funded by the National Aeronautics and Space Administration.
This work is supported by Program for Establishing a Consortium for the Development of Human Resources in Science and Technology, Japan Science and Technology Agency (JST) and is partially supported by Japan Society for the Promotion of Science (JSPS) KAKENHI (18K13584; KI, 18J01050; YT, 16K17672; MS). K.M. is supported by JSPS Overseas Research Fellowships.
Facilities: ALMA, VLA, WISE, Spitzer, Chandra, XMM-Newton, Swift/BAT.
Software: astropy (Astropy Collaboration et al. 2013),
Matplotlib (Hunter2007), Pandas (McKinney2010).
ORCID iDs
Kohei Ichikawa https://orcid.org/0000-0002-4377-903X
Hyun-Jin Bae https://orcid.org/0000-0001-5134-5517
Taiki Kawamuro https://orcid.org/0000-0002-6808-2052
Kenta Matsuoka https://orcid.org/0000-0002-2689-4634
Yoshiki Toba https://orcid.org/0000-0002-3531-7863
References
Abazajian, K. N., Adelman-McCarthy, J. K., Agüeros, M. A., et al. 2009, ApJS,182, 543
Alexander, D. M., & Hickox, R. C. 2012,NewAR,56, 93
Alloin, D., Pelat, D., Phillips, M., & Whittle, M. 1985,ApJ,288, 205
Antonucci, R. 1993,ARA&A,31, 473
Antonucci, R. R. J., & Cohen, R. D. 1983,ApJ,271, 564
Asmus, D., Gandhi, P., Hönig, S. F., Smette, A., & Duschl, W. J. 2015, MNRAS,454, 766
Astropy Collaboration, Robitaille, T. P., Tollerud, E. J., et al. 2013, A&A,
558, A33
Bae, H.-J., Woo, J.-H., Karouzos, M., et al. 2017,ApJ,837, 91
Bennert, N., Falcke, H., Schulz, H., Wilson, A. S., & Wills, B. J. 2002,ApJL,
574, L105
Bennert, N., Jungwiert, B., Komossa, S., Haas, M., & Chini, R. 2006,A&A,
456, 953
Berney, S., Koss, M., Trakhtenbrot, B., et al. 2015,MNRAS,454, 3622
Blandford, R. D., & Königl, A. 1979,ApJ,232, 34
Calzetti, D., Kinney, A. L., & Storchi-Bergmann, T. 1994,ApJ,429, 582
Cordey, R. A. 1987,MNRAS,227, 695
Czerny, B. 2006, in ASP Conf. Ser. 360, AGN Variability from X-Rays to Radio Waves, ed. C. M. Gaskell et al.(San Francisco, CA: ASP),265
Davis, S. W., Stone, J. M., & Pessah, M. E. 2010,ApJ,713, 52
Dexter, J., & Begelman, M. C. 2019,MNRAS,483, L17
Domínguez, A., Siana, B., Henry, A. L., et al. 2013,ApJ,763, 145
Dwarakanath, K. S., & Kale, R. 2009,ApJL,698, L163
Evans, I. N., Primini, F. A., Glotfelty, K. J., et al. 2010,ApJS,189, 37
Falcke, H., Körding, E., & Markoff, S. 2004,A&A,414, 895
Fraquelli, H. A., Storchi-Bergmann, T., & Levenson, N. A. 2003,MNRAS,
341, 449
Gandhi, P., Horst, H., Smette, A., et al. 2009,A&A,502, 457
Gezari, S., Hung, T., Cenko, S. B., et al. 2017,ApJ,835, 144
Godfrey, L. E. H., Morganti, R., & Brienza, M. 2017,MNRAS,471, 891
Greene, J. E., Zakamska, N. L., Ho, L. C., & Barth, A. J. 2011,ApJ,732, 9
Hada, K., Doi, A., Kino, M., et al. 2011,Natur,477, 185
Hainline, K. N., Hickox, R., Greene, J. E., Myers, A. D., & Zakamska, N. L. 2013,ApJ,774, 145
Heckman, T. M., Kauffmann, G., Brinchmann, J., et al. 2004,ApJ,613, 109
Heckman, T. M., Ptak, A., Hornschemeier, A., & Kauffmann, G. 2005,ApJ,
634, 161
Hirose, S., Blaes, O., & Krolik, J. H. 2009,ApJ,704, 781
Hopkins, P. F., Hernquist, L., Cox, T. J., et al. 2006,ApJS,163, 1
Humphrey, A., Villar-Martín, M., Sánchez, S. F., et al. 2010,MNRAS,408, L1
Hunter, J. D. 2007,CSE,9, 90
Husemann, B., Wisotzki, L., Sánchez, S. F., & Jahnke, K. 2013, A&A,
549, A43
Ichikawa, K., Imanishi, M., Ueda, Y., et al. 2014,ApJ,794, 139
Ichikawa, K., & Inayoshi, K. 2017,ApJL,840, L9
Ichikawa, K., Ricci, C., Ueda, Y., et al. 2017,ApJ,835, 74
Ichikawa, K., Ricci, C., Ueda, Y., et al. 2019,ApJ,870, 16
Ichikawa, K., & Tazaki, R. 2017,ApJ,844, 21
Ichikawa, K., Ueda, J., Shidatsu, M., Kawamuro, T., & Matsuoka, K. 2016, PASJ,68, 9
Ichikawa, K., Ueda, Y., Terashima, Y., et al. 2012,ApJ,754, 45
Inayoshi, K., & Haiman, Z. 2016,ApJ,828, 110
Inayoshi, K., Ichikawa, K., & Haiman, Z. 2018,ApJL,863, L36
Jamrozy, M., Konar, C., Machalski, J., & Saikia, D. J. 2008,MNRAS,385, 1286
Jones, D. H., Read, M. A., Saunders, W., et al. 2009,MNRAS,399, 683
Józsa, G. I. G., Garrett, M. A., Oosterloo, T. A., et al. 2009,A&A,500, L33
Jun, H. D., Im, M., Lee, H. M., et al. 2015,ApJ,806, 109
Karouzos, M., Woo, J.-H., & Bae, H.-J. 2016,ApJ,819, 148
Kato, S., Fukue, J., & Mineshige, S. 2008, Black-Hole Accretion Disks— Towards a New Paradigm(Kyoto, Japan),549
Kauffmann, G., Heckman, T. M., Tremonti, C., et al. 2003,MNRAS,346, 1055
Kawamuro, T., Schirmer, M., Turner, J. E. H., Davies, R. L., & Ichikawa, K. 2017,ApJ,848, 42
Keel, W. C., Lintott, C. J., Maksym, W. P., et al. 2017,ApJ,835, 256
Keel, W. C., Lintott, C. J., Schawinski, K., et al. 2012,AJ,144, 66
Keel, W. C., Maksym, W. P., Bennert, V. N., et al. 2015,AJ,149, 155
Kewley, L. J., Dopita, M. A., Sutherland, R. S., Heisler, C. A., & Trevena, J. 2001,ApJ,556, 121
Kewley, L. J., Groves, B., Kauffmann, G., & Heckman, T. 2006,MNRAS,
372, 961
Komossa, S., Xu, D., Zhou, H., Storchi-Bergmann, T., & Binette, L. 2008, ApJ,680, 926
Kormendy, J., & Ho, L. C. 2013,ARA&A,51, 511
LaMassa, S. M., Cales, S., Moran, E. C., et al. 2015,ApJ,800, 144
LaMassa, S. M., Heckman, T. M., Ptak, A., et al. 2010,ApJ,720, 786
LaMassa, S. M., Heckman, T. M., Ptak, A., & Urry, C. M. 2013,ApJL,765, L33
LaMassa, S. M., Yaqoob, T., & Kilgard, R. 2017,ApJ,840, 11
Lawrence, A. 2018,NatAs,2, 102
Lintott, C. J., Schawinski, K., Keel, W., et al. 2009,MNRAS,399, 129
Liu, G., Zakamska, N. L., Greene, J. E., Nesvadba, N. P. H., & Liu, X. 2013, MNRAS,436, 2576
MacLeod, C. L., Ross, N. P., Lawrence, A., et al. 2016,MNRAS,457, 389
Mahatma, V. H., Hardcastle, M. J., Williams, W. L., et al. 2018,MNRAS,
475, 4557
Mainzer, A., Bauer, J., Cutri, R. M., et al. 2014,ApJ,792, 30
Mainzer, A., Bauer, J., Grav, T., et al. 2011,ApJ,731, 53
Malkan, M. A., & Sargent, W. L. W. 1982,ApJ,254, 22
Marconi, A., Risaliti, G., Gilli, R., et al. 2004,MNRAS,351, 169
Markwardt, C. B. 2009, in ASP Conf. Ser. 411, Astronomical Data Analysis Software and Systems XVIII, ed. D. A. Bohlender, D. Durand, & P. Dowler (San Francisco, CA: ASP),251
Mateos, S., Alonso-Herrero, A., Carrera, F. J., et al. 2012,MNRAS,426, 3271
Mateos, S., Carrera, F. J., Alonso-Herrero, A., et al. 2015,MNRAS,449, 1422
Matsuoka, K., & Woo, J.-H. 2015,ApJ,807, 28
McConnell, N. J., Ma, C.-P., Gebhardt, K., et al. 2011,Natur,480, 215
McKinney, W. 2010, in Proc. 9th Python in Science Conf., Data Structures for Statistical Computing in Python, ed. S. van der Walt & J. Millman, 51,
http://conference.scipy.org/proceedings/scipy2010/mckinney.html
McLure, R. J., & Dunlop, J. S. 2004,MNRAS,352, 1390
Merloni, A., Heinz, S., & di Matteo, T. 2003,MNRAS,345, 1057
Morganti, R. 2017,NatAs,1, 596
Murgia, M., Fanti, C., Fanti, R., et al. 1999, A&A,345, 769
Nagai, H., Inoue, M., Asada, K., Kameno, S., & Doi, A. 2006,ApJ,648, 148
Nagar, N. M., Oliva, E., Marconi, A., & Maiolino, R. 2002,A&A,391, L21
Netzer, H. 2003,ApJL,583, L5
Netzer, H. 2009,MNRAS,399, 1907
Netzer, H., Mainieri, V., Rosati, P., & Trakhtenbrot, B. 2006,A&A,453, 525
Novak, G. S., Ostriker, J. P., & Ciotti, L. 2011,ApJ,737, 26
Oh, K., Koss, M., Markwardt, C. B., et al. 2018,ApJS,235, 4
Panessa, F., Bassani, L., Cappi, M., et al. 2006,A&A,455, 173
Ricci, C., Trakhtenbrot, B., Koss, M. J., et al. 2017a,ApJS,233, 17
Ricci, C., Trakhtenbrot, B., Koss, M. J., et al. 2017b,Natur,549, 488
Ricci, C., Ueda, Y., Koss, M. J., et al. 2015,ApJL,815, L13
Rigby, J. R., Diamond-Stanic, A. M., & Aniano, G. 2009,ApJ,700, 1878
Rosen, S. R., Webb, N. A., Watson, M. G., et al. 2016,A&A,590, A1
Ross, N. P., Ford, K. E. S., Graham, M., et al. 2018,MNRAS,480, 4468
Rothberg, B., & Joseph, R. D. 2004,AJ,128, 2098
Ruan, J. J., Anderson, S. F., Cales, S. L., et al. 2016,ApJ,826, 188
Runnoe, J. C., Cales, S., Ruan, J. J., et al. 2016,MNRAS,455, 1691
Saikia, D. J., & Jamrozy, M. 2009, BASI, 37, arXiv:1002.1841
Sánchez-Blázquez, P., Peletier, R. F., Jiménez-Vicente, J., et al. 2006, MNRAS,371, 703
Sartori, L. F., Schawinski, K., Koss, M. J., et al. 2018a,MNRAS,474, 2444
Sartori, L. F., Schawinski, K., Trakhtenbrot, B., et al. 2018b, MNRAS,
476, L34
Schawinski, K., Evans, D. A., Virani, S., et al. 2010,ApJL,724, L30
Schawinski, K., Koss, M., Berney, S., & Sartori, L. F. 2015, MNRAS,
451, 2517
Schirmer, M., Diaz, R., Holhjem, K., Levenson, N. A., & Winge, C. 2013,ApJ,
763, 60
Schirmer, M., Malhotra, S., Levenson, N. A., et al. 2016, MNRAS,
463, 1554
Schmitt, H. R., Donley, J. L., Antonucci, R. R. J., et al. 2003,ApJ,597, 768
Schweizer, F., Seitzer, P., Kelson, D. D., Villanueva, E. V., & Walth, G. L. 2013,ApJ,773, 148
Shakura, N. I., & Sunyaev, R. A. 1973, A&A,24, 337
Shen, Y., Richards, G. T., Strauss, M. A., et al. 2011,ApJS,194, 45
Soltan, A. 1982,MNRAS,200, 115
Stern, D., Assef, R. J., Benford, D. J., et al. 2012,ApJ,753, 30
Stern, D., McKernan, B., Graham, M. J., et al. 2018,ApJ,864, 27
Toba, Y., Bae, H.-J., Nagao, T., et al. 2017,ApJ,850, 140
Toba, Y., Oyabu, S., Matsuhara, H., et al. 2014,ApJ,788, 45
Tohline, J. E., & Osterbrock, D. E. 1976,ApJL,210, L117
Trakhtenbrot, B. 2014,ApJL,789, L9
Ueda, J., Iono, D., Yun, M. S., et al. 2014,ApJS,214, 1
Ueda, Y., Hashimoto, Y., Ichikawa, K., et al. 2015,ApJ,815, 1
van Haarlem, M. P., Wise, M. W., Gunst, A. W., et al. 2013,A&A,556, A2
Vanden Berk, D. E., Richards, G. T., Bauer, A., et al. 2001,AJ,122, 549
Veilleux, S., & Osterbrock, D. E. 1987,ApJS,63, 295
Villar-Martín, M., Cabrera-Lavers, A., Humphrey, A., et al. 2018,MNRAS,
474, 2302
Voges, W., Aschenbach, B., Boller, T., et al. 1999, A&A,349, 389
Wright, E. L., Eisenhardt, P. R. M., Mainzer, A. K., et al. 2010,AJ,140, 1868
Wu, X.-B., Wang, F., Fan, X., et al. 2015,Natur,518, 512
Wylezalek, D., Zakamska, N. L., Greene, J. E., et al. 2018,MNRAS,474, 1499
Yang, Q., Wu, X.-B., Fan, X., et al. 2018,ApJ,862, 109
Yu, Q., & Tremaine, S. 2002,MNRAS,335, 965
Yuan, F., & Cui, W. 2005,ApJ,629, 408


![I, §3] that the Schur functionsλ(x1](data:image/gif;base64,R0lGODlhAQABAIAAAP///wAAACH5BAEAAAAALAAAAAABAAEAAAICRAEAOw==)